During a recent discussion in the Green Room, we reviewed several candlestick pattern variations while analyzing various stocks. Two of them stood out because, while the most recent candle formations looked similar, the structures leading into those patterns were very different.
I will explain why it matters using these charts.
More...
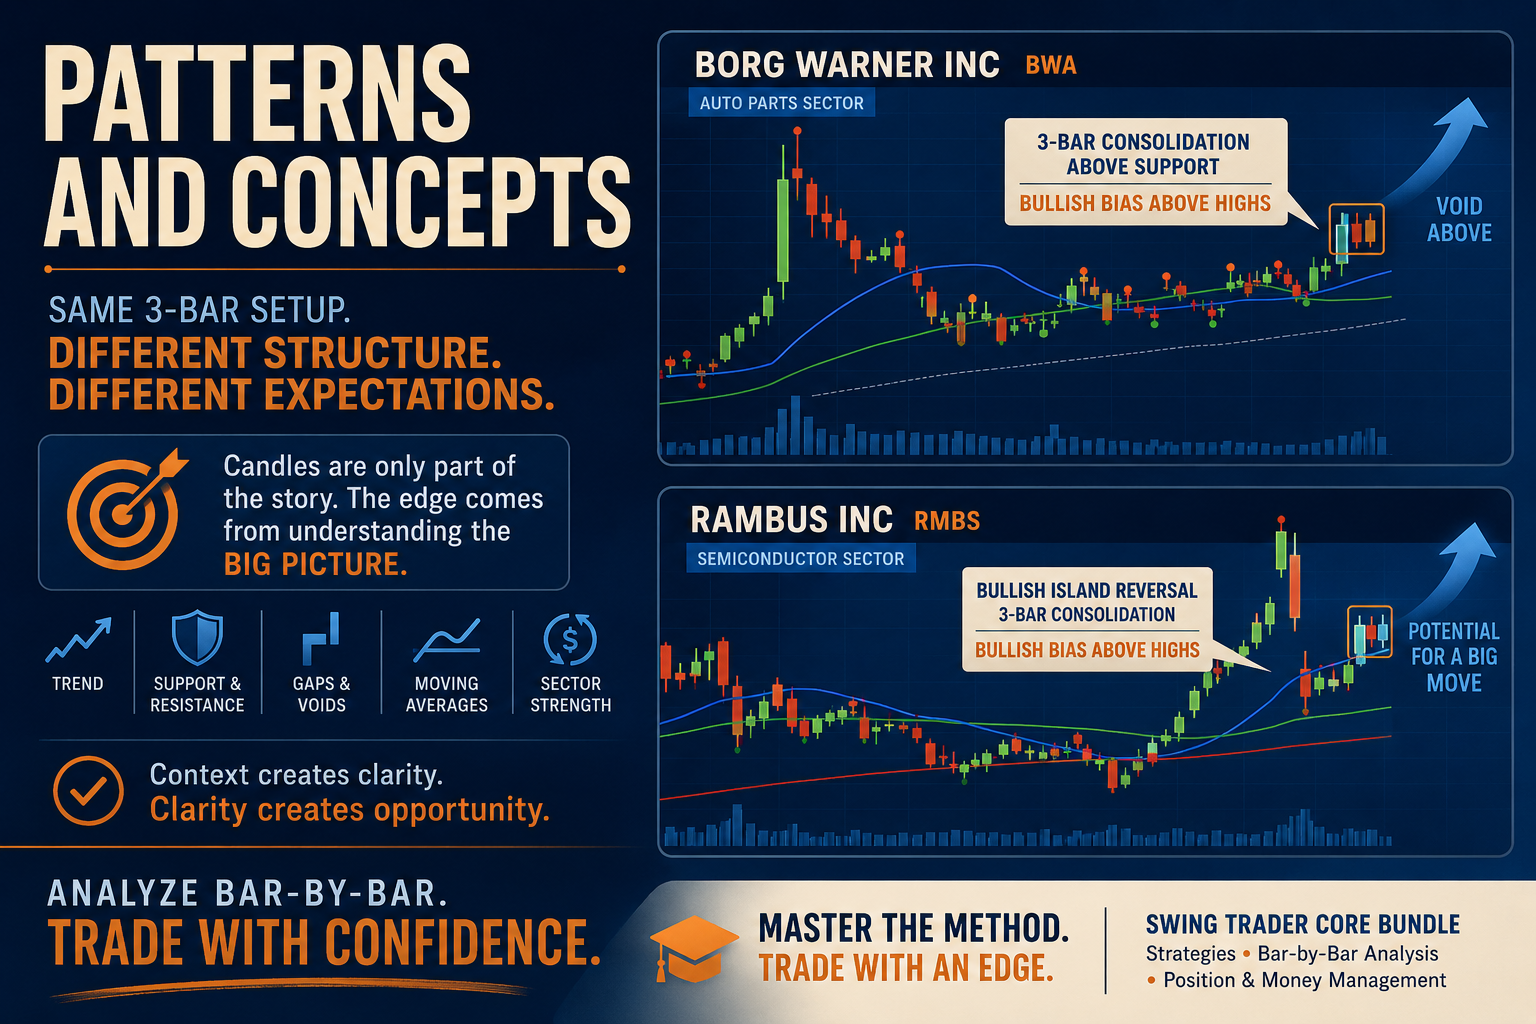
Candlestick Patterns and Big Picture Concepts
Many traders focus only on the candles themselves and ignore the context surrounding them. In MTS, the candles are only part of the story. The real edge comes from understanding what those candles are communicating within the bigger picture — trend, support, resistance, gaps, voids, moving averages, sector strength, and market conditions.
Both of the stocks below developed similar three-bar combinations. However, the probabilities and expectations were very different because of the structures surrounding them.
Before reviewing them, note that this analysis is based on swing trading concepts. However, the same process can be used by day traders to establish directional bias before drilling down into lower time frames of their choosing.
There are many detailed explanations of these concepts in our recorded training videos and in the Mastering Candlesticks: Bar-by-Bar Analysis course for swing and day traders.
Borg Warner - BWA
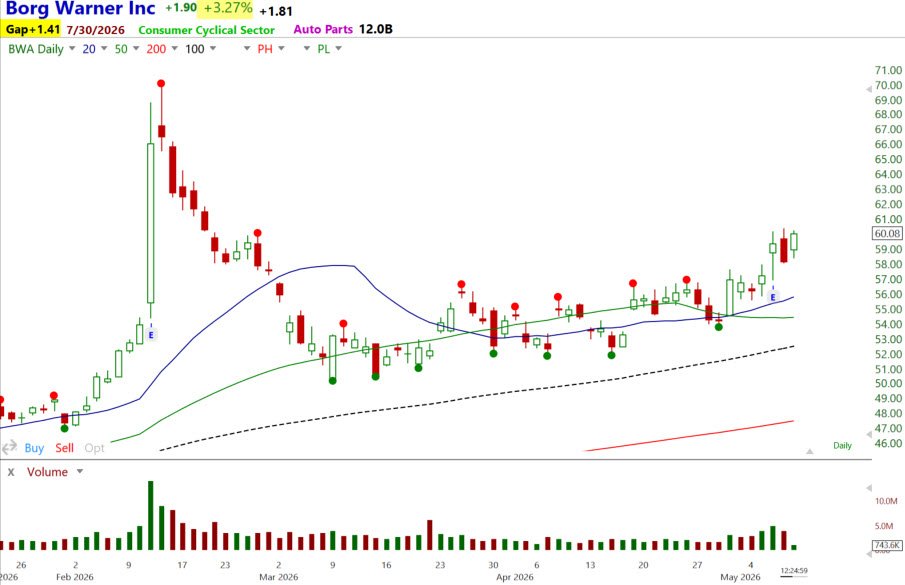
Borg Warner (BWA) is in the Auto Parts sector.
After reporting earnings in February, BWA accelerated sharply higher within an existing uptrend. Moves of that magnitude often create short-term extension risk. Prices become stretched too far away from meaningful support, and the moving averages we use begin signaling that a correction or pause is likely.
That doesn’t necessarily mean prices must collapse, but it does suggest the easy part of the move may be over.
The broader market correction in February accelerated the retracement further than many expected, bringing prices back toward the original breakout area. Once there, the stock stabilized and spent the next two months moving sideways as it built a base.
During that consolidation, sellers repeatedly attempted to push prices lower, but buyers consistently stepped in. New Pivot Lows and Pivot Highs formed, creating a well-defined trading range and establishing meaningful support underneath price.
At the same time, the sharp decline from February, followed by weeks of sideways consolidation, created what we call a tradable void above current prices.
On April 30, just ahead of earnings, a bullish wide-range bar formed and closed above recent Pivot Highs. That was an important clue. A move of that size before earnings often suggests institutions are positioning ahead of the report.
Of course, institutions can be wrong. But in this case, earnings produced a strong gap higher, with prices pushing back toward the February resistance area.
Over the last several days, BWA has paused and formed a tight three-bar consolidation near the highs. Thursday produced a relatively large bearish candle, but Friday immediately negated much of that weakness by gapping higher and trading near the day's high.
That sequence creates a "Thought Process" that leads to a conclusion - a trading opportunity.
When viewed in the context of the larger structure — the base, the support underneath, the void above, and the prior institutional buying — the odds favor higher prices if the stock can trade above the highs of this three-bar consolidation.
This is where Bar-by-Bar analysis becomes so powerful. The candles themselves are only part of the message. Understanding where they form within the broader structure helps traders develop a higher-probability bias rather than reacting emotionally to every red or green candle.
Rambus - RMBS
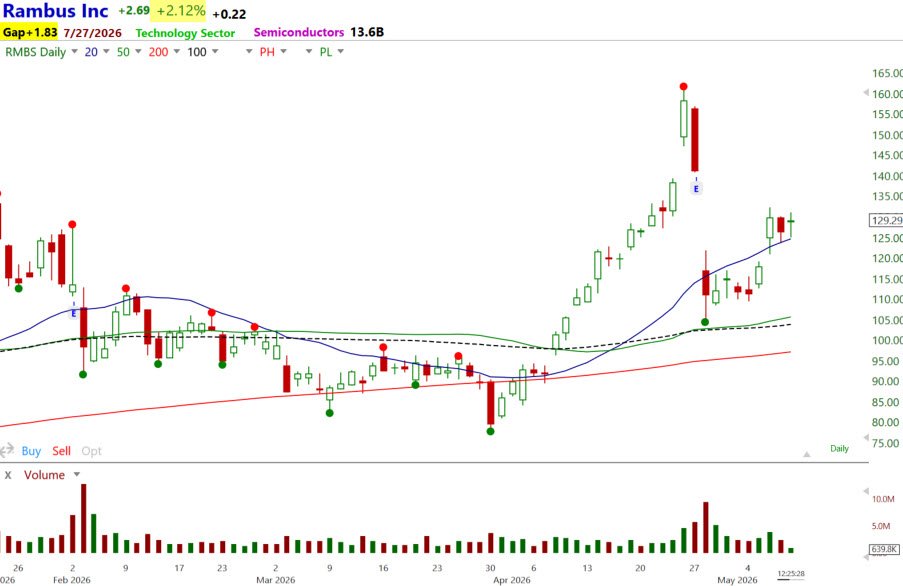
RMBS is in the Semiconductor sector.
At first glance, the most recent candles look similar to BWA — an up candle, followed by a down candle, followed by another bullish day. But again, the candles themselves are not the focus. The message behind them is.
This is where many traders get trapped. They focus on a few candles while ignoring the larger structure surrounding them.
RMBS also experienced a correction in February and eventually broke support toward the end of March below. Then, as the broader markets reversed sharply higher in early April, RMBS also exploded higher.
From the April low to the late-April high, the stock advanced nearly 100% in roughly two weeks. That type of move is extremely powerful, but it also creates instability.
When earnings were released, the market’s reaction was disappointing. Prices collapsed sharply, giving back more than 30% of the prior advance in just a few days.
That kind of volatility often pushes swing traders to the sidelines temporarily.
Structurally, however, the stock remained above intermediate and longer-term support. The 50- and 200-day moving averages were still rising below price, suggesting that while the stock had become unstable, it had not completely broken down.
As RMBS moved sideways after the earnings decline, it wasn’t unreasonable to think lower prices were possible. However, there was also little evidence that an immediate breakdown was likely. The stock was sitting in support, with moving averages beneath it, making aggressive short positions less likely.
Three days ago, prices gapped higher out of a six-day consolidation.
That created what is commonly called a bullish island reversal — a gap-down consolidation followed by a gap-up, leaving the prior candles isolated or “abandoned.” More importantly, the gap-up repaired some of the technical damage created by the earnings collapse.
Even so, this setup does not carry the same probabilities as BWA. Here is why.
BWA spent months building support and stabilizing after its correction. RMBS has had much more violent price action and far less time to build a meaningful base. That difference matters when assessing expectations.
Still, when the recent three-bar consolidation is viewed within the context of the broader structure, enough bullish factors are coming together to create a bullish swing-trade bias above the consolidation highs.
Another important factor discussed in the Green Room was sector strength.
RMBS is in the Semiconductor sector, one of the strongest areas of the market. Strong sectors often attract continued institutional money flow, and traders frequently rotate capital into underperformers within leading groups looking for catch-up opportunities.
The candles may look similar between BWA and RMBS, but the probabilities, expectations, and structure behind them are very different.
That is why successful traders must learn to analyze the “big picture” rather than becoming overly focused on candle names or isolated patterns.
This type of analysis is a core part of the Master Trader Method. We focus on understanding how price behaves Bar-by-Bar within the context of trend, support and resistance, moving averages, sector rotation, and overall market conditions.
The Swing Trader Core Bundle combines Swing Trading Strategies, Mastering Candlesticks: Bar-by-Bar Analysis for Swing and Day Trading, and Advanced Position and Money Management to help traders develop a structured, objective approach to the markets rather than relying on isolated patterns or indicators.
Much of this type of real-time analysis is discussed daily in the Green Room as current market opportunities unfold.
If you have found this post helpful, Share it Forward with other Traders
All the best
Greg Capra