Most traders focus entirely on entries, indicators, and the “perfect setup.” Yet one of the biggest reasons traders lose money is much simpler.
They are trading against the broader market forces driving price movement. It’s estimated that nearly 65% of trading losses come from being on the wrong side of the market.
At Master Trader, the MTS methodology is built around aligning with trend direction, multiple time frames, market internals, sector rotation, and intermarket relationships before taking a trade.
Let's review each of them.
When traders stop fighting the market and begin understanding how money is actually flowing, consistency and confidence improve dramatically.

The Market Comes First
Many traders look only at the stock chart in front of them.
But stocks don’t move independently.
They move within:
- The broader market
- Their sector
- Institutional money flow
- Interest rate and economic environments
A bullish-looking setup inside a weak market often fails.
Master Trader Tip: A stock showing relative strength in a weak market still faces headwinds. When stock strength aligns with market strength, probabilities improve dramatically.
On the other hand, even a questionable setup can move higher in a strong market environment.
Master Trader Tip: A stock showing relative weakness may temporarily rise with a strong market, but weakness often resurfaces quickly when the market stumbles. Sellers remain in control.
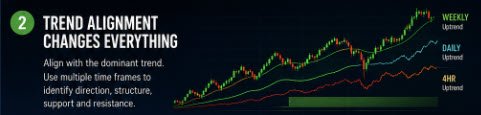
Trend Alignment Changes Everything
One of the biggest mistakes traders make is fighting strong trends.
They short stocks because they “feel too high.”
They buy weak stocks because they “look cheap.”
Professional traders do the opposite.
They align with the dominant trend.
In MTS, we focus heavily on:
- Multiple time frame alignment
- Trend structure
- Support and resistance
- Market strength and weakness
When time frames align together, probabilities improve dramatically.
Master Trader Tip: Strong trends often stay strong far longer than most traders expect. Instead of trying to pick tops and bottoms, focus on aligning with the dominant trend, multiple time frames, and market direction.
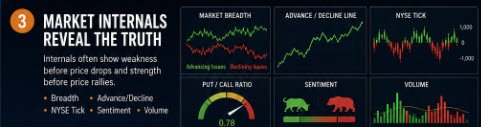
Market Internals Reveal the Truth
Price doesn’t always tell the full story.
Market internals often reveal weakness before price declines and strength before price rallies.
We monitor:
- Breadth
- Advance/decline data
- NYSE Tick
- Sentiment
- Volume patterns
These tools help traders avoid chasing extended moves at the wrong time.
Master Trader Tip: Strong price movement without strong market internals is often a warning sign, not confirmation.

Sector Rotation Matters
Strong sectors tend to keep attracting money.
Weak sectors often continue underperforming.
Many traders lose because they buy weak stocks in weak sectors while institutions are moving capital elsewhere.
Following sector strength puts traders on the side of institutional money flow instead of fighting it.
Master Trader Tip: Institutional money flow leaves footprints. Strong sectors tend to continue attracting capital while weak sectors often remain under pressure.

Intermarket Analysis Provides the Bigger Picture
Markets are connected.
Interest rates, bonds, oil, currencies, and economic expectations all influence stock prices.
Understanding those relationships gives traders a major advantage most retail traders never consider.
Master Trader Tip: Markets do not operate in isolation. Interest rates, bonds, oil, currencies, and economic expectations constantly influence institutional decisions and stock prices.
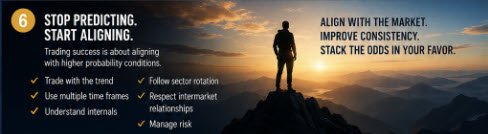
Master Trader Tip Alignment
Trading success is not about predicting every move.
It’s about aligning with higher probability conditions.
That means:
- Trading with the trend
- Using multiple time frames
- Understanding market internals
- Following sector rotation
- Respecting intermarket relationships
Most traders focus only on entries.
Professional traders focus on market alignment first
Master Trader Tip: When trend direction, multiple time frames, sector strength, market internals, and intermarket relationships align together, trading becomes less about guessing and more about putting the odds in your favor.
If you have found this post helpful, Share it Forward with other Traders
All the best
Greg Capra