

Learn How to Recognize Proper Topping Patterns:
Master Trader teaches many price patterns for trading stocks and options.
Did you know that Bottoming and Topping Patterns set up in different forms and trends?
Most are traps to the uneducated trying to pick tops and bottoms. Don’t be a victim and be whipped around.
At Master Trader, we have several criteria to define quality setups based on the structure of the price pattern.
The Structure of the price pattern will speak to us about the relationship between buyers (demand) and sellers (supply) and the likelihood of reversals and trend continuation.
Using Bar-by-Bar Analysis, you will know what any price pattern signals — even one that can tell you to do nothing.
In this Trade Review we are going to show you the signs of how to trade a topping pattern using Master Trader Strategies (MTS).
The same logic obviously applies to bottoming patterns for Breakouts.
With all Setups, we need a Price Void (insignificant resistance to the left for longs, or support for shorts), as you will see here.
Below is a daily chart of Paychex, Inc. (PAYX):
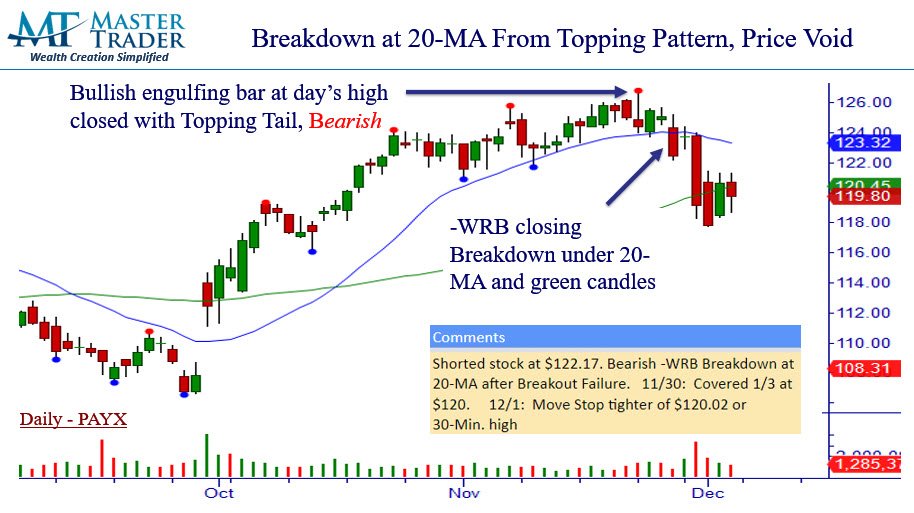
PAYX was in a bullish uptrend on this time frame, which is defined by two or more higher pivot highs and higher pivot lows.
Master Trader teaches many price patterns in uptrends, downtrends, and sideways trends.
The pattern here is a Breakdown from a sideways trend (consolidation in an uptrend) to a potential downtrend.
Since we are fading the strength of the uptrend, it is very important to look for some Shock candle(s)/patterns (i.e., a “Gotcha”) which suggests a warning sign of a continued move higher.
That Candle occurred on 11/22 where marked. The candle at the day’s high was a bullish engulfing Wide Range Bar (+WRB), Bullish.
However, it closed the day with a bearish Topping Tail (TT) which was a Breakout Failure.
The message was that Sellers took control when the candlestick completed.
Now a TT (or BT) is not a Setup or reason to trade; rather, it’s additional information to add to the overall pattern on Multiple Time Frames (MTF).
We put PAYX on our interest list to see what develops after.
The following day closed with a +WRB at the 20-MA, so the bulls are still in control despite the prior day’s TT.
On 11/26 (second arrow), it closed with a-WRB below Support, the 20-MA, and two bullish green candles, Bearish.
Because of the Price Void below (insignificant Support to the left), we recommended to our subscribers to short the stock under the candle’s low.
The analysis is explained in nightly letter videos for subscribers.
Once in a trade, we are in trade management mode. We entered on 11/30, which closed with a -WRB under multiple Pivot Lows (PL), Bearish.
Simply trail stop over a prior day’s high (at least for half) per your trade management rules.
Management updates are sent intra-day by text message to subscribers.
Nice trade!
Get trades like these sent right to you and profit in the Markets!