For institutional traders and retail traders, a measurement being overbought is based on the oscillator used and the oscillator's settings.
The question of which oscillator is best and what settings to use to measure overbought often leads to indecision because of endless choices.
Every trading platform comes with multiple oscillators to choose from, and some platforms allow you to create your own criteria for an oscillator.
Once you choose one or multiple oscillators, you have to decide whether you will use the default settings or other settings.
You may consider using what you've seen used by a technician on CNBC or a webinar. It is reasonable to think they have figured out the correct setup.
The choices are endless, so you can see how this can become confusing to make the right choice to make your trading decisions.
And if you find a particular oscillator in settings that have worked in the past, it doesn't mean that they will work in the future.
And it doesn't mean that it will work on another tradable instrument.
Besides confusing, it is also stressful because you are risking your money on the analysis.
If you used any charting platform and put an oscillator on, you know what I mean.

If you think I have the answer to the right oscillator choice, I don't.
The truth is that overbought is a misleading concept that creates a belief that prices have limited upside or even should retrace.
And price oscillators compound the concept and belief.
Overbought doesn't stop prices from going higher. The current market environment that continues to move higher confirms what I said.
Overbought can and does become more overbought, which can go on for a long time and leave you watching prices move higher.
So, forget the concept of being overbought and the belief that it creates.
Doing so will free you from that hurdle that stops you from understanding why prices move as they do.
The indicator-based methodology of determining price movement is flawed and full of hurdles that stop you from succeeding.
Overbought or oversold is one of them.
If it's not overbought, what is it that we need to know?
As technical traders and investors, we need to know when a market, a sector, a stock, a futures contract, or an ETF has become historically extended.
Extended can become more extended, so we need an objective measurement based on that particular instrument's movement over time.
Becoming extended at the start of a move is exactly what we want to see. It tells us that there is institutional interest that historically is not going away short-term.
As a trend continues over time and institutions and retail traders jump on board the trend and pay higher prices, eventually the trend will accelerate.
Price acceleration moves prices to the point of being extended away from price support, which opens up the door to sizable retracements and risk.
How to measure extended objectively across all tradable instruments
We can do this by simply looking at the price action and comparing the price action from the past to the price action now.
We can also use what we call a "visual aid" to speed up the analysis across all tradable instruments.
We have an objective measure by using simple moving averages and viewing the distance between those moving averages and current prices and moving averages.
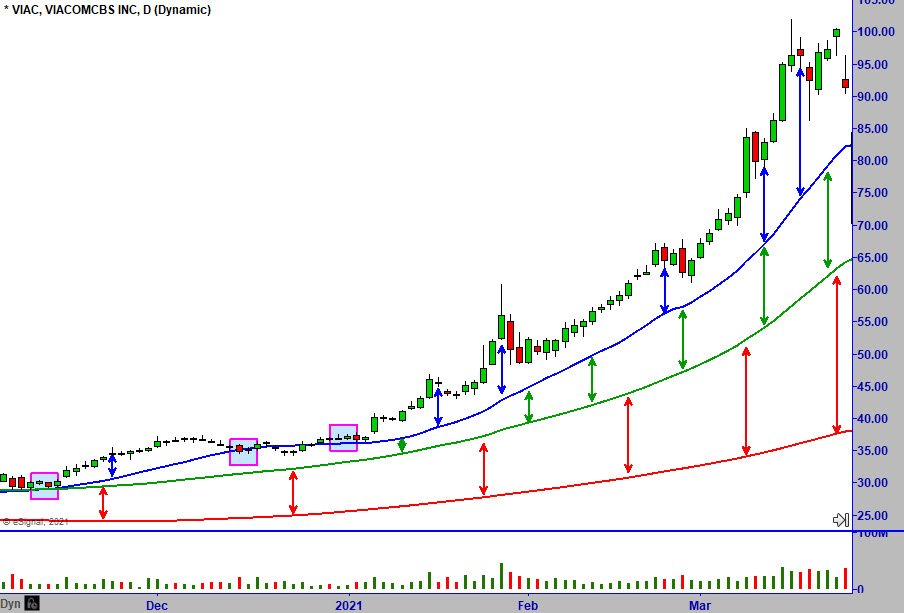
In the above chart are three simple moving averages. The 20-MA (blue line), the 50-MA (green line), and the 200-MA (red line).
Simple moving averages average the closing price over the period chosen.
If the moving averages are flat (not pointed up) and prices are close to them, we know that prices have not accelerated higher. They are moving sideways.
On the chart's far-left side, you can see that prices are touching the 20 and 50-MAs. Those moving averages are above the 200-MA and relatively close.
As buying interest increases and prices move higher, prices will move away from the moving averages and the moving averages further away from each other.
As prices become extended by moving higher without any sideways movement or retracement, more traders becoming hesitant to buy what is perceived as high.
That doesn't mean prices cannot go higher, and it doesn't mean the trend will end.
What it does mean is that the risk of a retracement is increasing.
For that reason, if you're not utilizing sound money management principles, your risk of a substantial loss is high.
The further the moving averages separate from each other over time, the greater the risk of a more significant correction.
The further prices move away from those moving averages by accelerating higher, which will move them away from price support, the greater the risk.
Hopefully, you're starting to think that this type of analysis without indicators is simple, common-sense thinking.
No one knows how high a trend can go, especially when prices are at new all-time highs.
What we do know for a fact is that if we buy when prices have accelerated higher, moving averages are far apart, and prices are far from those moving averages, a trend has been ongoing and the potential for significant retracements is high.
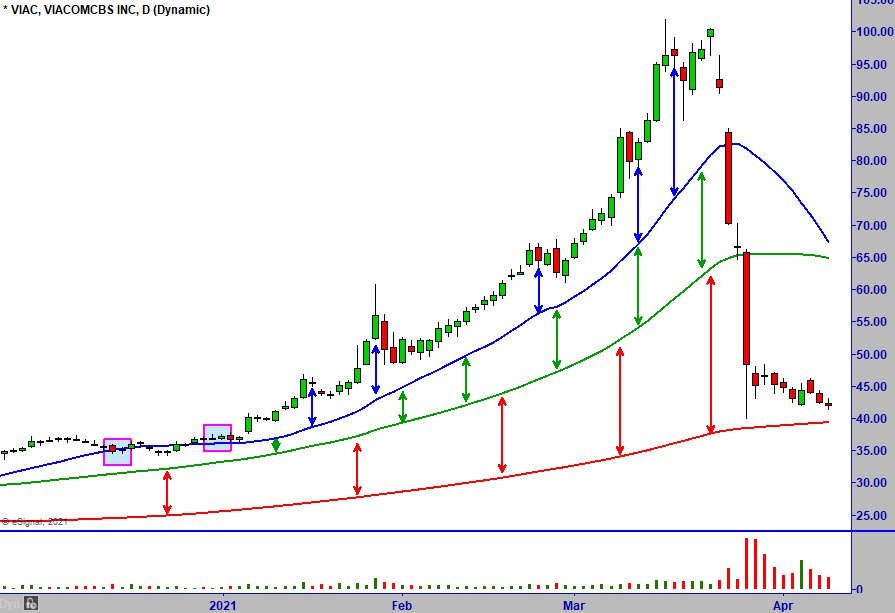
Above is the chart of the same stock that eventually pulled back sharply.
This chart isn't to suggest that all trends will have such a dramatic fall from being extended. However, I picked this example to enforce the potential risk.
Using simple Master Trader Strategies (MTS) that combine multiple technical concepts to make your trading decisions puts the odds are in your favor.
And the risk of a devastating loss to your financial well-being is low.
The Master Trader Swing Trading course has empowered thousands to make proper investing and trading decisions.
At the checkout for the Swing course, you can add at a significant discount the Directional Options Strategies, Advisory Swing and Options letter, or the Advanced Position and Money Management Strategies course.
Apply what you've learned in this educational Chart of The Week to the broader markets today, or any sector or stock of choice to assess the risk now.
Master Trader and You Building Your Financial Future Together!
Happy trading! If you have any questions or comments, please e-mail Greg Capra at Greg@mastertrader.com or Dan Gibby at Dan@mastertrader.com