
 Last week, wasn’t a huge bullish move higher, but it did a lot to improve the technical outlook in many charts that were lagging.
The sectors that we had anticipated to lead a move higher in the letter a couple weeks ago continue to move up, but the momentum certainly slowed down.
And what we anticipated to play catch up in last week’s letter did exactly that.
The Russell 2000, which is been leading this move up made another new all-time high and the NASDAQ composite and the NASDAQ 100 did as well.
Also tweaking out a new all-time high was the Aerospace and Defense sector ETF. While Boeing (BA) was not the best performer in that sector, it’s always the one that is most widely watched and typically does well—it did.
The best performer percentage-wise on the week was National Presto (NPK). While a bit extended at this point, the trend is higher.
The best performer on Friday was Astronics Corp (ATRO) up 5.48%. This one is far from a new all-time high, but it looks like a relatively solid bottom has been put in place on the daily and weekly time frames.
If your patient holding stocks coming out of bottoming patterns (they typically take time to move higher) consider ATRO long with a stop below last week’s low.
The Homebuilding and Home Construction sector ETF’s were top performers last week and they look like they have a bottoming place.
I’ve been looking for these two establish a low for the last couple of weeks in the letter and we will consider buying these on a pullback.
The best performing sector ETF was the Retail sector ETF up just over 6%. While we had a nice again in this ETF when stopped on a trail-stop on the big down day 5-31, missing that move was unfortunate.
The Transportation Index (IYT) ended the week with another weekly Bottoming Tail (BT), which is the third one in a row. So it looks ready to participate in the broader markets recent move up if it can trade above the recent highs.
Dow Jones Industrial Average
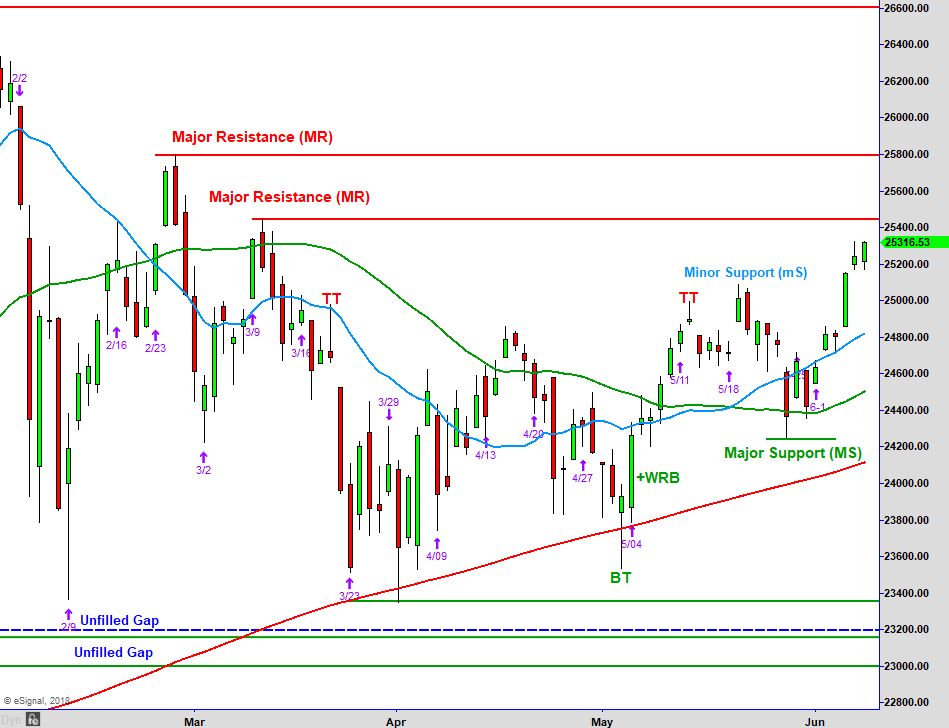
Above is the chart of the Dow Jones Industrial Average that we review each week.
In last week’s letter, I said, “If the Dow can get above last week’s high (it needs to), the prior high just above 25,000 is its next reference point to overcome.” It did that and moved beyond the 25,000 Mark to just over 25,300.
It is now facing its first retest of Major Resistance (MR) just above 25,400. If they can get through that, and it looks like it should, the next reference point of Major Resistance is at 25,800.
I would be very surprised if it could do that without a retracement along the way.
Based on our systematic analysis of support, our first reference point of such is Friday’s low. Considering the small gap down on Friday and very positive close near the higher the day, prices should not trade under that low early in the week.
From a bullish point of view, the Dow should trade above Friday’s high and push to an above that first Major Resistance area.
The trend is up with resistance areas above to overcome. Those initial resistance areas are well below the all-time high in the 26,600 area.
At this point, as long as prices stay above the new major support area marked just above 24,200, the trend is up. That being said, pullbacks should hold in the 25,500 area. That would be the ideal for the bullish scenario.
The market internals that we use as a guide to bullish and bearish extremes have edged into the bullish extreme area. That does not mean that this move higher is over. However, should prices accelerate higher this week; I suspect we would get an extreme that would signal the high probability of a short-term correction.
If you have not subscribed to our new Facebook Live show, Go to this page on Facebook and press the Send Message button. Dan and I discuss various topics on the market, trading concepts and tradable instruments Wednesday’s @12 ET.
Market Overview Video
[s3mv fileName=’June+2018+Letters/BroaderMarkets_6_11_19.mp4′ fileType=’video’ source=’s3′ width=’800′ height=’450′ splashImage=” preLoad=’Y’ autoPlay=’N’ belowVideoHTML=” cuePoint=” redirectURL=” pauseAtCuePoint=’N’ isSecure=’Y’ bucketname=”]
NEW STOCK TRADING IDEAS
Below is a daily chart of Huntington Bancshares Incorporated (HBAN).
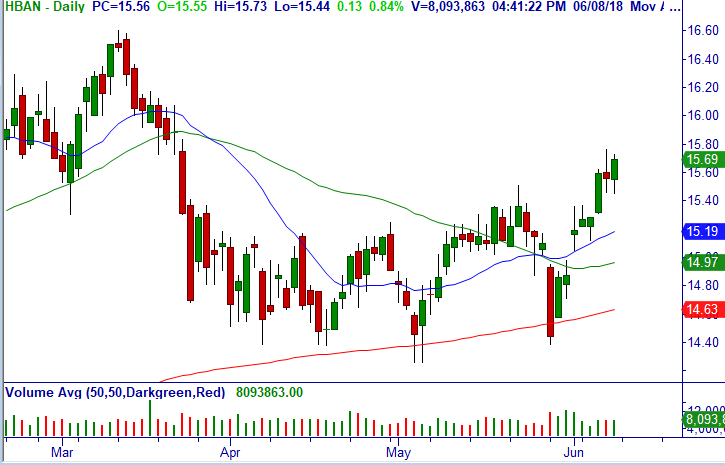
Trade: Over $15.73, consider buying stock.
Technical Setup: Bullish engulfing daily after bullish Breakout daily and weekly, Master Trader Buy Setup monthly.
Stop Loss: $15.44.
Below is a daily chart of Builders FirstSource, Inc. (BLDR).
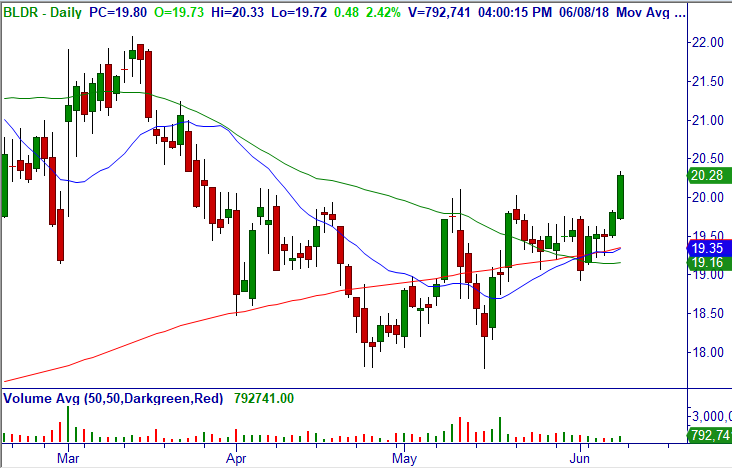
Trade: Provided it opens over $20.10, buy 5-Min. high of stock.
Technical Setup: +WRB Breakout daily and weekly, Master Trader Buy Setup monthly.
Stop Loss: $19.71.
NEW OPTION TRADING IDEAS
Below is a daily chart of iShares Transportation Average ETF (IYT).
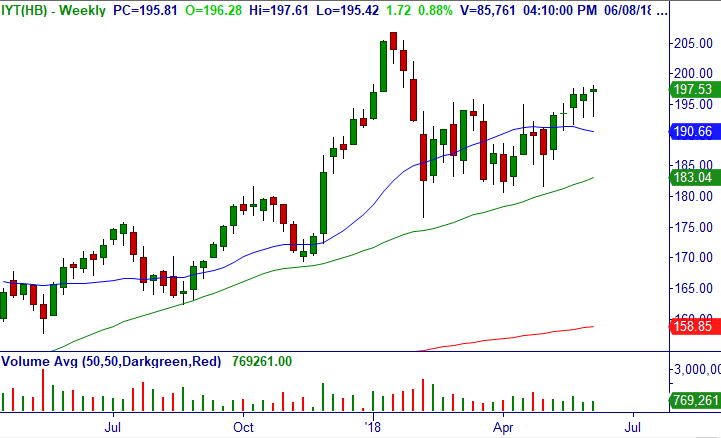
Trade: Over $197.61, consider selling Jul (7/20) $190/180 bull put credit spread (40 DTE) at mid-point but a limit of $1.05/share (closed at $1.12/share).
Technical Setup: Breakout daily and weekly with price void above, with multiple bullish Bottoming Tails (BT) on the weekly chart.
Option Strategy: Bull Put Credit Spread (BPCS).
Stop: $190.75.
Below is a daily chart of Verizon Communications Inc. (VZ).
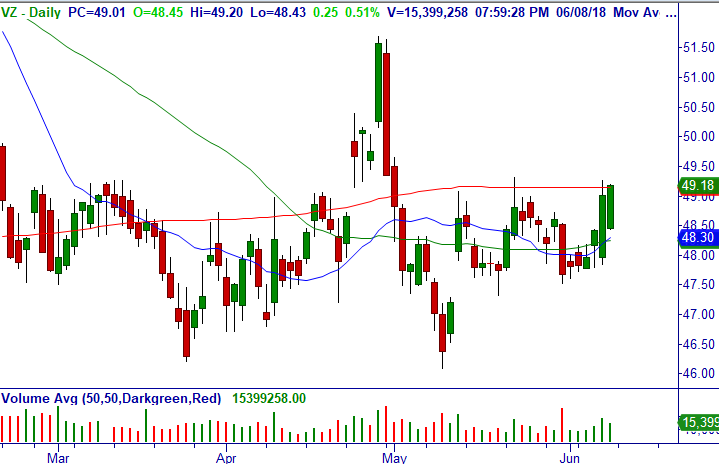
Trade: Provided it opens over $49, over 5-Min. high consider shorting Jul (7/20) $47 naked puts (40 DTE) for a limit of $.43/share (closed at $.45/share).
Technical Setup: Breakout from Major Support daily.
Option Strategy: Short Puts (SP).
Stop Loss: $47.51.
Below is a weekly chart of PulteGroup, Inc. (PHM).
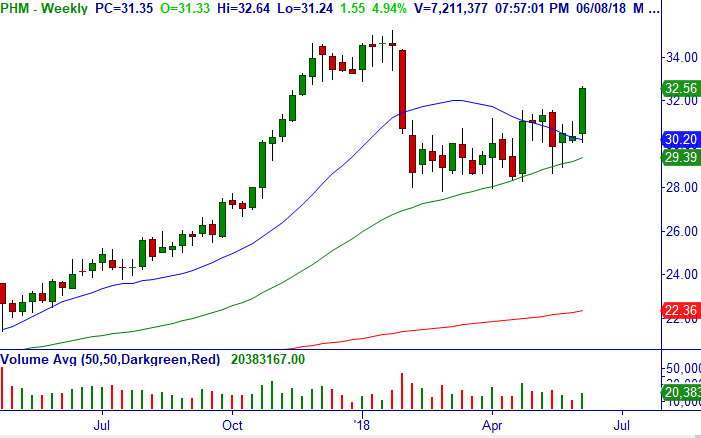
Trade: Provided it opens over $32.25, over 5-Min. high consider shorting Jul (7/20) $30 naked puts (40 DTE) for a limit of $.30/share (closed at $.33/share).
Technical Setup: +WRB Breakout from multi-month consolidation daily and weekly.
Option Strategy: Short Puts (SP).
Stop Loss: $30.06.
Below is a daily chart of Moody’s Corporation (MCO).
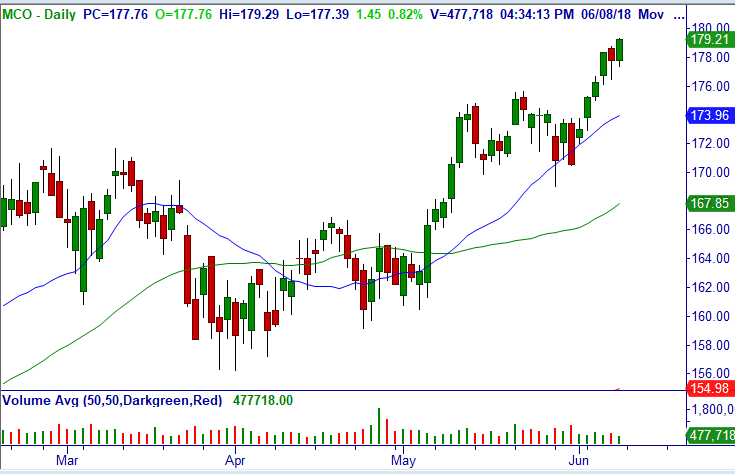
Trade: Over $179.29, consider buying Jun (6/15) $175/180 bull call debit spread (5 DTE) for mid-point which will have at least $.67/share positive time decay (closed at $3.54/share) for a swing trade.
Technical Setup: Continuation Breakout daily, bullish weekly to all-time highs.
Option Strategy: Bull Call Debit Spread (BCDS). Based on closing prices, has potential ROC of 41% ($1.46/share Max Gain divided by $3.54 Debit) if expires over $180/share.
Stop Loss: $176.38.
Below is a daily chart of United Parcel Service, Inc. (UPS).
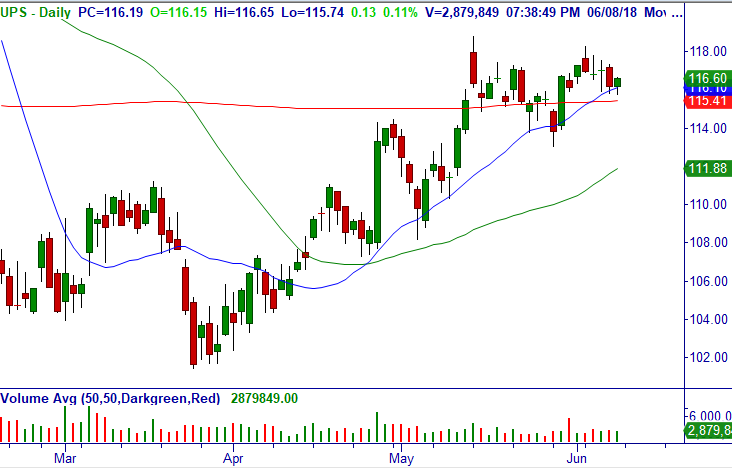
Trade: Over $117.34, consider shorting Jul (7/20) $115/105 bull put credit spread (40 DTE) for mid-point (closed at $1.45/share).
Technical Setup: Possible bullish Head and Shoulders Breakout with strong transports, bullish weekly.
Option Strategy: Bull Put Credit Spread (BPCS).
Stop Loss: $115.58.
Below is a weekly chart of Century Communities, Inc. (CCS).
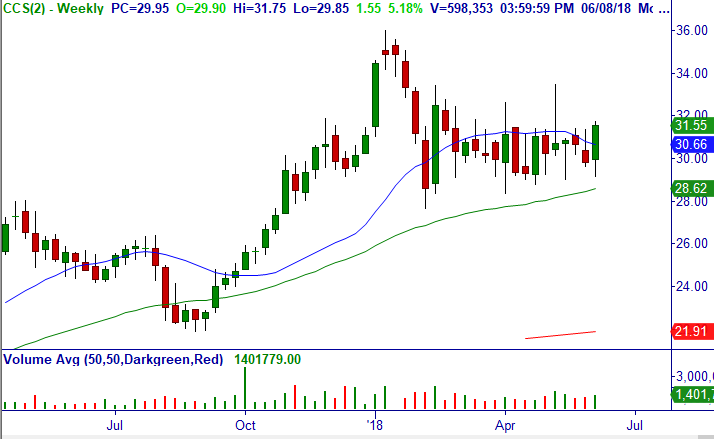
Trade: Provided it opens over $31, over 5-Min. high consider selling Jul (7/20) $30/25 bull put credit spread (40 DTE) for closing mid-point of $.55/share.
Technical Setup: Breakout daily and +WRB Engulfing on Major Support on the weekly chart.
Option Strategy: Bull Put Credit Spread (BPCS).
Stop: $29.84.
OPEN TRADE UPDATE VIDEO
[s3mv fileName=’June+2018+Letters/advisory+trade+update+video+180610.mp4′ fileType=’video’ source=’s3′ width=’800′ height=’450′ splashImage=” preLoad=’Y’ autoPlay=’N’ belowVideoHTML=” cuePoint=” redirectURL=” pauseAtCuePoint=’N’ isSecure=’Y’ bucketname=”]
Thank you for being a loyal subscriber and feel to email us with any questions or comments on anything.
Thank you for all of the positive comments received recently on our advisory letters, webinars and seminars, YouTube videos, new MT Live Show, Facebook private group, Green Room, and even on detailed e-mail communications.
Here is one, which we love receiving since it demonstrates the value of our education in helping investors and traders make money in the markets: “You guys are awesome! Keep up the great work! Learned discipline and how to make $$$ . God bless you! Eric”
Access Trading Credit Spreads Course here, it’s the best $97 dollars spent to get up to speed fast.
Master Trader and You Building Your Financial Future Together
Happy trading! If you have any questions or comments, please e-mail Greg Capra at Greg@mastertrader.com or Dan Gibby at Dan@mastertrader.com
All the best,
Greg Capra
Managing Director of Master Trader
Trading the Pristine Method — Origin and End
Dan Gibby
Chief Options Strategist
Follow Greg on Twitter, YouTube, and StockTwits to get real-time updates and education:
Twitter: @GregCapra
Stocktwits: Greg_Capra
youtube.com/c/mastertrader (please subscribe to receive all the timely stock market updates)
NOTE: Master Trader will show opening and closing prices of all stock and options trades. We recommend that all traders and investors use proper share sizing for positions and money management. However, we cannot recommend what that is for your particular trading style, risk tolerance, or account balance.
We urge you to calculate your own share/position size based on your individualized risk parameters, Trading Plan, and familiarity with the proposed trade strategy and risk. Advanced Management Strategies (AMS) covers in detail foundational and advanced position and money management.
NOTE: Master Trader and its representatives may have existing positions in actual or other trade recommendations before or after suggested herein. Additionally, we may manage them differently for internal purposes based on different risk parameters than noted herein.
All trade ideas and content are for informational and educational purposes only. It is not, nor is it intended to be, trading or investment advice or a recommendation that any security, option or investment strategy is suitable for any person. Trading securities can involve high risk and the loss of any funds. Investment or trading information provided may not be appropriate for all investors, and is provided without respect to individual financial sophistication, financial situation, investing time horizon or risk tolerance. Supporting documentation for any claims (including claims made on behalf of options programs), comparison, statistics, or other technical data, if applicable, will be supplied upon request. Master Trader Consulting, Inc. is not a licensed financial advisor, registered investment advisor, or a registered broker-dealer. Options, futures and futures options are not suitable for all investors. Prior to trading securities products, please read the Characteristics and Risks of Standardize Options and the Risk Disclosure for Futures and Options found here: CLICK HERE.
