
 Let’s talk about trends and the recent price movements.
While one bullish day will result in some follow through to that day, most times and a bearish doing the same. The overall daily market trend has become less certain. Let me go over why that is to quantify that so we are all on the page of understanding.
The fast and sharp drop that occurred in a near nine trading days sliced through multiple areas of Major Support (MR) on the S&P 500 daily time frame. Based on my trend analysis rules, that changed the trend from up to down.
If you are thinking, “that does not equal the definition of a downtrend — that being lower highs and lower lows,” you’re right. Having studied tens of thousands of charts to create Master Trader Strategies (MTS), I decided to add some common sense to the black and white definition of a trend change.
As it relates to a trend change from up to down, the rule is that if a price movement within an uptrend breaks down through two reference points of MS, then that signals a downtrend in the time frame used.
Once the trend is down, we can then consider bearish trade setups within that trend. However, the Master Trader will do the same trend analysis in the next higher timeframe to determine if there is a trend change in that timeframe. In this case, it would be the weekly time.
If there hasn’t been, the initial assumption is that the correction in the daily timeframe will eventually come into alignment with the weekly timeframe. At this time, the weekly timeframe is still up.
The misalignment between the weekly and daily timeframe can make a more difficult trading environment. Every trader now has a choice to make: that is waiting for the realignment of the weekly and daily time frames, or trade nimbly on smaller time frames.
Trading nimbly from a daily chart timeframe is more difficult than doing so from an intraday timeframe. The last two weeks have been more so with the high volatility and false moves in either direction. What to do?
When the timeframe that you primarily trade in — whether you are a swing or intraday trader — become erratic and less predictable, move to a higher timeframe.
MasterTrader Tip: Condensing the data in the lower timeframe when there are multiple timeframe misalignments will typically bring clarity.
If that higher timeframe is still unclear, either moved to the next higher timeframe or wait. Wait for the price patterns to contract in volatility and become recognizable again.
The other choice is to go down in timeframe — in this case to an intraday timeframe — by expanding the data and you may see recognizable patterns to trade.
Of course, you have to choose which intraday timeframe. If not experienced in trading intraday, choose a relatively high intraday timeframe like the 60-minute chart, so prices and signals are relatively slower. Or do nothing and wait.
DOW JONES INDUSTRIAL AVG.
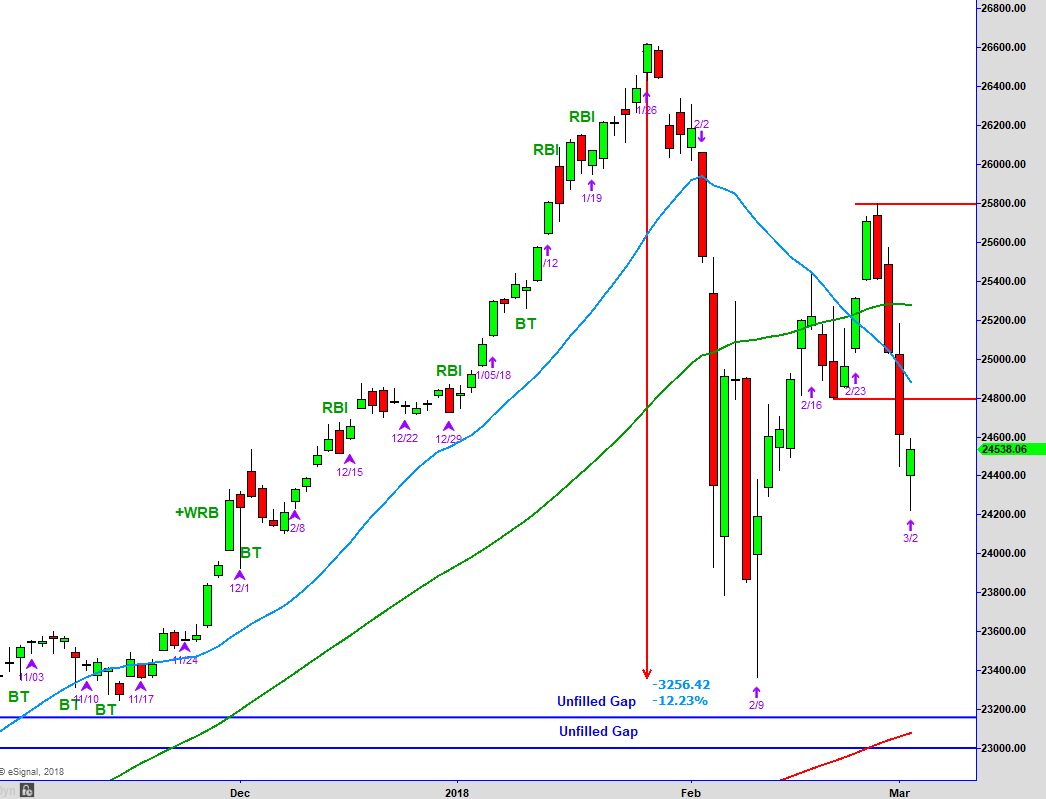
Above is the chart of the Dow Jones Industrial Average that we review each week. In last week’s Monday letter I said,
“Ideally if prices are going to clear the prior high from the 16th they will move sideways for a day or two first for an entry, rather than shooting through that high and continue higher.
Moving sideways for a day or two would build an intra-day consolidation, which is a higher probability point to enter from as prices take out a prior resistance point.
With money managers falling over themselves to get out of the market and then get back in — in the blink of an eye — the ideal seems less likely. We shall see.”
As we know, no one could wait, and buyers stepped up immediately pushing prices above the prior high — and then immediately failed the next day.
By the end of the week, prices had fallen back below the prior swing low and down 2.99% for the week.
Which direction will the Dow go in this week? I think that you have good odds of determining that by flipping a coin. As already mentioned above, when there isn’t clarity in a lower timeframe, you move to the higher.
Unfortunately, going to the weekly timeframe at this time doesn’t bring that clarity. While the trend is still up on the weekly timeframe, the erratic price action does not suggest the short-term direction. What now? Use last week’s high and low as your reference points of first support and resistance.
Prices are much closer to last week’s low than last week’s high, so it wouldn’t take much of a move to break through the low.
Because prices move down four days in a row, breaking below last week’s low although bearish could also result in another whipsaw.
Based on the overview provided, my bias personally is to use the intraday time frames until we get the clarity that we need in the higher time frames.
This bias is related to the DOW as per the overview provided. As to various stocks, I am finding a fair about that have been relatively unaffected by the markets.
BROADER MARKETS
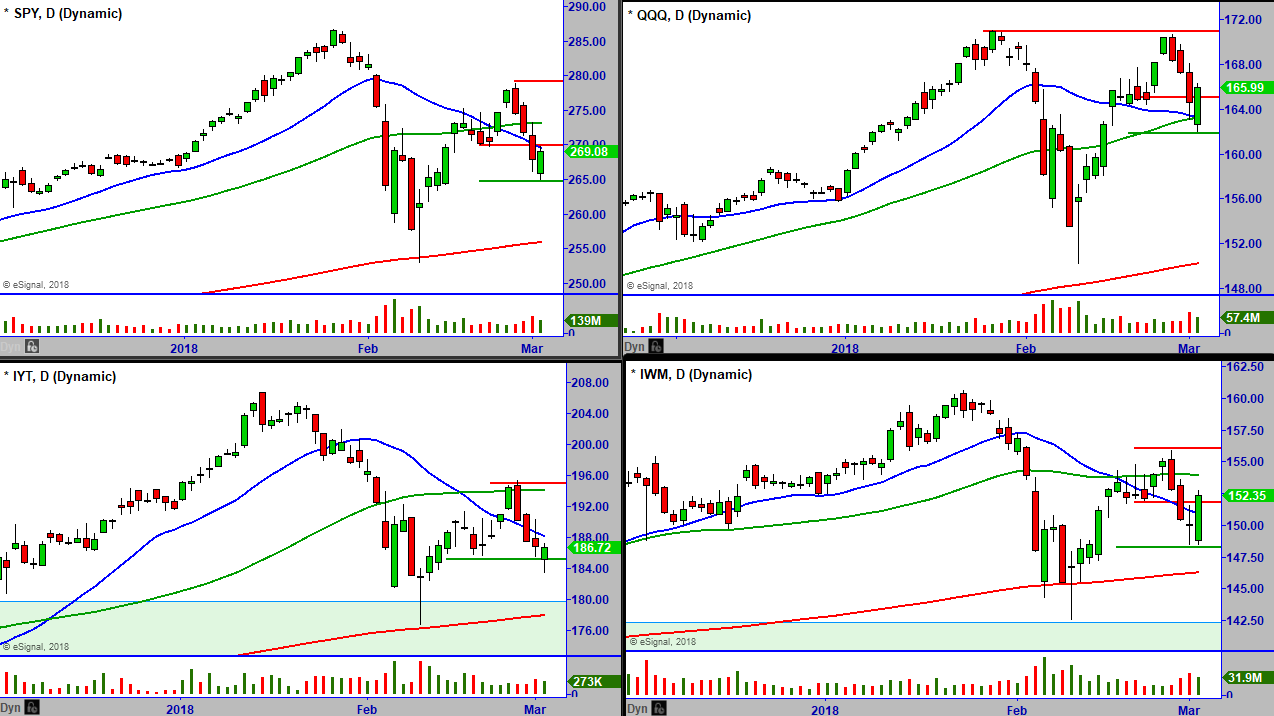
[s3mv fileName=’March+2018+Letter/Broadermarkets_3_6_18.mp4′ fileType=’video’ source=’s3′ width=’800′ height=’450′ splashImage=” preLoad=’Y’ autoPlay=’N’ belowVideoHTML=” cuePoint=” redirectURL=” pauseAtCuePoint=’N’ isSecure=’Y’ bucketname=”]
TREND MATRIX AND INTERNALS
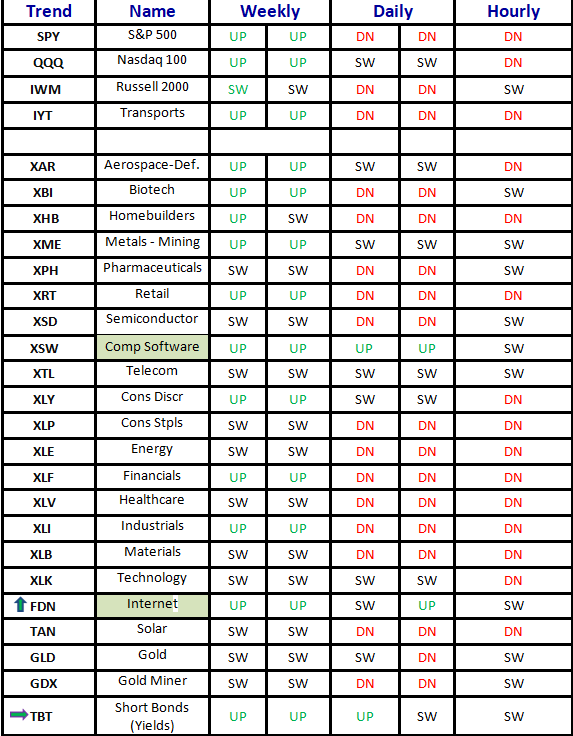
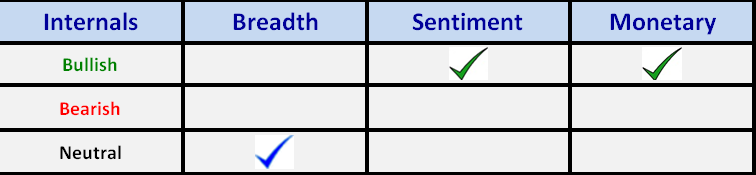
[s3mv fileName=’March+2018+Letter/Trends_3_6_18.mp4′ fileType=’video’ source=’s3′ width=’800′ height=’450′ splashImage=” preLoad=’Y’ autoPlay=’N’ belowVideoHTML=” cuePoint=” redirectURL=” pauseAtCuePoint=’N’ isSecure=’Y’ bucketname=”]
NEW TRADE IDEAS
Below is a daily chart of GrubHub Inc. (GRUB).
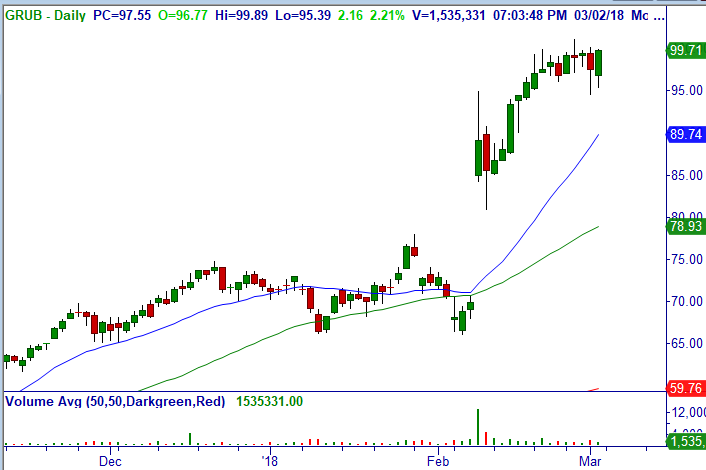
Trade: Over $99.89, consider shorting Mar (3/9) $93.5/83 bull put credit spread (12 DTE) for closing mid-point of $.80/share.
Technical Setup: Bullish engulfing and Bottoming Tail and possible breakout to all-time highs daily, bullish weekly and monthly.
Option Strategy: Bull Put Credit Spread (BPS).
Stop Loss: $93.88.
Below is a daily chart of Workday, Inc. (WDAY).
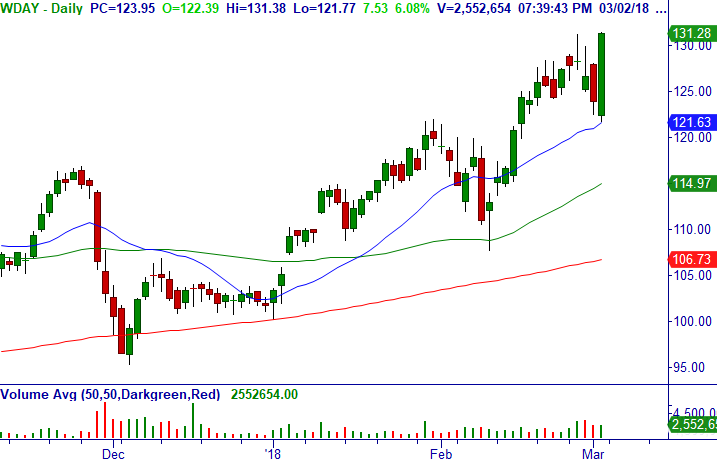
Trade: Consider shorting Mar (3/16) $122/112 bull put credit spread (12 DTE) for a limit of $.85/share (closed at $.60/share but extended hourly and want improvement).
Technical Setup: Bullish engulfing breakout to all-time highs daily, bullish weekly and monthly.
Option Strategy: Bull Put Credit Spread (BPS).
Stop Loss: $121.76.
Below is a daily chart of Twitter, Inc. (TWTR).
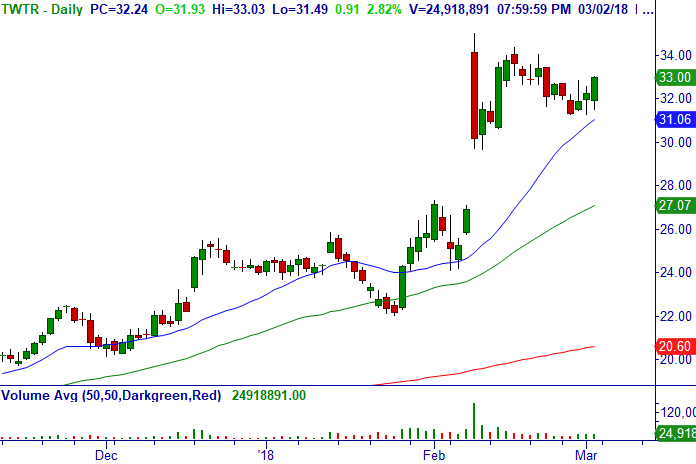
Trade: Over $33.03, consider buying stock.
Technical Setup: Bullish engulfing on r20-MA following bullish consolidation after Pro Gap daily, bullish weekly.
Stop Loss: $31.19. Earnings 4/24.
Twitter, Inc. (TWTR).
Trade: Over $33.03, consider shorting Mar (3/16) $31/28 bull put credit spread (12 DTE) around closing mid-point of $.35/share.
Technical Setup: Breakout after retracement/consolidation from bottoming pattern daily, bullish weekly on r20-MA.
Option Strategy: Bull Put Credit Spread (BPS).
Stop Loss: $31.19
Below is a daily chart of Energous Corporation (WATT).
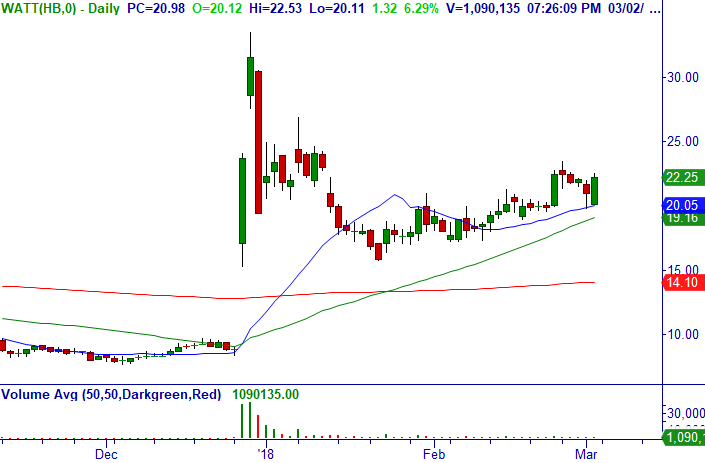
Trade: Over $22.53, consider buying stock.
Technical Setup: Bullish Engulfing after Master Trader Buy Setup and Bottoming Tail on r20-MA daily.
Stop Loss: $20.10. Earnings 5/17.
Below is a daily chart of MuleSoft, Inc. (MULE).
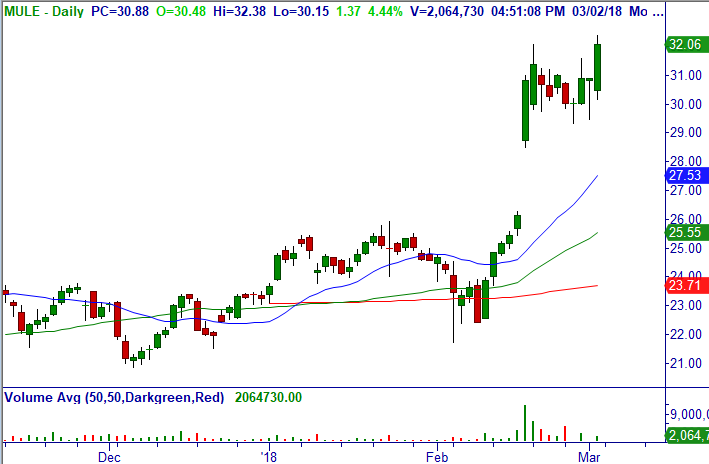
Trade: Over $32.38, consider buying stock.
Technical Setup: Bullish Wide Range Bar Breakout following bullish consolidation after Pro Gap daily, bullish weekly.
Stop Loss: $28.50. Earnings 5/17.
Miscellaneous Member Documents and Reminders:
Adjustments and Comments on Open and Closed trades in Master Trader’s Market Edge Advisory Letter. Note: Our Trade Updates are timely posted in a separate Report in the Member’s Area.
Please CLICK HERE to see that document for a current reflection on all Open and Closed Trades since the spreadsheet updates immediately and will always be more current than this e-mail update.
Please see Master Trader Guidelines for Trading the Open and Gaps in Member’s Area for rules on trade entry, gaps, etc.
Below is a link to individual videos explaining in greater detail the definitions of the main option trading strategies used by Master Trader in its advisory letters to generate wealth and income.
Description of Master Trader Directional and Income Option Trades can be seen HERE
Our Trade Updates are timely posted in a separate Report in the Member’s Area. Please CLICK HERE to see that document for a current reflection on all Open and Closed Trades and adjustments since the spreadsheet updates immediately.
Since you have enjoyed this Service, please review the following for more detailed education — and profits!
You can sign up for the Master Trader Weekly Options Trader here. It is designed for the active trader wanting to generate weekly income from high probability short-term option selling, including news, gaps, earnings, and volatility trades around compelling chart patterns.
To learn how to create Wealth and Generate Income using our simple Option Strategies, please see Master Trader Option Strategies Series for Investors and Active Traders. Our unique approach is guaranteed to increase your ability to trade options with confidence with superior reward-risk that doesn’t take a lot of time.
Thank you for being a loyal subscriber and feel to email us with any questions or comments on anything.
MasterTrader and You Building Your Financial Future Together
Happy trading! If you have any questions or comments, please e-mail Greg Capra at Greg@mastertrader.com or Dan Gibby at Dan@mastertrader.com
All the best,
Greg Capra
Managing Director of Master Trader
Trading the Pristine Method — Origin and End
Dan Gibby
Chief Options Strategist
Follow Greg on Twitter, YouTube, and StockTwits to get real-time updates and education:
Twitter: @GregCapra
Stocktwits: Greg_Capra
youtube.com/c/mastertrader (please subscribe to receive all the timely stock market updates)
