
 The selling that began at the close of January continued last week and it looks like we have a short-term low in place. Our market internal gauges are supportive of this in the short term; however, it would not be a surprise to see lower lows.
I’m not wishing to see the further damage done in the broader markets. But as I look at the weekly time frames and historical chart patterns, that is what “should happen.” I will review this in the video of the broader markets.
One of the concepts that I explain in the Master Trader Technical Strategies (MTS) course is the angle of a retracement. The angle of retracement shows the speed at which prices are moving and the degree of which participants want to exit their position.
The greater the downward angle is, the more fear there is associated with that drop. Historically, such angles are followed by a retest of the prior low — or what is called a “W-Bottom.” And while there were a few times during this recent bull market advance where there wasn’t a retest (V-Bottom), it doesn’t happen often.
An example of one occurred in October 2014.
During this bull advance that started in 2009, there have been retracements with similar downward angles as the recent one. The major difference between those from the past and the current one is that this one was preceded by a climactic or accelerated moved to the upside.
This is one of the reasons why I would like to see prices make lower lows and then build a larger area of price support. This is an intermediate-term point of view based on higher time frames.
As I said, we do have supportive reasons for a move up in the short term. However, based on different views of the short-term and long-term not being aligned, put spreads and naked puts may be the best vehicle to profit from in the moment.
As we have more information that supports an intermediate-term bullish bias, we will want to use directional options strategies as well as buying individual stocks and ETFs.
DOW JONES INDUSTRIAL AVG.

Above is the chart of the Dow Jones Industrial Average that we review each week. As you can see, the angle of retracement is quite steep — almost vertical to the downside. From the high on January 26th to the intraday low last Friday, prices have fallen 3256 points, or 12.23%.
In last week’s letter, I mentioned the 10% correction and move under 24,000, but I did not imagine it would happen in one week.
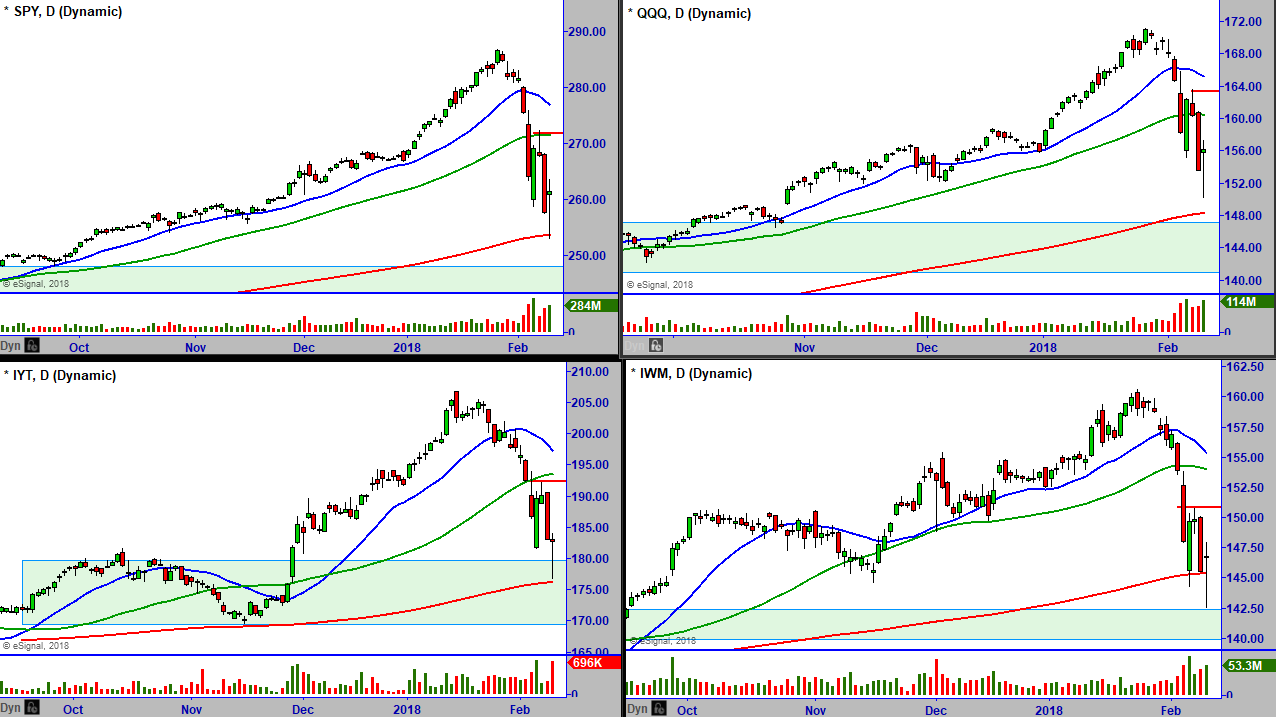
I’ve mentioned in the past that a major reference point for institutions is the 200-day moving average. The Dow did not reach its 200-day moving average but the S&P 500 and the Transportation Index did. it is a good practice to know the location of the 200-MA of various markets and set alerts there.
Prices in all of the broader market indices rallied from there to create the Bottoming Tail’s (BT) that we will review.
Those daily BT bars that formed did not reverse the trend on the intraday 60-minute time frames or even the 15 minute. Based on the daily time frames, the market internals that we will review, and these intraday time frames, my bias is to look for bullish strategies on a dip.
What worked wonderfully last week was selling put options on SPY on an intra-day reversal — and that may be the vehicle of choice again.
Another possible intraday price scenario could be a consolidation in the upper half of Friday’s BT range.
For some of the reasons already mentioned, the first half hour of trading may be whippy and unpredictable but we will evaluate that at the time.
Do not feel pressured into entering positions because you are afraid of missing out. While you should never do that, it’s unlikely that this is going to be a runaway market to the upside.
Historically, before prices make a meaningful trending advance, volatility contracts. Daily ranges will narrow and that may be during a basing period at the lows. It can also come after a sharp advance higher — and then a consolidation that “creates” new support — another concept covered in MTS.
BROADER MARKETS
[s3mv fileName=’FEB+Letter+2018/BroaderMarkets_2_9_18.mp4′ fileType=’video’ source=’s3′ width=’800′ height=’480′ splashImage=” preLoad=’Y’ autoPlay=’N’ belowVideoHTML=” cuePoint=” redirectURL=” pauseAtCuePoint=’N’ fixedSizeVideo=’N’ isSecure=’Y’ bucketname=”]
TREND MATRIX AND INTERNALS
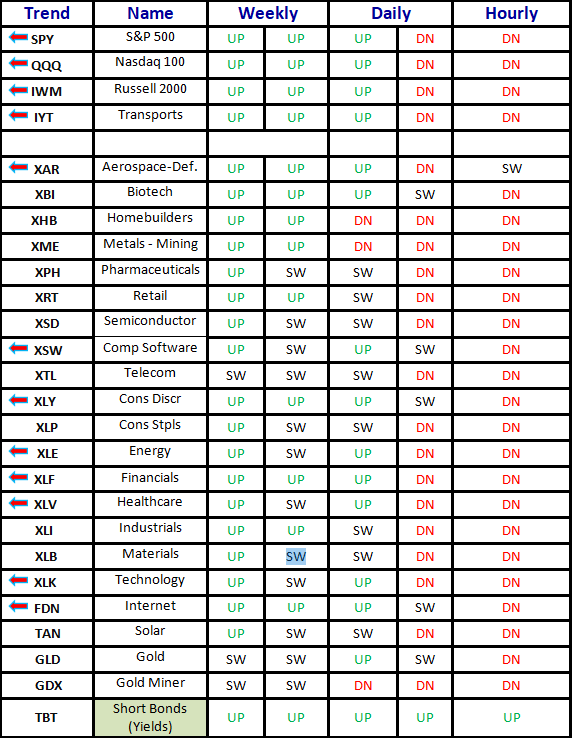
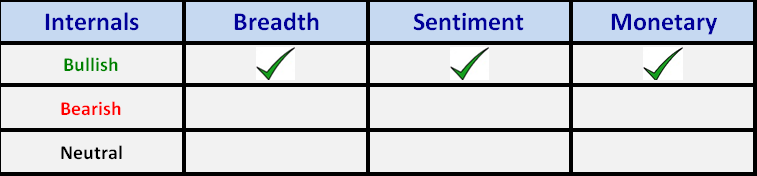
[s3mv fileName=’FEB+Letter+2018/Trends_2_9_18.mp4′ fileType=’video’ source=’s3′ width=’800′ height=’480′ splashImage=” preLoad=’Y’ autoPlay=’N’ belowVideoHTML=” cuePoint=” redirectURL=” pauseAtCuePoint=’N’ fixedSizeVideo=’N’ isSecure=’Y’ bucketname=”]
Weekly and Year to Date Scorecard
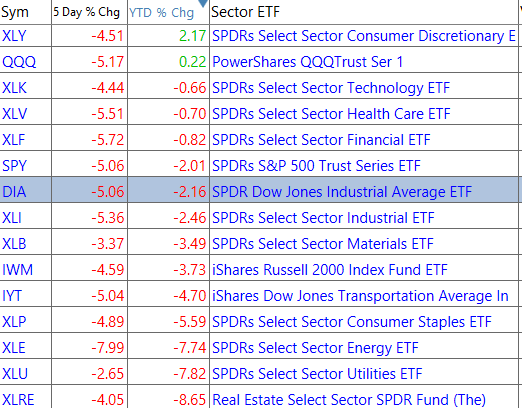
Trades
With the elevated volatility levels in the market (IVR of the VIX is still at 99%), this favors shorting overpriced options (with the charts as always) and/or trades with positive time decay. This should be an incredible week for selling puts/spreads – particularly if we get one more washout to the downside in the already oversold broader markets.
Below is a daily chart of Mattel, Inc. (MAT).

Strategy: Provided MAT opens above $16.95, then consider shorting the above put spread over a 10-Min. high.
Stop Loss: $15.94.
Below is a weekly chart of Chevron Corporation (CVX).

Trade: Provided it opens over $112.41, then over 10-min. high consider shorting Feb (2/16) $108/100 bull put credit spread (5 DTE) at mid-point but for a limit of $.60/share (closed at $.72/share).
Technical Setup: Selloff to 200-MA and Support area on +Vol. with Bottoming Tails all time frames.
Option Strategy: Bull Put Credit Spread (BPS). Income Trade with Implied Volatility Rank of 100% (meaning it has the highest volatility over the past year, making it an ideal option selling candidate).
Stop Loss: $107.98.
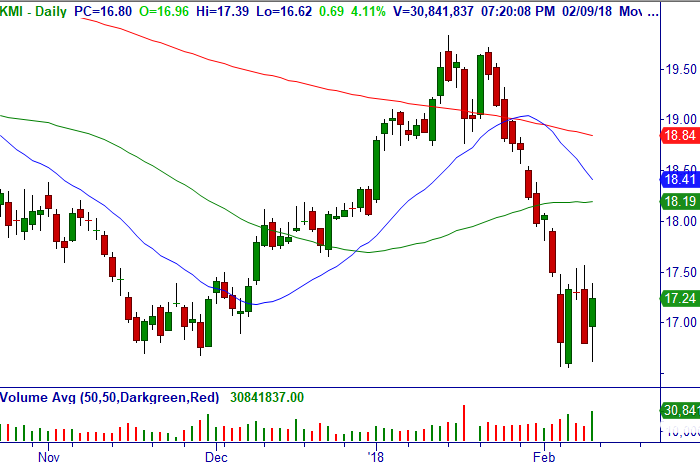
KMI: We will be watching for bullish trades with its bullish retest on Major Support daily.
Below is a daily chart of Carpenter Technology Corporation (CRS).

Trade #1: Over $47.77, consider buying stock.
Trade #2: Over $47.77, consider shorting Mar (3/16) $45/40 bull put credit spread (32 DTE) for a limit of $.80/share (spready but closed at $.92/share).
Technical Setup: Chart above (plus Bottoming Tail on Minor Support after Breakout monthly).
Option Strategy: Bull Put Credit Spread (BPS), Income Trade with 90% Implied Volatility Rank (IVR).
Stop Loss: $45.37.
Below is a monthly/daily chart of Model N, Inc. (MODN).
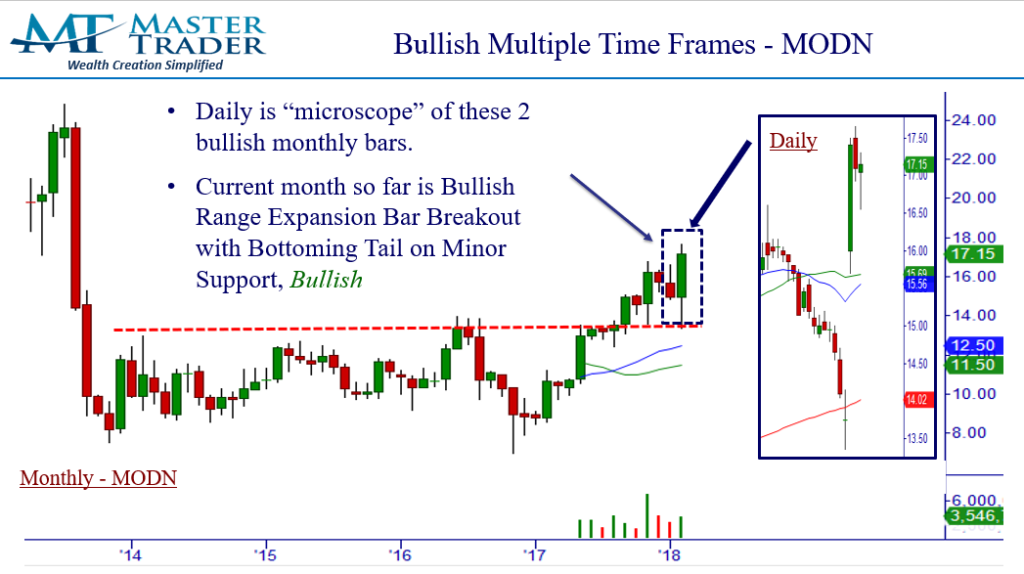
Trade #1: Over $17.65, consider buying stock. Stop Loss: $16.54. Earnings 5/7.
Trade #2: Over $17.65, consider shorting Mar (3/16) $16 puts (32 DTE) for a limit of $.50/share (spready, closed at $.20 x .65/share), but this would give a cost basis of $15.40/share if filled and assigned. No stop.
Technical Setup: Pro Gap Bullish Wide Range Bar (+WRB) Breakout and 2-bar bullish consolidation within top 50% of +WRB. See charts above.
Option Strategy: Short Naked Puts (SP).
Below is a daily chart of Electronic Arts Inc. (EA).

Trade: Provided it opens over $119.50, over 10-Min. high consider shorting Mar (3/16) $110/80 bull put credit spread (32 DTE) for a limit of $1.70/share (closed at $1.71/share).
Technical Setup: Above.
Option Strategy: Bull Put Credit Spread (BPS), Income Trade with 100% Implied Volatility Rank (IVR). NOTE: Higher risk with huge spreads. Try to get tighter spread width with tighter long put once spreads tighten after market open, just hard to pick now, will advise in text.
Stop Loss: None now.
Master Trader Testimonials from Last Week’s Market Turmoil
We are pleased to have received many positive comments about how we navigated the sell-off last week with our Techno-Fundamental top-down approach and using inter-market analysis. We profited nicely on the short-term bounce with spiked volatility, and have a similar approach to this week.
We were particularly pleased with the success from this one subscriber, who allowed us to share with you:
“Subject: most successful 8 days ever!
Hi Greg & Dan,
I tend to be a humble person, but it’s important to share the good news when we can. I just wanted to share with you my personal best success the last 8 days. It’s most certainly all because of your mentorship.
Having started with Pristine, & continuing with Master Trader, I was able to put many of the concepts into action with the recent market crash. The guidance from the newsletters was also very instrumental.
I trade with 2 accounts, a retail & retirement account.
I made 2 mostly identical trades in the 2 accounts from 2/1 – 2/9
Retail account = +248%
Retirement account = +296%
I sincerely appreciate everything you do, and your patience & commitment to sharing your knowledge.
Have a great weekend!
Cheers,
“Christian K.”
Thank you so much Christian for those kind words. So grateful for your success and journey towards trading mastery!
Despite the market turmoil the past three weeks, we are pleased to report that the Master Trader Weekly Options Trader has closed 21 straight wins for a total of $7.69 points ($7,690 based on a 10-lot of each recommendation). As always, we will manage opens using Master Trader Strategies and Adjusting/Rolling Strategies.
Miscellaneous Member Documents and Reminders:
Adjustments and Comments on Open and Closed trades in Master Trader’s Market Edge Advisory Letter. Note: Our Trade Updates are timely posted in a separate Report in the Member’s Area. Please CLICK HERE to see that document for a current reflection on all Open and Closed Trades since the spreadsheet updates immediately and will always be more current than this e-mail update.
Please see Master Trader Guidelines for Trading the Open and Gaps in Member’s Area for rules on trade entry, gaps, etc.
Below is a link to individual videos explaining in greater detail the definitions of the main option trading strategies used by Master Trader in its advisory letters to generate wealth and income.
Description of Master Trader Directional and Income Option Trades can be seen HERE
Please Sign Up for New WhatsApp Text Alert Service for Timely Trade Updates!
As a subscriber to the Master Trader’s Market Edge Advisory Letter, we would like to text you alerts for timely new trade opportunities and/or updates to open positions.
WhatsApp will allow us to post more detailed alerts (without being constrained by character limits), and also allow our many subscribers all over the world to receive these alerts (and you when you are traveling).
Please download the app on your phone if you want to take advantage of this service. You can read about the product at https://www.whatsapp.com/
Once downloaded, email Dan@mastertrader.com with your Name and Cell # to get the invitation to the “MasterTrader Advisory” Group. This app allows us to text all around the world. We reserve the right to ban anyone from the group for posting.
PLEASE DO NOT TEXT REPLIES HERE AS IT BROADCASTS TO ALL SUBSCRIBERS (instead, kindly e-mail dan@mastertrader with any questions). We reserve the right to ban anyone from the group for posting.
Our Trade Updates are timely posted in a separate Report in the Member’s Area. Please CLICK HERE to see that document for a current reflection on all Open and Closed Trades and adjustments since the spreadsheet updates immediately.
Since you have enjoyed this Service, please review the following for more detailed education — and profits!
You can sign up for the Master Trader Weekly Options Trader here. It is designed for the active trader wanting to generate weekly income from high probability short-term option selling, including news, gaps, earnings, and volatility trades around compelling chart patterns.
To learn how to create Wealth and Generate Income using our simple Option Strategies, please see Master Trader Option Strategies Series for Investors and Active Traders. Our unique approach is guaranteed to increase your ability to trade options with confidence with superior reward-risk that doesn’t take a lot of time.
Thank you for being a loyal subscriber and feel to email us with any questions or comments on anything.
Happy trading! If you have any questions or comments, please e-mail Greg Capra at Greg@mastertrader.com or Dan Gibby at Dan@mastertrader.com
All the best,
Greg Capra
Managing Director of Master Trader
Trading the Pristine Method — Origin and End
Dan Gibby
Chief Options Strategist
Follow Greg on Twitter, YouTube, and StockTwits to get real-time updates and education:
Twitter: @GregCapra
Stocktwits: Greg_Capra
youtube.com/c/mastertrader (please subscribe to receive all the timely stock market updates)
