
 The “Measured Move” scenario I wrote about in last week’s letter on Monday played out almost exactly to the numbers. What now? Well, the internals still have not given us a sell signal but that doesn’t mean that prices won’t pull back.
I cannot say that I’m surprised that prices didn’t pull back from Monday’s “Gap and Crap” reversal. I’m not surprised because the majority of large red candles in 2017 did not follow through significantly. Monday’s didn’t follow through at all.
On Friday, the markets moved higher and the S&P 500 actually closed at the high of the session. The weekly time frame candle of the S&P 500, the NASDAQ 100, the Dow and, to a lesser extent, the Russell 2000 ended with what is called a hangman.
The name is suggestive of a top because it comes after multiple candles higher and forms with a small candle body at the top and a tail at the bottom. So the candle body is supposed to depict a head and the tail the lower extremities.
The names of various candlestick patterns are subjective, to say the least, as to their predictability. However, we know with certainty that a small candle body signals slowing momentum.
Momentum can slow down and speed up. But with prices getting further away from any significant price support and the rising 20-period moving average, a normal retracement would be just that — normal.
Using the S&P 500 ETF symbol SPY as an example, if those prices were to open Monday morning under Friday’s low, we will consider bearish strategies under the 30-minute low.
General Electric

The Dow is now lagging a bit and we can be sure the cause of that in part is General Electric (GE).
Out of curiosity, how many of you think that it is a long-term buy here?
I don’t think a company like General Electric can go out of business. However, that doesn’t mean it cannot be broken up into parts and become something else.
There used to be a stock in the Dow called Westinghouse, it’s gone.
There is a relatively large area of price support between $14 and $16 that was formed and retested between 2010 and 2011. If last week’s selloff should waterfall down into that area (climactic buy set up) I will be buying some after stabilization. I would expect at least a decent bounce. We’ll see.
DOW JONES INDUSTRIAL AVG.
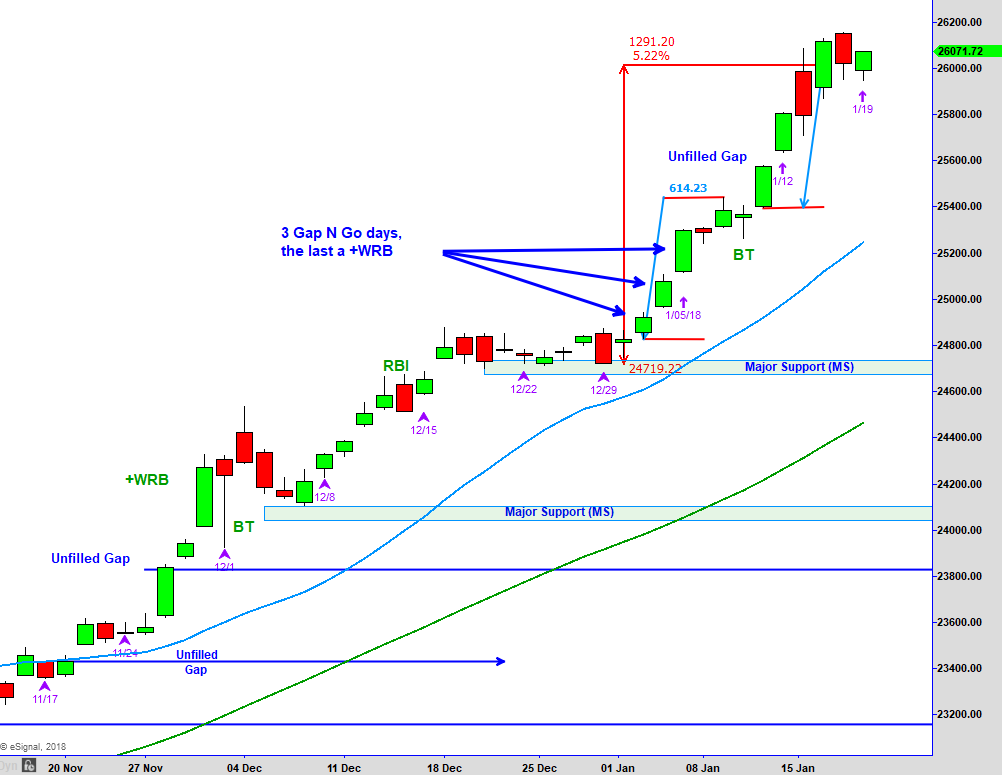
Above is the chart of the Dow Jones Industrial Average that we review each week. As I mentioned, the measured move followed through and prices stalled in the area suggested by the pattern.
While we don’t use the idea of prices being overbought (because as you can see prices can be overbought and continue to move higher), we do recognize that historically prices have moved far from prior support and a reference point like the 20-period moving average.
In the chart above, you can see that prices are further from the 20-period moving average then they were in December when they moved sideways. This extension from those reference points suggests that a normal correction should be close at hand, which could be sideways or lower.
With the weekly time frame being extended as well (will review that in the video), a 1000 point pullback would not be a big deal. A pullback of that much would not violate major support on the daily time frame, so the trend would still be up.
BROADER MARKETS
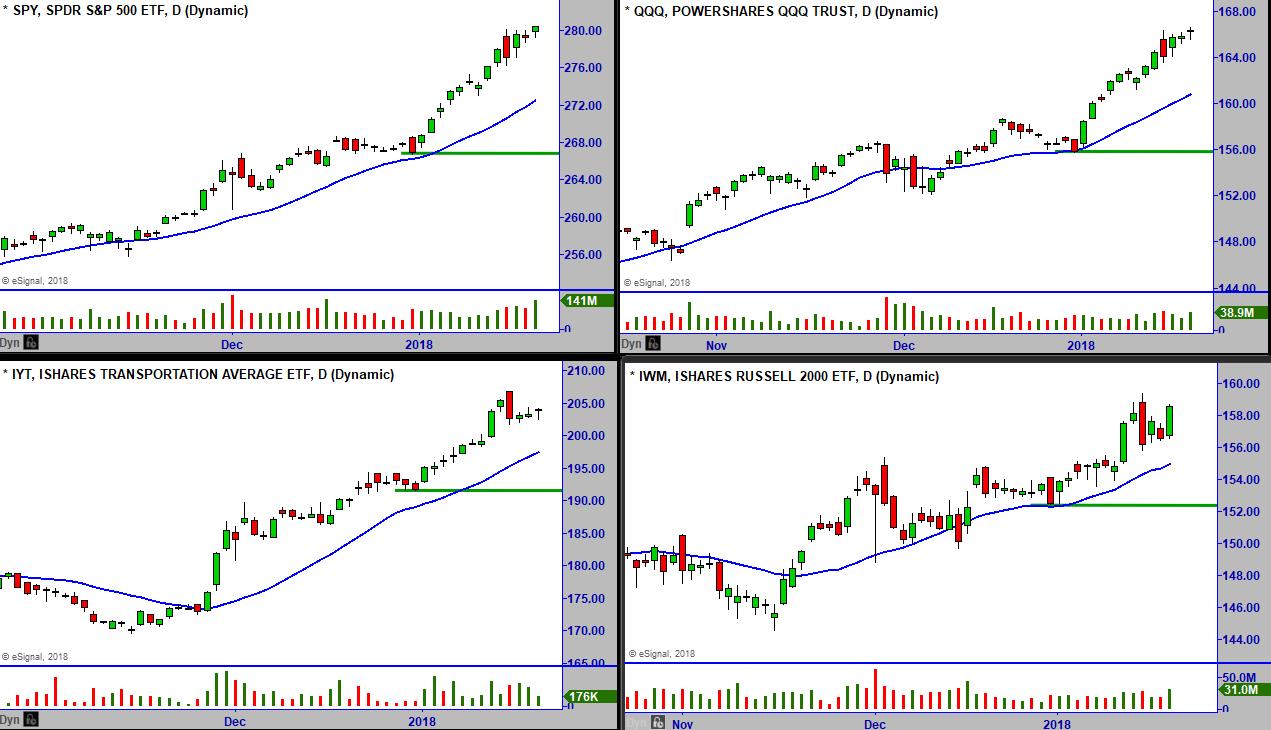
[s3mv fileName=’Jan+2018+letter/BroaderMarkets_1_22_18.mp4′ fileType=’video’ source=’s3′ width=’800′ height=’480′ splashImage=” preLoad=’Y’ autoPlay=’N’ belowVideoHTML=” cuePoint=” redirectURL=” pauseAtCuePoint=’N’ fixedSizeVideo=’N’ isSecure=’Y’ bucketname=”]
TREND MATRIX AND INTERNALS
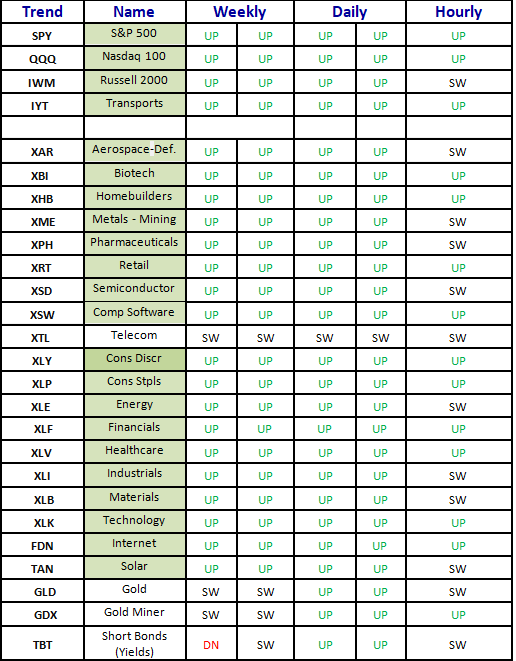
[s3mv fileName=’Jan+2018+letter/Trends_1_19_18.mp4′ fileType=’video’ source=’s3′ width=’640′ height=’480′ splashImage=” preLoad=’Y’ autoPlay=’N’ belowVideoHTML=” cuePoint=” redirectURL=” pauseAtCuePoint=’N’ fixedSizeVideo=’N’ isSecure=’Y’ bucketname=”]

New Trade Ideas
Below is a monthly chart of Dynegy Inc. (DYN).
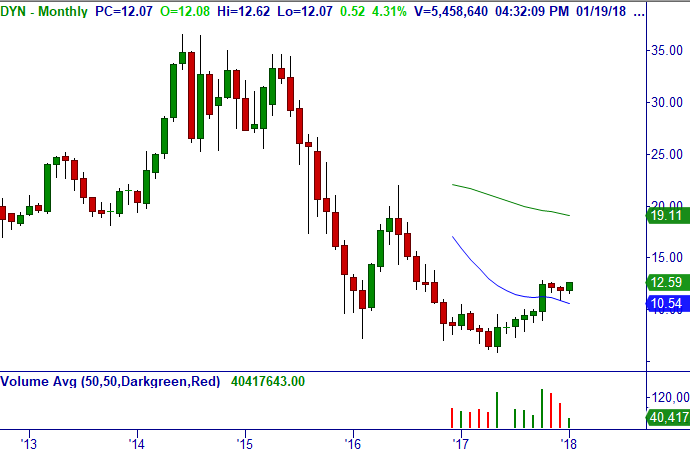
Trade: Consider buying stock between $12.10 and current price of $12.59 for a core trade.
Technical Setup: +WRB Breakout from multi-week consolidation above converging r20/50-MA daily, Breakout and Bottoming Tail above r20-MA weekly, bullish consolidation into +WRB Breakout monthly with Price Void above.
NOTE: Shorting OTM Puts would be great strategy if you can get filled at a favorable price; however, spreads ludicrous spreads now because of low open interest.
Stop Loss: $8.87. Note: Earnings 2/21.
Below is a daily chart of DSW Inc. (DSW).
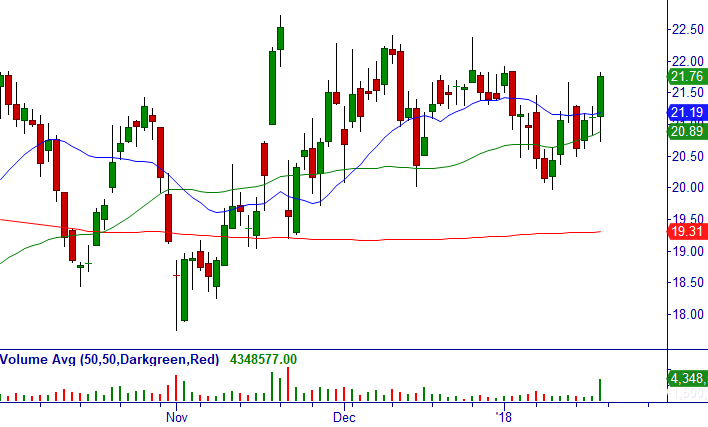
Trade: Consider shorting Feb (2/16) $40 naked puts (25 DTE) for closing bid of $.40/share (more if gaps down).
Technical Setup: Time Decay trade with Bullish Range Expansion Bar and Bottoming Tail in sideways trading range and flat Moving Averages daily, with bullish bias and possible breakout weekly.
Option Strategy: Short Puts (SP).
Stop Loss: $19.97.
Below is a weekly chart of Micron Technology, Inc. (MU).
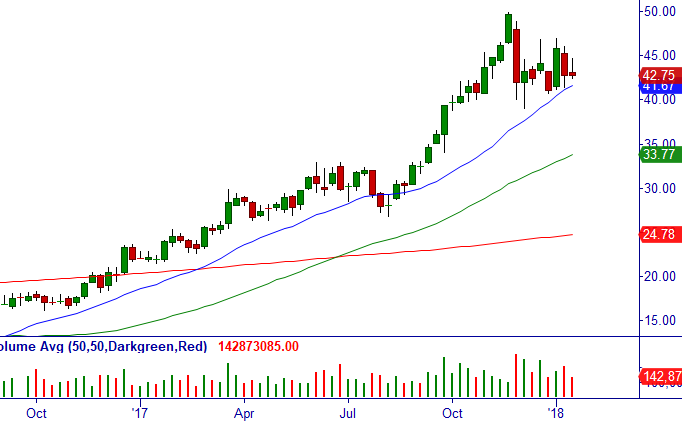
Trade: Consider selling the following $2.00-wide Iron Condor: sell Feb (2/16) $48/50 bear call credit spread and sell Feb (2/16) $39/37 bull put credit spread (25 DTE) for $.48/share or better (closed at $.51/share).
Here are the legs of the Condor in order entry (obviously pick own contract size):

Technical Setup: Range bound daily and weekly, time decay strategy. Although lagging, sector is bullish
Option Strategy: Iron Condor (IC).
Max Gain is the Credit received, 34% ROI ($.51 credit received divided by 1.49/share Max Loss if closes beyond either of the long strikes) if expires worthless.
Stop Loss: None now.
Below is a weekly chart of Philip Morris International Inc. (PM).
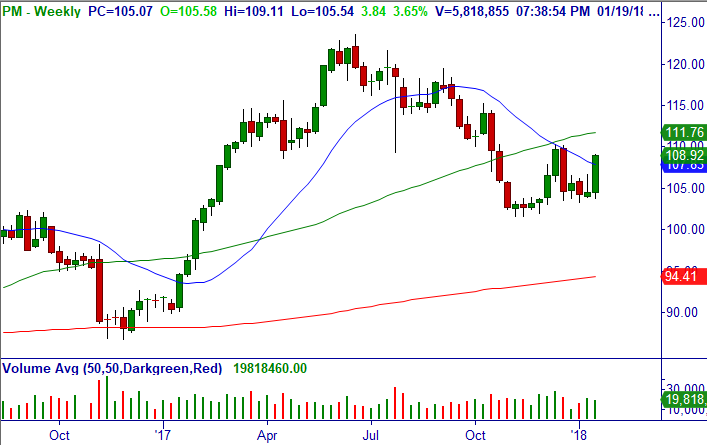
Trade #1: Consider shorting Feb (2/2) $106 naked puts (12 DTE) for a limit of $.64/share (closed at $.67/share but extended intra-day).
Trade #2: Consider shorting Feb (2/16) $105/100 bull put credit spread (25 DTE) for a limit of $.66/share (closed at $.68/share but extended intra-day). Note: this is an earnings trade.
Below is a monthly chart of Philip Morris International Inc. (PM).

Trade #3: Anywhere between $107.70 and closing price of $108.92, consider buying the following bull call diagonal for a core trade: buy Jun (6/15) $95 call options (144 DTE) and sell Feb (2/2) $111 call options (12 DTE) at mid-point (closed at $14.23/share so paying less than $.25/share time value).
Technical Setup: +WRB Breakout daily, huge Bullish Double Bottom (W Formation) weekly, bullish Master Trader Buy Setup on r20-MA and Minor Support monthly.
Option Strategy: Bull Put Credit Spread (BPS); Bull Call Diagonal (BCD).
Stop Loss: $104.74.. Note: Earnings 2/8.
Below is a daily chart of SPDR Dow Jones Industrial Average ETF (DIA).
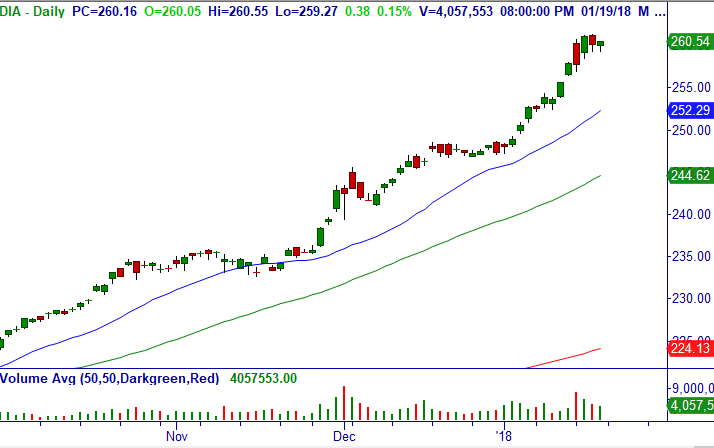
Trade: Under $259.27, consider buying Feb (2/16) $267 puts (25 DTE) at mid-point for a swing trade (.77 Delta now but will be higher upon trigger).
Technical Setup: Extended all time frames, under Friday’s low should trigger short-term retracement (see video on broader markets above).
Option Strategy: Long Puts (LP).
Stop Loss: $261.33.
Miscellaneous Member Documents and Reminders:
Adjustments and Comments on Open and Closed trades in Master Trader’s Market Edge Advisory Letter. Note: Our Trade Updates are timely posted in a separate Report in the Member’s Area. Please CLICK HERE to see that document for a current reflection on all Open and Closed Trades since the spreadsheet updates immediately and will always be more current than this e-mail update.
Please see Master Trader Guidelines for Trading the Open and Gaps in Member’s Area for rules on trade entry, gaps, etc.
Below is a link to individual videos explaining in greater detail the definitions of the main option trading strategies used by Master Trader in its advisory letters to generate wealth and income.
Description of Master Trader Directional and Income Option Trades can be seen HERE
Please Sign Up for New WhatsApp Text Alert Service for Timely Trade Updates!
As a subscriber to the Master Trader’s Market Edge Advisory Letter, we would like to text you alerts for timely new trade opportunities and/or updates to open positions.
WhatsApp will allow us to post more detailed alerts (without being constrained by character limits), and also allow our many subscribers all over the world to receive these alerts (and you when you are traveling).
Please download the app on your phone if you want to take advantage of this service. You can read about the product at https://www.whatsapp.com/
Once downloaded, email Dan@mastertrader.com with your Name and Cell # to get the invitation to the “MasterTrader Advisory” Group. This app allows us to text all around the world. We reserve the right to ban anyone from the group for posting.
PLEASE DO NOT TEXT REPLIES HERE AS IT BROADCASTS TO ALL SUBSCRIBERS (instead, kindly e-mail dan@mastertrader with any questions). We reserve the right to ban anyone from the group for posting.
Our Trade Updates are timely posted in a separate Report in the Member’s Area. Please CLICK HERE to see that document for a current reflection on all Open and Closed Trades and adjustments since the spreadsheet updates immediately.
Since you have enjoyed this Service, please review the following for more detailed education — and profits!
You can sign up for the Master Trader Weekly Options Trader here. It is designed for the active trader wanting to generate weekly income from high probability short-term option selling, including news, gaps, earnings, and volatility trades around compelling chart patterns.
To learn how to create Wealth and Generate Income using our simple Option Strategies, please see Master Trader Option Strategies Series for Investors and Active Traders. Our unique approach is guaranteed to increase your ability to trade options with confidence with superior reward-risk that doesn’t take a lot of time.
Thank you for being a loyal subscriber and feel to email us with any questions or comments on anything.
Happy trading! If you have any questions or comments, please e-mail Greg Capra at Greg@mastertrader.com or Dan Gibby at Dan@mastertrader.com
All the best,
Greg Capra
Managing Director of Master Trader
Pristine’s Founder and Creator of the Pristine Method
Dan Gibby
Chief Options Strategist
Follow Greg on Twitter, YouTube, and StockTwits to get real-time updates and education:
Twitter: @GregCapra
Stocktwits: Greg_Capra
youtube.com/c/mastertrader (please subscribe to receive all the timely stock market updates)
