
 As we start the New Year, the primary focus of this letter will be to review what occurred and where things are likely to go. So it will be a bit longer.
At the end of 2016, the markets were choppy and ground lower. The move lower was just before the results of the Presidential election.
The day before the election results, in the letter that was titled “Get Ready for an End-of-Year Rally”, I wrote “Tuesday night and Wednesday morning many are either going to be elated with the result or depressed. History of America is likely to change. Let’s hope the right choices are made.”
Regardless of your political bias, I think that most would all agree that the theme of 2017 will go down as “The Trump Rally.” If you don’t think so, just ask the President (smile)!
2017 Percentage Gains for Broader Market and Main Sectors

The table above shows the S&P SPDR sectors and the broader markets ETFs showing their percentage changes for 2017. Those are pretty good gains across the board except for the energy sector.
With the markets having digested and interpreted so much of what has occurred as being positive, it’s hard to imagine what more “bullish bullets” are left in the gun. In other words, what more could drive this market higher now?
That’s a logical thought, especially after the markets have moved up as much as they have last year. However, one of the lessons that I learned years ago was that markets would trend either up or down longer than what seems logical.
There are always things that we don’t know that will make the broader markets, individual sectors, and/or stocks continue their trend. Those unknowns will always be there, and that can be hard to accept from a logical point of view.
Master Traders accept the unknown as such — and then simply, and easily, follow the trends in multiple time frames. We will continue to do that in 2018 and adjust our strategies as changes occur throughout the New Year.
DOW JONES INDUSTRIAL AVG.

Above is the chart of the Dow Jones Industrial Average that we review each week. For those new to the letter, the dates shown mark the close of the prior week and the end of the chart at the time the commentary was written.
Other than the gap higher two weeks ago, the Dow moved sideways and ended last week with a relatively large red engulfing candle. That candle was retesting the prior high that was a Topping Tail (TT). While that has created a small area of overhead resistance and does suggest short-term further selling, the trend remains up.
The majority the selling happened in the last 30 minutes of the trading day Friday, which suggests that traders did not want to hold over the holiday weekend and took profits. Not a big deal.
Assuming that prices do move lower, the first reference point of support is in the area of the rising 20-period moving average (blue line). At the left of the moving average, notice that there are some overlapping candles (green box), which is the actual price support.
Master Trader Tip: Moving averages are subjective reference points of support or resistance, but those widely followed can become a self-fulfilling prophecy of support or resistance. Always look to the left of the moving average to confirm if there is actual price support or resistance there.
It’s not a large area, but it may be enough considering that minor or small areas of support have held prior retracements in 2017.
The other scenario could be a gap up and move above 24,825 that could set up a move higher toward 25,000. We’ll see how it plays out on Tuesday.
BROADER MARKETS

[s3mv fileName=’December+Letter+2017/Broader+markets+12-30-17.mp4′ fileType=’video’ source=’s3′ width=’800′ height=’480′ splashImage=” preLoad=’Y’ autoPlay=’N’ belowVideoHTML=” cuePoint=” redirectURL=” pauseAtCuePoint=’N’ fixedSizeVideo=’N’ isSecure=’Y’ bucketname=”]
TREND MATRIX AND INTERNALS

Best to play this video below in full-screen
[s3mv fileName=’December+Letter+2017/Trends+12-30-17.mp4′ fileType=’video’ source=’s3′ width=’800′ height=’480′ splashImage=” preLoad=’Y’ autoPlay=’N’ belowVideoHTML=” cuePoint=” redirectURL=” pauseAtCuePoint=’N’ fixedSizeVideo=’N’ isSecure=’Y’ bucketname=”]

[s3mv fileName=’December+Letter+2017/Internals+12-30-17.mp4′ fileType=’video’ source=’s3′ width=’800′ height=’480′ splashImage=” preLoad=’Y’ autoPlay=’N’ belowVideoHTML=” cuePoint=” redirectURL=” pauseAtCuePoint=’N’ fixedSizeVideo=’N’ isSecure=’Y’ bucketname=”]
New Trade Ideas and Trade Adjustment
Below is a daily chart of First Solar, Inc. (FSLR).

Trade: Over $68.70, consider shorting Jan (1/5) $67/64 Bull Put Credit Spread (4 DTE) for mid-point but a limit of $.45/share (closed at $.65/share).
Technical Setup: Bullish consolidation into r20-MA daily, bullish weekly and monthly.
Option Strategy: Bull Put Credit Spread (BPS).
Stop Loss: $66.60 for now.
12/26: M – Shorted Jan (1/19) $25/21 Bull Put Credit Spread for $.49/share. 1/1: We initially had a stop loss of $25.08 which is close. Although this Breakout Failure is unfortunate, it is still within the consolidation at r20-MA and nearing major support (prior pivot low).
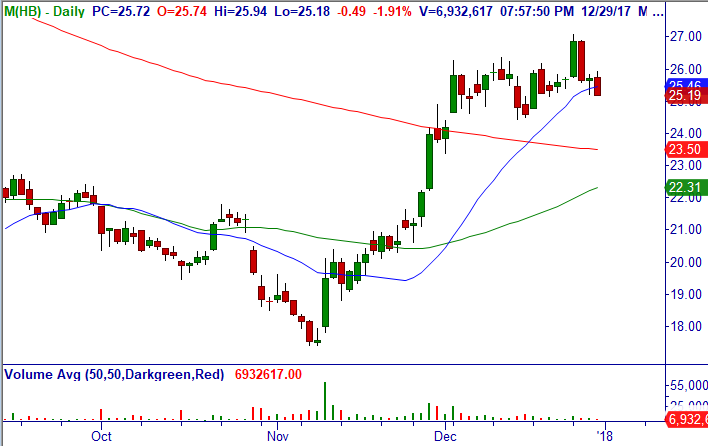
Additionally, the weekly and monthly charts are bullish with an explosive move from deeply oversold condition. Since the pattern is not destroyed, it makes sense to roll as choppy consolidation is expected from the multiple time frames.
As such, we have decided to not use a stop at this time. If necessary (i.e., Macy’s trading below $25 into expiration), we will roll to the February expiration to generate more time decay income.
Miscellaneous Member Documents and Reminders:
Adjustments and Comments on Open and Closed trades in Master Trader’s Market Edge Advisory Letter. Note: Our Trade Updates are timely posted in a separate Report in the Member’s Area.
Please CLICK HERE to see that document for a current reflection on all Open and Closed Trades since the spreadsheet updates immediately and will always be more current than this e-mail update.
Please see Master Trader Guidelines for Trading the Open and Gaps in Member’s Area for rules on trade entry, gaps, etc.
Below is a link to individual videos explaining in greater detail the definitions of the main option trading strategies used by Master Trader in its advisory letters to generate wealth and income.
Description of Master Trader Directional and Income Option Trades can be seen HERE
Please Sign Up for New WhatsApp Text Alert Service for Timely Trade Updates!
As a subscriber to the Master Trader’s Market Edge Advisory Letter, we would like to text you alerts for timely new trade opportunities and/or updates to open positions.
Please download the app on your phone if you want to take advantage of this service. You can read about the product at https://www.whatsapp.com/
Once downloaded, email Dan@mastertrader.com with your Name and Cell # to get the invitation to the “MasterTrader Advisory” Group. This app allows us to text all around the world. We reserve the right to ban anyone from the group for posting.
PLEASE DO NOT TEXT US IN WHATSAPP (instead, kindly e-mail dan@mastertrader with any questions).
Our Trade Updates are timely posted in a separate Report in the Member’s Area. Please CLICK HERE to see that document for a current reflection on all Open and Closed Trades and adjustments since the spreadsheet updates immediately.
Thank you for being a loyal subscriber and feel to email us with any questions or comments on anything.
Happy trading! If you have any questions or comments, please e-mail Greg Capra at Greg@mastertrader.com or Dan Gibby at Dan@mastertrader.com
All the best,
Greg Capra
Managing Director of Master Trader
Pristine’s Founder and Creator of the Pristine Method
Dan Gibby
Chief Options Strategist
Follow Greg on Twitter, YouTube, and StockTwits to get real-time updates and education:
Twitter: @GregCapra
Stocktwits: Greg_Capra
youtube.com/c/mastertrader (please subscribe to receive all the timely stock market updates)
