In last week’s letter, I said, “The markets are poised to move higher, and they better.
The price patterns that have formed are signaling that they are going to move higher — if they overcome last week’s high.
Once that happens, they cannot move back below last week’s low short-term.”
Well, depending on where you look, all of that happened.
On Monday, the S&P 500 and the NASDAQ 100 moved higher at the open and rallied to close with bullish Wide Range Bars (+WRB).
The NASDAQ, that under-performed the prior week and looked the most questionable, rallied the strongest, moving right back up to the prior high where there was a bearish Wide Range Bar (-WRB).
The prior week’s down move, followed by last week’s initial big up move, looked like the markets were poised to continue to move higher as expected.
Sectors that did not participate on Monday joined the party on Tuesday.
The S&P 500 and the NASDAQ 100 gapped higher at the open, followed by some profit-taking. The under-performers from Monday led the way higher.
Just when it seemed that all markets and sectors were going to begin to fire in the same direction, the momentum began to falter.
Markets don’t have to go up every day, of course, but since so many have been consolidating, I thought it strange that prices began to turn so quickly.
On Thursday, what led the way up (S&P 500 and NASDAQ 100) began a free-fall that continued Friday morning.
While the S&P 500 pulled back in a relatively normal way within its uptrend, what has been leading this market higher almost single-handedly (NASDAQ 100) broke through its prior swing low before beginning to stabilize and move up.
So, we got the expected move up early on, and what I said cannot move back below the prior week’s low, did that.
When I said “cannot,” it wasn’t to mean it’s not possible; it was to mean that if that occurred, it would be a bearish event, and we now have one.
S&P Sector ETFs
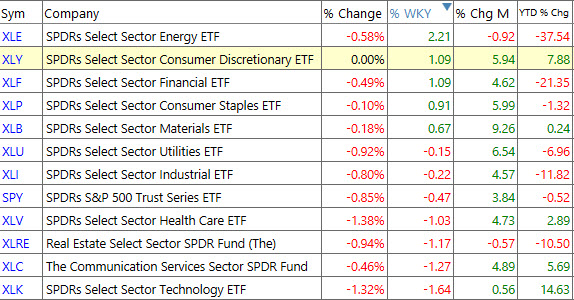
In the sector ETF table above, the rotation out of what has been leading is evident.
Technology and Communication Services led off the March low, trended the last four months strongly, and now have begun to roll over.
The weekly trends are still up, but extended.
At the top of the list is Energy, and last week I said it could be the surprise this week. The comment was,
“Energy that has continuously moved from the bottom of the list near the top of the list, and returned back to the bottom of the list, could be a surprise this week.
The retracement off its recent low back to where it fell from may have set a short-term bottom. If it can clear Friday’s high, it should move higher.”
Almost every sector looks somewhat questionable after Thursday and Friday, but the laggards that were expected to “bring up the rear” have held up the best.
Consumer Staples was only up slightly last week, but it has one of the strongest looking daily and weekly charts that have room to move higher.
Consumer Staples is a defensive sector and where some of that tech money is going into.
With so much coronavirus news and talk of unemployment, closing restaurants, and other businesses, it’s illogical that Consumer Discretionary is doing as well as it is.
It’s actually at a new all-time high. It’s a great example of why what appears to be logical doesn’t always work when it comes to the stock market.
Master Trader Tip: Don’t fight the trend, and don’t overthink. The charts are smarter than we are.
Where Are the Markets Headed This Week?
A coin toss, this market is nuts. There’s a ton of earnings next week, and Thursday is a lot of big names. There is no doubt that distribution is going on.
Technology and Internet have broken their uptrends, but maybe the under performers can hold it all together while technology consolidates.
Between the United States and China playing tit for tat in their apparent divorce from love, this retarded virus and the political bickering over it, it’s hard to imagine this market is going to surprise on the upside again. But that has been what has happened lately.
Based on the end of last week’s price action, I’m guessing that the beginning of the week will start to the downside, and then buyers will step up again.
Here’s a logical thought that may make sense, will see soon enough.
Next week is going to be the report of the tech giants.
On Wednesday, Facebook (FB), Qualcomm (QCOM), PayPal (PYPL), Lam Research (LRCX), Garmin (GRMN), and others report.
On Thursday, it’s going to be coming from Apple (AAPL), Amazon (AMZN), Alphabet/Google (GOOGL), Xilinx (XLNX), Electronic Arts (EA) and others.
It might be a logical thought that they get sold down into the earnings report to be bought afterward.
The end of the month and the beginning of a new month typically will be relatively bullish so that that scenario could play out based on seasonality.
After next week, we enter August, which is also the height of what is referred to as the “summer doldrums.”
This is when the majority of people go on vacation. With so many out of work, what are they going on vacation from? Maybe getting out of the house.
Our market internal gauges are still the same as they were last week. Sentiment screaming that long risk is high, and that breadth is weak.
But until breadth moves higher, we are not going to get a sell signal from those market internal gauges.
These are interesting and different times, that’s for sure.
Dow Jones Industrials
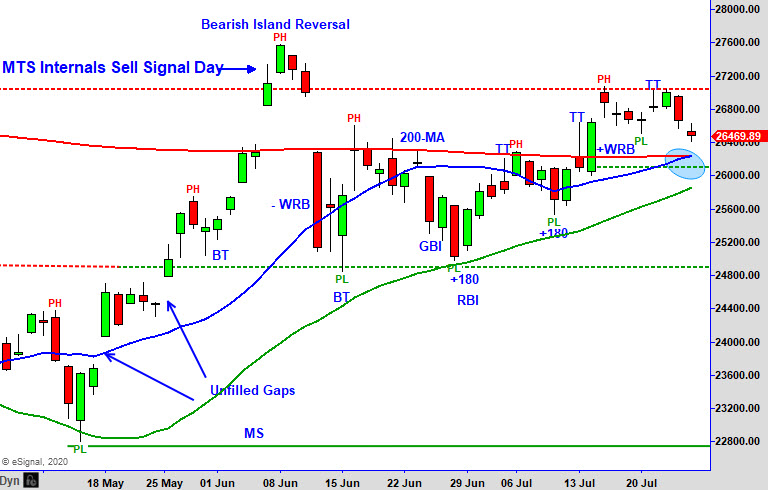
Above is the chart of the Dow Jones Industrial Average that we review each week for information and review of MTS.
The Dow ended the week pretty close to where it ended the prior week. It lost slightly less than 1%.
The attempt to push through last week’s high on Tuesday ended with a Topping Tail (TT), but Wednesday was able to regain footing it gave back Tuesday.
What that bullish close and ignoring the TT, it looked like prices could push through the prior week’s high and move higher.
It didn’t happen. The bullish scenario fell apart on Thursday, and prices moved lower. Like other markets, the selling continued Friday morning.
However, it seemed that early sellers one away for the weekend and forget about the disappointing lack of follow-through to the upside.
Last week was technically a non-event where prices traded inside of the prior week’s range, or what is called an inside week.
With the Dow above all of the respective moving averages that we use on the daily time frame (20, 50, and 200 Simple MAs), bulls need to keep prices above them.
Below you can see the 20-day, and the 200-day moving averages converging just above 26,000. Bulls need to hold the Dow above that area on a closing basis.
Stocks in the Dow that report earnings next week are Apple (AAPL) and Procter & Gamble (PG) on Thursday.
Caterpillar (CAT), Chevron (CVX), Merck (MRK), and Exxon (XOM) on Friday.
VIDEO REVIEW OF MARKETS AND INTERNALS
[s3mm type=”video” source=”cloudfront” files=”july-2020-letter/BroaderMarkets_7_27_20.mp4″ /]
NEW STOCK TRADING IDEAS
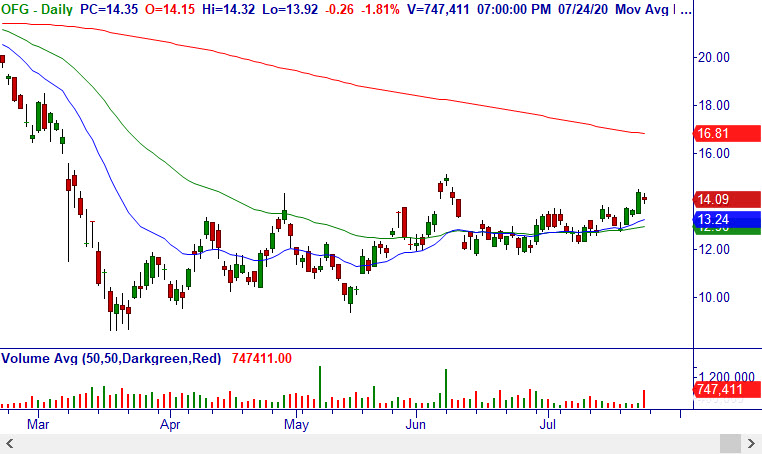
7/27: OFG – Over $14.50, consider buying stock. Bullish +123 Continuation from Breakout daily. Stop $13.48.
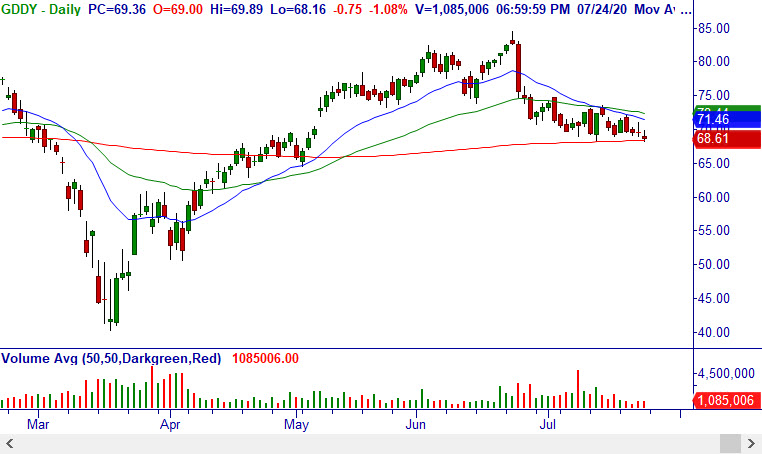
7/27: GDDY – Under $68.16, consider shorting stock. Breakdown daily. Earnings 8/5. Stop $71.12.
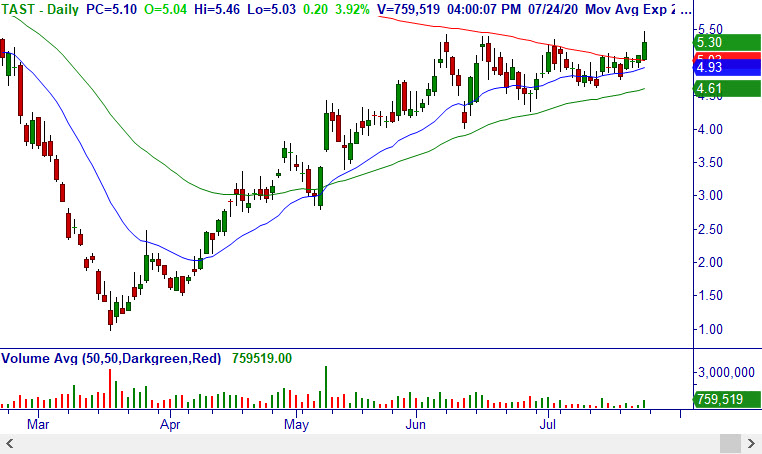
7/27: TAST – Over $5.46, consider buying stock. Breakout at r20-MA daily. Earnings 8/6. Stop $4.92.
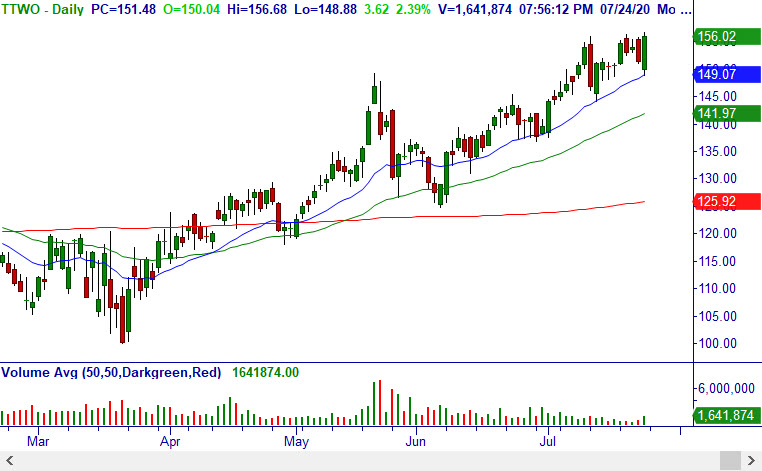
7/27: TTWO – Over $156.68, consider buying stock. Bullish engulfing Breakout at r20-MA daily. Earnings 8/3. Stop $148.87.
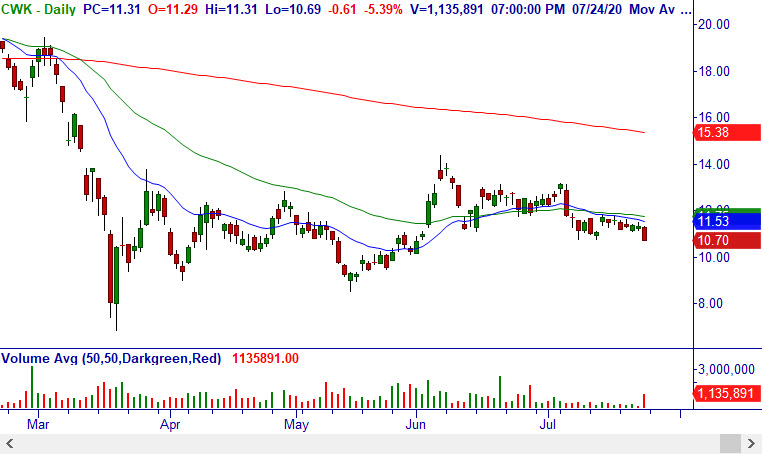
7/27: CWK – Under $10.69, consider shorting stock. Breakdown at d20/50-MA daily. Earnings 8/6. Stop $11.64.
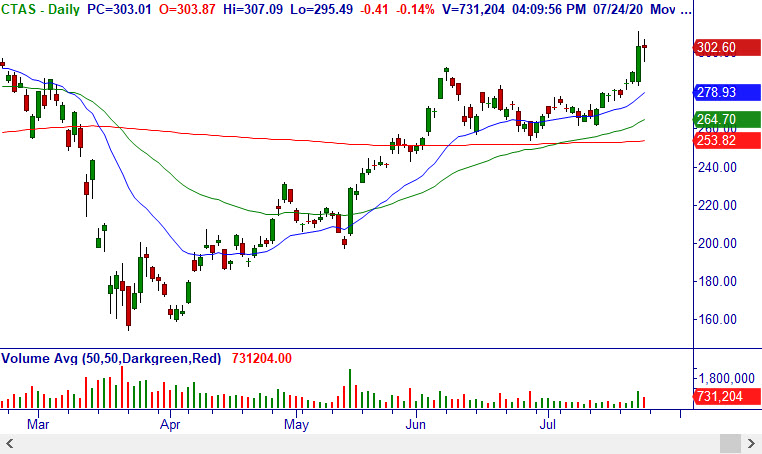
7/27: CTAS – Over $307.09, consider buying stock. Bullish inside bar after +WRB Breakout daily. Stop $282.68.
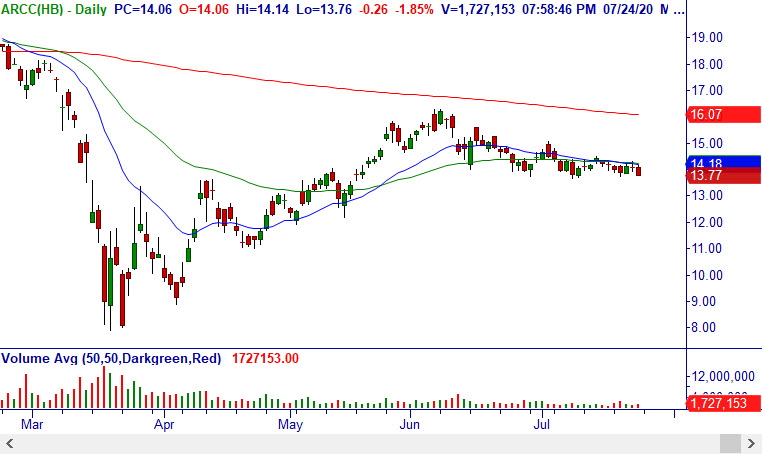
7/27: ARCC – Under $13.75, consider shorting stock. Breakdown daily. Earnings 8/4. Stop $14.49.
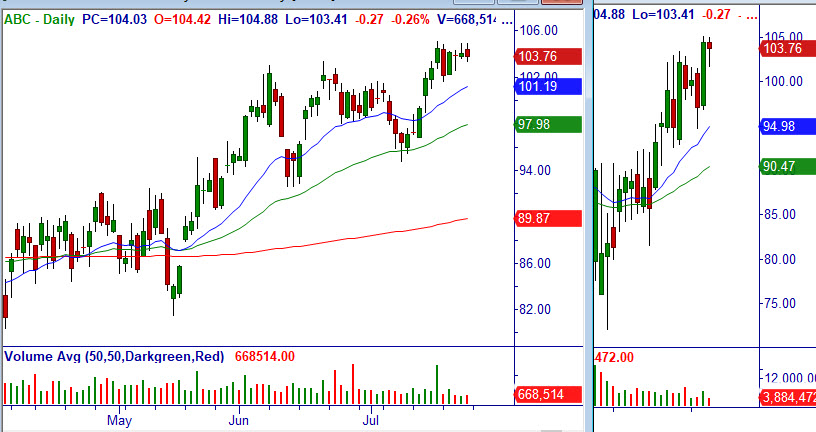
7/27: ABC – Over $105.08, consider buying stock. Breakout daily, Bullish +123 Continuation weekly. Earnings 8/5. Stop $102.20.
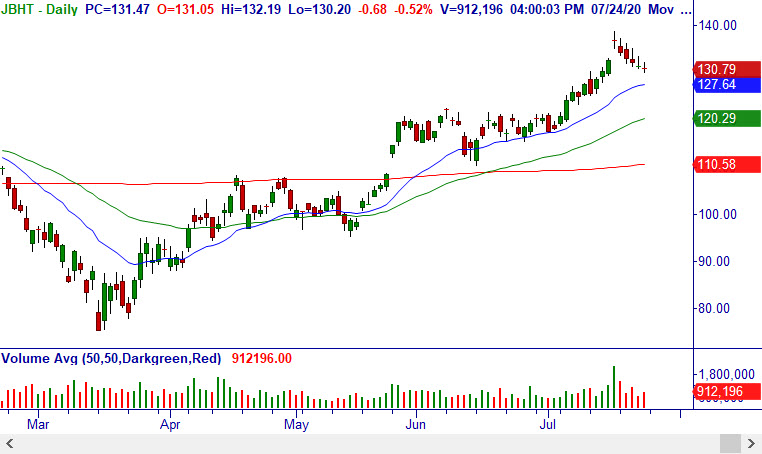
JBHT – Buy Setup, will watch for a reversal at r20-MA.
NEW OPTIONS TRADING IDEAS and Video Update Below
NOTE: For the directional option trades, it is also acceptable to trade the stock instead with the same stop, but we prefer options when they are liquid because of the leverage and limited risk.
There is an options coaching session this Tuesday, 729/20, at 4:15 PM ET.
These are great to reinforce option strategies using Master Trader Strategies (MTS). In addition to answering questions, this session will focus on presenting you with interactive quizzes to reinforce concepts. Click HERE to register
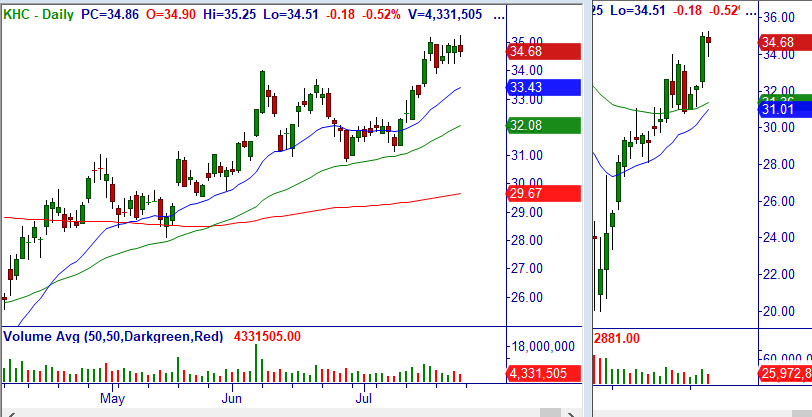
7/27: KHC – Over $35.25, consider buying Jul (7/31) $32.5/36 bull call debit spread for mid-point (closed at $1.92/share). NOTE: Earnings 7/30, but we plan to hold as core long. Breakout daily, Bullish +123 Continuation weekly, Breakout monthly with price void. Stop $32.17.
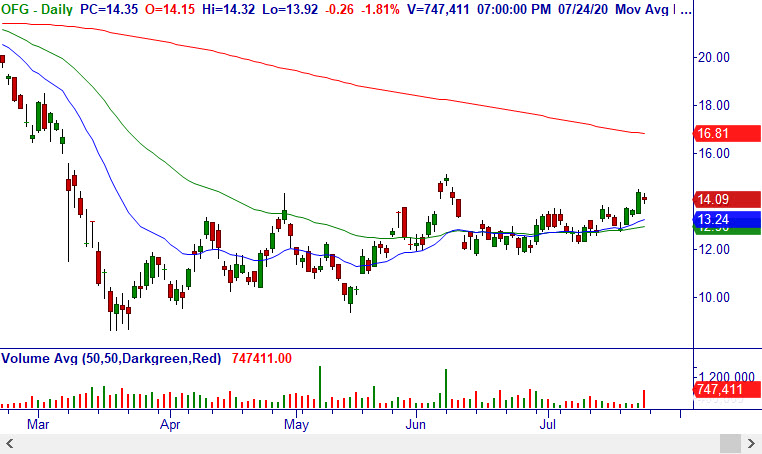
7/27: OFG – Over $14.50, consider shorting Aug (8/21) $12.5 puts for $.35/share. Bullish +123 Continuation from Breakout daily. Stop $13.48
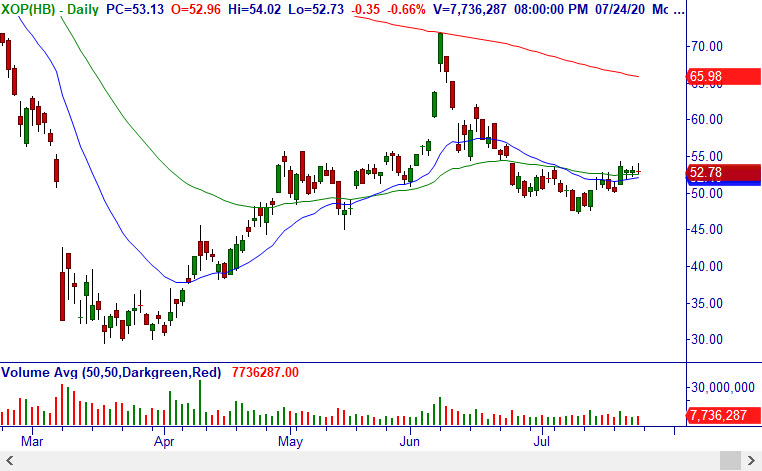
7/27: XOP – Over $54.02, consider buying Jul (7/31) $50/55 bull call debit spread for mid-point (closed at $2.63/share). Breakout at 20/50-MA daily. Stop $51.14.
7/27: COF – Over $66.04, consider shorting Aug (8/21) $60/50 bull put credit spread for a limit of $1.15/share (closed at $1.27/share). Breakout after gap reversal daily, bullish weekly. Stop $60.28.

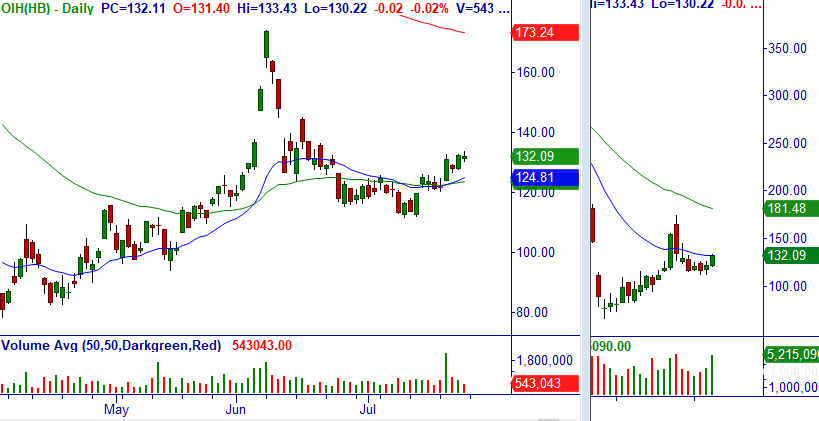
7/27: OIH – Over $132.51 (intra-day resistance), consider shorting Jul (7/31) $122.5 puts for a limit of $1.00/share (closed at $1.15/share). Breakout daily/weekly. Stop $123.78.
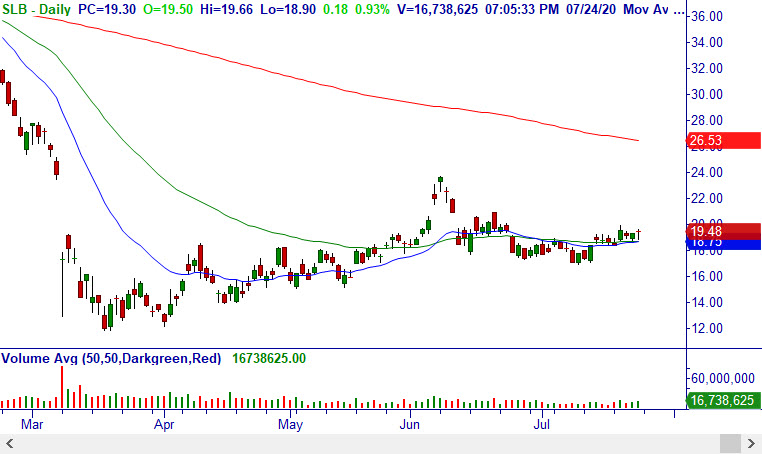
7/27: SLB – Over $19.66, consider buying stock and shorting Jul (7/31) $20.5 calls (covered call). Breakout at 20/50-MA daily. Stop $18.68.
VIDEO ON OPEN TRADES AND ADJUSTMENTS (NOTE: Also in Member’s Area in Open/Closed Trade Sheet)
[s3mm type=”video” source=”cloudfront” files=”Dan – Letter Videos/advisory 200725.mp4″ /]
Options Strategies Definitions Videos Here
Please read the information on Money Management below Learn how Master Trader Technical Strategies – MTS and MTS with Options Strategies can make consistent money.
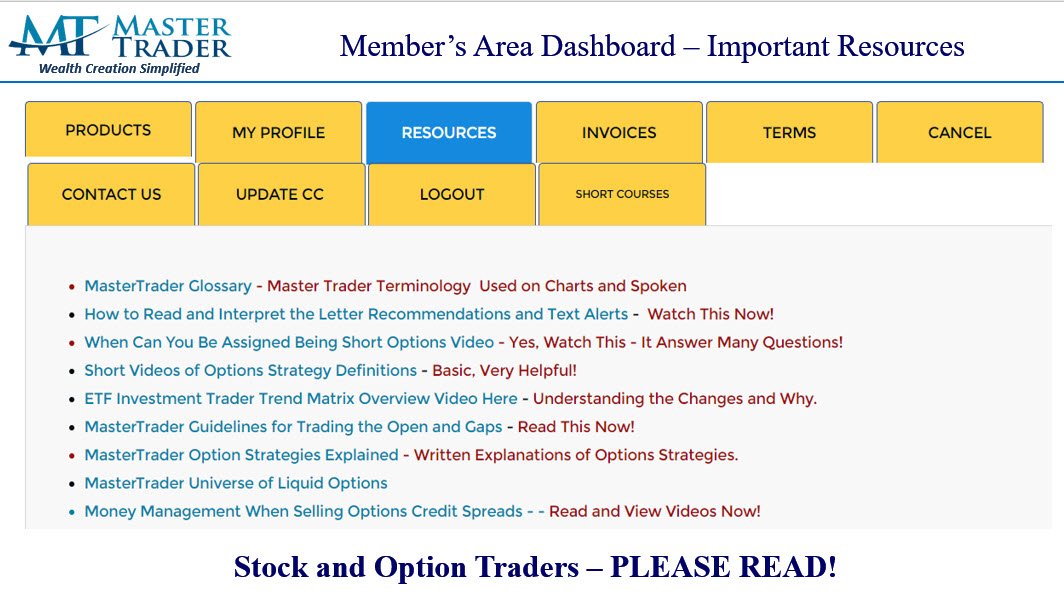
Please read the valuable information in the RESOURCES tab after you log into your Member’s Area:
Click Here – to Access the Options Credit Spread Program that puts you on the Master Trader Income Path.
Click Here to Learn The Master Trader Swing Trading Strategies to profits over a few days to weeks. To invest in ETFs for weeks to months to generate wealth with compelling patterns using MTS, see Master Trader ETF Investment Trader.
Click HERE Master Trader Weekly Lessons for Investors and Traders will build your investing and trading knowledge and confidence to profit in all markets! Each lesson can change your financial future — only $11.97/month!
Because your success is vital to you – and us.
Before selling options or credit spreads, we urge you to review the valuable and detailed information that we have provided for you in your Member’s Area.
If You’re in a Rush to Start A quick simplified approach to calculating contract size is to simply base your contract size based on the number of shares permitted in your Trading Plan as if you were trading the stock or ETF. Simple Share Sizing = $ Risk / Stop Loss The amount of money that you are willing to risk – divided by – the stop loss amount. For example, $100 / .20 = 500 shares. Credit Spread example, if your Trading Plan allowed you to trade 543 shares of AAPL based on the stop loss, then simply round down to the nearest hundred and short an equivalent number of contracts of the option. Since 1 contract represents 100 shares of the underlying, this would be five (5) contracts.
Master Trader and You Building Your Financial Future Together!
Happy trading! If you have any questions or comments, please e-mail Greg Capra at Greg@mastertrader.com or Dan Gibby at Dan@mastertrader.com
All the best,
Greg Capra Managing Director of Master Trader
Dan Gibby Chief Options Strategist
NOTE: Master Trader will show opening and closing prices of all stock and options trades. We recommend that all traders and investors use proper share sizing for positions and money management. However, we cannot recommend what that is for your particular trading style, risk tolerance, or account balance. We urge you to calculate your own share/position size based on your individualized risk parameters, Trading Plan, and familiarity with the proposed trade strategy and risk. Advanced Management Strategies (AMS) covers in detail foundation and advanced position and money management.
NOTE: Master Trader and its representatives may have existing positions in actual or other trade recommendations before or after suggested herein. Additionally, we may manage them differently for internal purposes based on different risk parameters than noted herein. All trade ideas and content are for informational and educational purposes only. It is not, nor is it intended to be, trading or investment advice or a recommendation that any security, option or investment strategy is suitable for any person. Trading securities can involve high risk and the loss of any funds. Significant gaps or volatility can increase these losses, particularly for short option strategies. Investment or trading information provided may not be appropriate for all investors, and is provided without respect to individual financial sophistication, financial situation, investing time horizon or risk tolerance. Supporting documentation for any claims (including claims made on behalf of options programs), comparison, statistics, or other technical data, if applicable, will be supplied upon request. Master Trader Consulting, Inc. is not a licensed financial advisor, registered investment advisor, or a registered broker-dealer. Options, futures and futures options are not suitable for all investors.