
 In last week’s letter, I said the ongoing rhetoric of trade wars between the US and China kept market participants on edge. Until there is some resolution to that, it’s likely that you are going to continue to see corrective, choppy price action.
That is exactly what we got and Mr. Schizophrenic continues to play havoc with this market on a day-to-day basis.
The Monday morning gap down resulted in continued selling throughout the day. Buyers stepped up at the end of the day, but it wasn’t enough to turn the day around. It was looking bad.
After Tuesday’s stabilization, the bulls gave it a try to push the markets higher on Wednesday morning, but when that fell apart it was all downhill into the close.
This certainly looked like the next move was significantly lower. In the video update Wednesday night for Thursday I talked about the wrong way option traders having stepped up excessively on the bullish side of the high and that it was starting to move to a bearish extreme.
On the gap Lower Thursday morning, they went all in on the bearish side and began aggressively betting that prices would move lower. The Equity put-call ratio Thursday morning moved up toward 1.5, which began to set the floor under the markets.
By the 10:30 ET reversal period, the market started to inch higher. As the wrong way option traders continued to buy puts betting that the market would move lower, it then began to rally after 1 o’clock and continued closing near the day’s high.
On Friday, the broader markets gapped up, rallied into the second reversal period at 10:30 ET and then started its sideways consolidation. As the markets moved into the end of the day, bullish traders (me included) were beginning to lose confidence.
At the 3 o’clock reversal period, the broader markets began to inch lower and buyers through in the towel. By the close, most markets closed near the low.
I don’t read much into the fact that the markets ended as they did on Friday. As I explained to those in the Green Room near the end of the day, at times, prices go down just because they did not go up. Buyers just decided to call it a day, exit positions and see what next week brings.
After all of those gyrations, the Dow ended just 18 points above Monday’s close and the S&P 500 just 1.3 points above Monday’s close. The NASDAQ 100 was only 1.6 points above Monday’s close and the big loser on the week was the Dow Transports having lost hundred and 76 points from Monday’s close.
Week to week, it was a small loss for most markets and a lot of running in place. However, new highs versus new lows are about even and there were slightly more advances than decliners.
Short version to the long story: all of this suggests not to expect much movement one way or the other at this time. That being said, it’s encouraging for a neutral to bullish bias that the wrong way option traders have stepped up their bearish bets.
Dow Jones Industrial Average

Above is the chart of the Dow Jones Industrial Average that we review each week. As mentioned above, after Monday closed, the ups and downs that followed finished pretty close to where Monday ended.
Wednesday’s big Topping Tail (TT) was ominous looking and suggested a continued selloff down to Major Support (MS). But on Thursday’s gap lower, the wrong way option traders started betting on a crash and by 10:30 ET the turn began to happen that sealed their fate.
Daily price pattern above rarely results in a significant move higher without more erratic price action. And while we still cannot ignore the possibility that the Dow could move lower toward that area of MS, the bullish seasonal tendency in front of a holiday and the fact that options traders are betting on that to happen, make that possibility less likely.
Until we see a convincing price pattern in one direction or the other, we suggest that you trade with a smaller size or simply start your Fourth of July holiday early.
In the market overview video, I will share a more in-depth analysis in multiple time frames. Dan and I wish you all a fabulous holiday with family and friends and thank you for your continued support. Happy Fourth of July!
Market Overview Video
[s3mv fileName=’July+2018+Letters/Broadermarkets_7_2_18.mp4′ fileType=’video’ source=’s3′ width=’800′ height=’450′ splashImage=” preLoad=’Y’ autoPlay=’N’ belowVideoHTML=” cuePoint=” redirectURL=” pauseAtCuePoint=’N’ isSecure=’Y’ bucketname=”]
NEW STOCK TRADE IDEAS
Below is a daily chart of Viavi Solutions Inc. (VIAV).
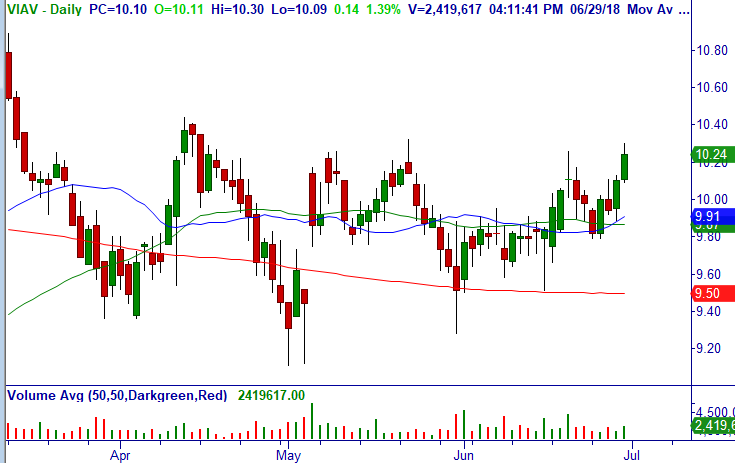
Trade: Over $10.30, consider buying stock.
Technical Setup: Breakout daily and weekly with price void above.
Stop Loss: $9.74. Once prices are above $10.50, move stop to $9.98.
Target Area: $12 and could go higher. Earnings 8/13.
Below is a weekly chart of KBR, Inc. (KBR).
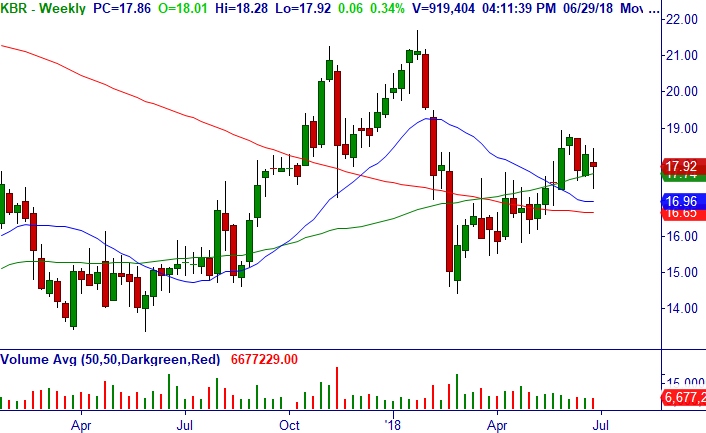
Trade: Over $18.55, consider buying stock.
Technical Setup: Buy Setup on Minor Support and r50-MA with Bottoming Tail on the weekly chart.
Stop Loss: $17.29. Earnings 7/31.
Target Area: $21 – 22.00.
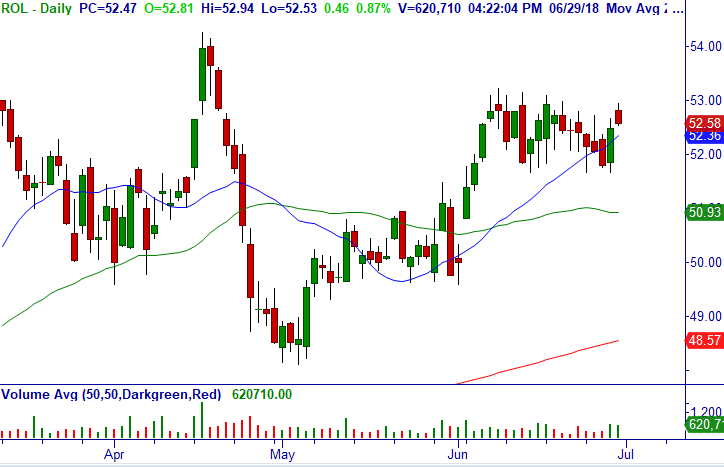
WATCH ITEM ONLY FOR BREAKOUT
NEW OPTION TRADE IDEAS
Below is a daily chart of Accenture plc (ACN).
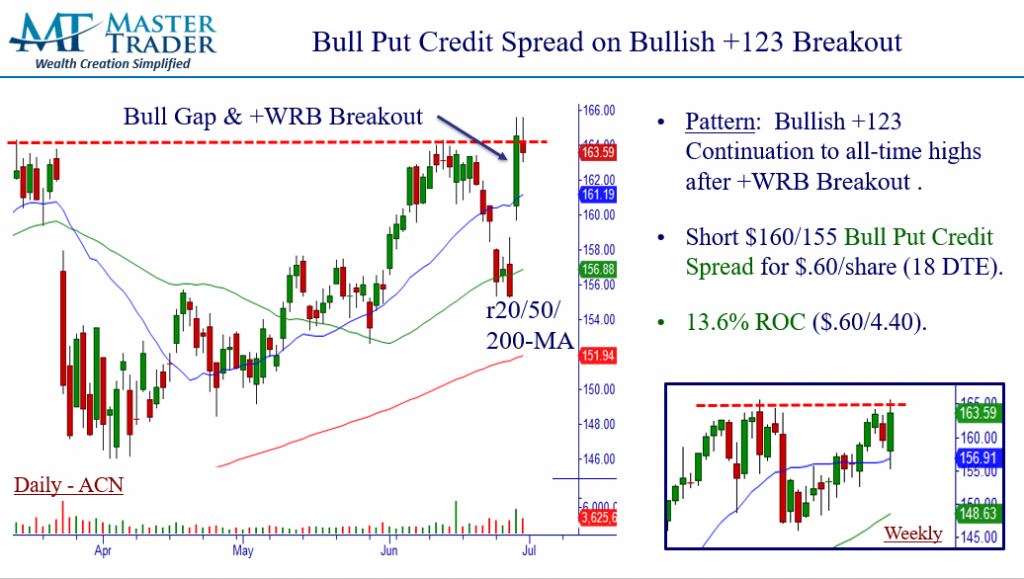
Trade: Over $165.56, consider shorting Jul (7/20) $160/155 bull put credit spread (18 DTE) for mid-point but a limit of $.60/share (closed at $.72/share).
Technical Setup: Above.
Option Strategy: Bull Put Credit Spread (BPCS).
Stop Loss: $159.68.
Below is a daily chart of Take-Two Interactive Software, Inc. (TTWO).
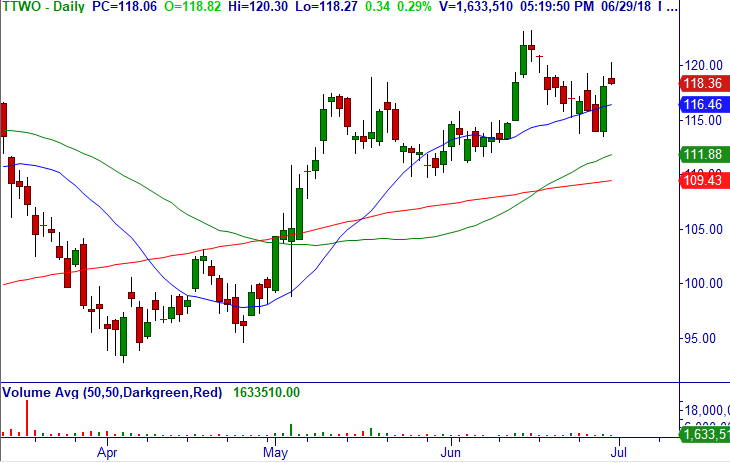
Trade: Over $119.40 (intra-day resistance), consider shorting Jul (7/20) $111/105 bull put credit spread (18 DTE) for mid-point but a limit of $.67/share (closed at $.75/share).
Technical Setup: Consolidation day following Bullish Engulfing bar on Major Support and above r20/50/200-MA daily.
Option Strategy: Bull Put Credit Spread (BPCS).
Stop Loss: $113.38.
Below is a daily chart of FMC Corporation (FMC).
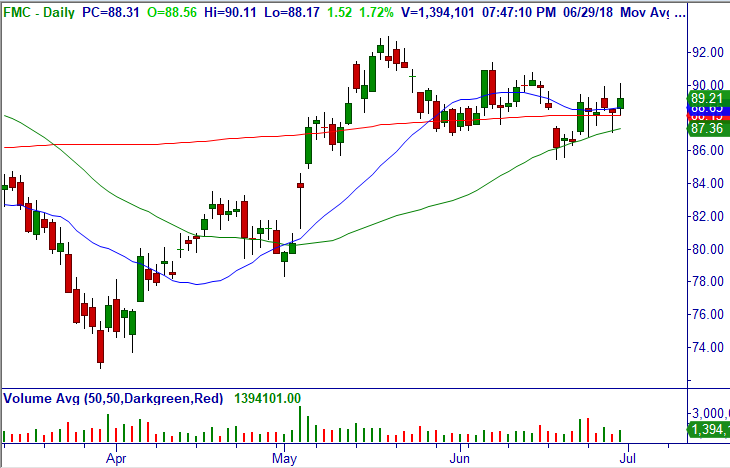
Trade: Over $90.11, consider shorting Jul (7/20) $85/80 bull put credit spread (18 DTE) for mid-point but a limit of $.45/share (closed at $.52/share).
Technical Setup: Bullish consolidation Breakout at converging MAs on the daily, Breakdown Failure on the weekly.
Option Strategy: Bull Put Credit Spread (BPCS).
Stop Loss: $85.58.
Below is a daily chart of Mohawk Industries, Inc. (MHK).
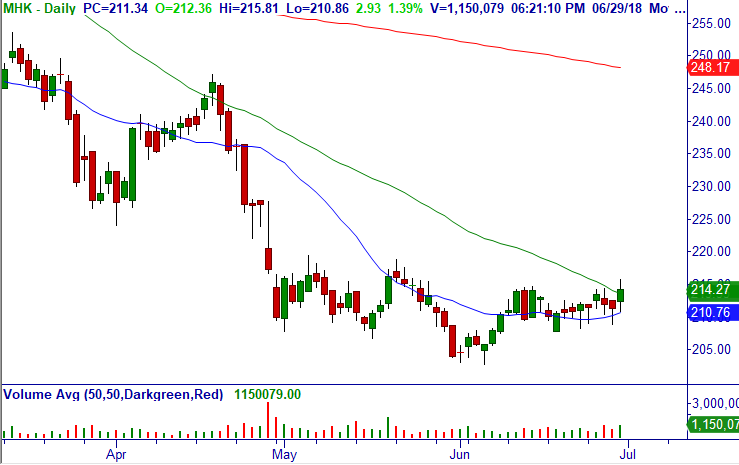
Trade: Over $215.81, consider shorting Jul (7/20) $205/200 bull put credit spread (18 DTE) for around closing mid-point of $.40/share.
Technical Setup: Bullish multi-week consolidation on the daily, Breakdown Failure on the weekly.
Option Strategy: Bull Put Credit Spread (BPCS).
Stop Loss: $206.88.
VIDEO REVIEW OF OPEN TRADES
Access Mastering Advanced Credit Spreads Course here, it’s the best $397 dollars spent to Master credit spread trading fast.
Master Trader and You Building Your Financial Future Together
Happy trading! If you have any questions or comments, please e-mail Greg Capra at Greg@mastertrader.com or Dan Gibby at Dan@mastertrader.com
All the best,
Greg Capra
Managing Director of Master Trader
Trading the Pristine Method — Origin and End
Dan Gibby
Chief Options Strategist
Follow Greg on Twitter, YouTube, and StockTwits
Twitter: @GregCapra
Stocktwits: Greg_Capra
NOTE: Master Trader will show opening and closing prices of all stock and options trades. We recommend that all traders and investors use proper share sizing for positions and money management. However, we cannot recommend what that is for your particular trading style, risk tolerance, or account balance.
We urge you to calculate your own share/position size based on your individualized risk parameters, Trading Plan, and familiarity with the proposed trade strategy and risk. Advanced Management Strategies (AMS) covers in detail foundational and advanced position and money management.
NOTE: Master Trader and its representatives may have existing positions in actual or other trade recommendations before or after suggested herein. Additionally, we may manage them differently for internal purposes based on different risk parameters than noted herein.
All trade ideas and content are for informational and educational purposes only. It is not, nor is it intended to be, trading or investment advice or a recommendation that any security, option or investment strategy is suitable for any person. Trading securities can involve high risk and the loss of any funds. Investment or trading information provided may not be appropriate for all investors, and is provided without respect to individual financial sophistication, financial situation, investing time horizon or risk tolerance. Supporting documentation for any claims (including claims made on behalf of options programs), comparison, statistics, or other technical data, if applicable, will be supplied upon request. Master Trader Consulting, Inc. is not a licensed financial advisor, registered investment advisor, or a registered broker-dealer. Options, futures and futures options are not suitable for all investors. Prior to trading securities products, please read the Characteristics and Risks of Standardize Options and the Risk Disclosure for Futures and Options found here: CLICK HERE.
