
 Based on the trend and the price action at the beginning of August, I wrote in the August 6th letter:
“The S&P 500 negated that bearish wide range bar by retracing back to the top of it. That strength — and the fact that it is still in an uptrend in all time frames — suggest the possibility that we could see new all-time highs in that index soon.”
Honestly, I thought that would have happened already. However, trade war news (again) and lately the tariffs on Turkey sent numerous markets and currencies around the world significantly lower.
The news caused relatively minor gyrations in the in the broader U.S. markets.
Last week, the S&P 500 pulled back toward its area of Major Support (MS). Once there, buyers stepped up again and, by the end of the day, a Bottoming Tail (BT) formed.
Master Trader Tip: Bottoming Tail bars in an uptrend near Major Support signal a buy set up once prices trade above the high of that BT bar.
The low of the day in the BT on Thursday happened just before 11 AM. At that time, I told those in the Green Room that the low should not be far off.
How can I know that before it happened?
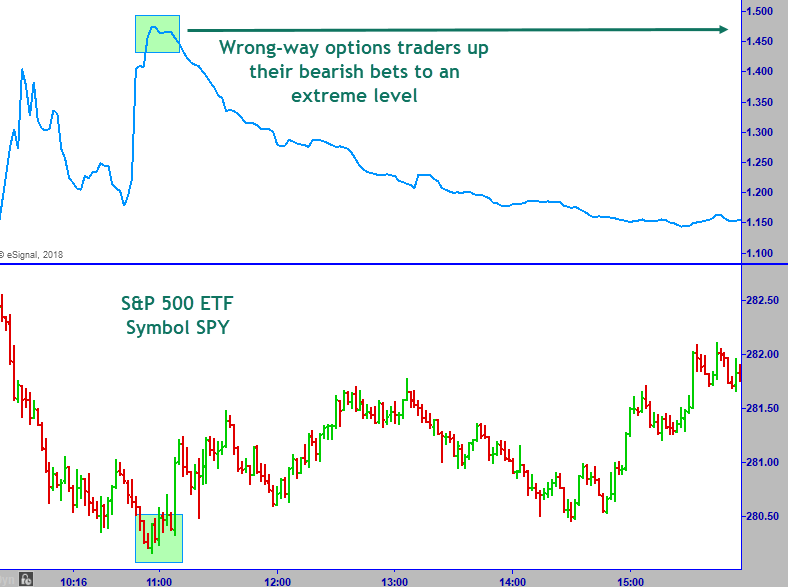
Betting that the market would crash at that time, the “wrong- way” options traders upped their bearish bets.
The put-call ratio, which measures the number of puts (bearish bets) traded versus calls (bullish bets), was almost at 1.5. That is a historical extreme to expect the low at least short-term.
On Thursday, prices gapped significantly higher and, while they did pull back from their high of the day, they held onto the majority of the gain.
Friday’s early morning dip into the second intra-day reversal at 10:30 was bought and the S&P 500 trended slowly higher throughout the day. There was some minor profit-taking after 3 o’clock, which did nothing to damage the day’s trend.
Barring more news to gyrate the markets again, those new all-time highs I was expecting a couple of weeks ago should be coming shortly — maybe this week.
Dow Jones Industrial Average
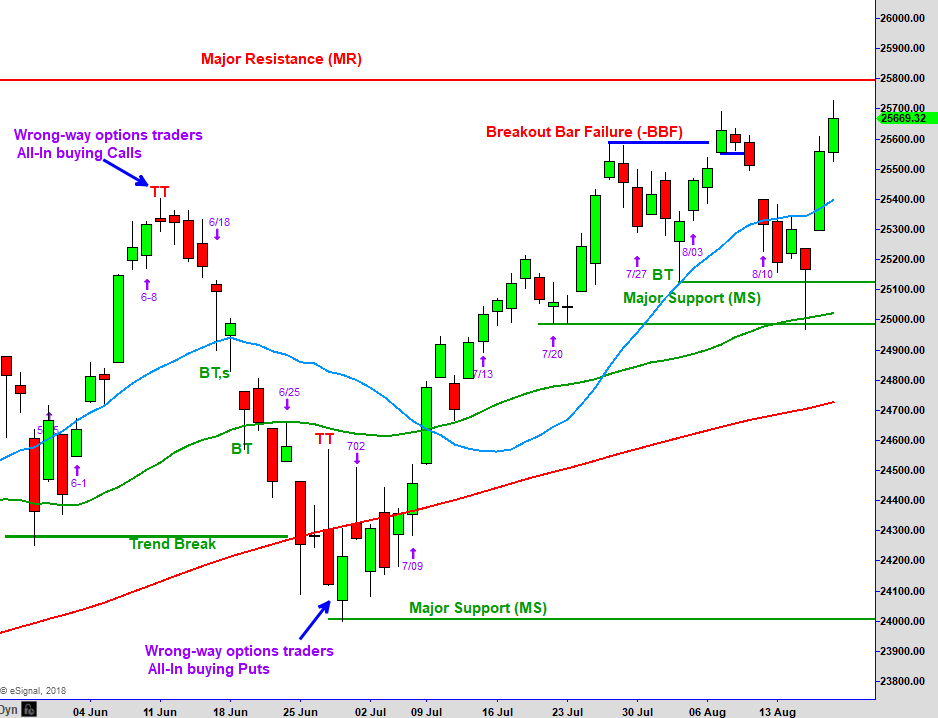
Above is the chart of the Dow Jones Industrial Average that we review each week.
Wednesday’s gap down to the low of Tuesday’s bullish reversal in the area of Major Support (MS) had overnight Long’s caught.
After 15 minutes of buyers attempting to get prices turned back higher (not shown), they gave it up, and the Dow fell sharply to the next support level below.
Once the wrong-way options traders were all-in on the bearish side just before 11 AM, the markets began to stabilize and grind higher.
There was an intraday pullback between 1 PM and 2 PM, but just before 3 PM, buyers took solid control where the Dow and most markets moved higher.
The wide range Bottoming Tail (BT) that was in place by the end of the day on Wednesday signaled that a short-term low was in place.
By the end of the week, the Dow had rallied back above the prior week’s high. That rally negated the whole bearish drop that started the prior week.
This type of price action is not typical but is the sign of the erratic news-driven market environment that we have been in this year.
If you view the weekly chart of the Dow, you will see a BT candle that traded under the prior week’s low and above the prior week’s high.
This type of candle in the context of the prior price pattern that exists on the weekly time frame strongly suggests that prices are going to move higher if they can trade above last week’s high. And of course, not trade below its low.
Market Overview Video
[s3mv fileName=’Aug+2018/BroaderMarkets_8_20_18.mp4′ fileType=’video’ source=’s3′ width=’800′ height=’450′ splashImage=” preLoad=’Y’ autoPlay=’N’ belowVideoHTML=” cuePoint=” redirectURL=” pauseAtCuePoint=’N’ isSecure=’Y’ bucketname=”]
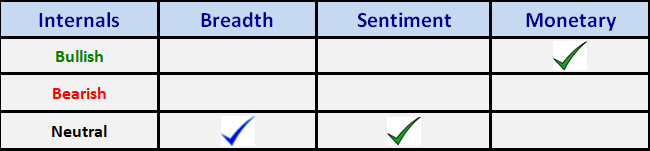
Internals
NEW STOCK TRADING IDEAS
Below is a daily/weekly chart of Emerson Electric Co. (EMR).
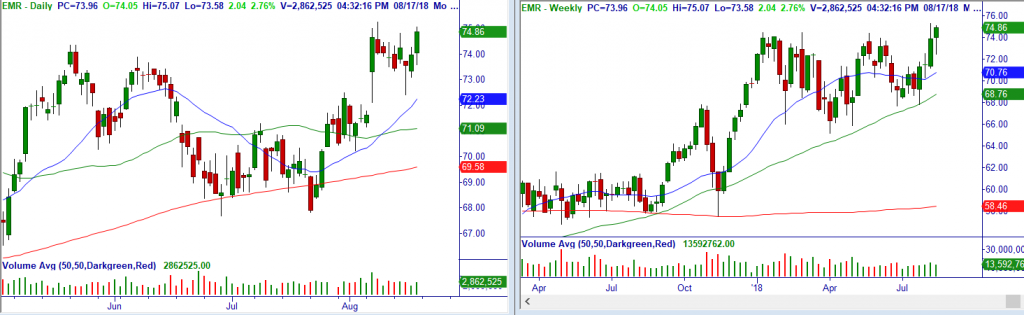
Trade: Over $75.07 consider buying stock.
Technical Setup: Breakout all time frames after Pro Gap on 8/7.
Stop Loss: $72.40.
Below is a daily chart Jacobs Engineering Group Inc. (JEC).
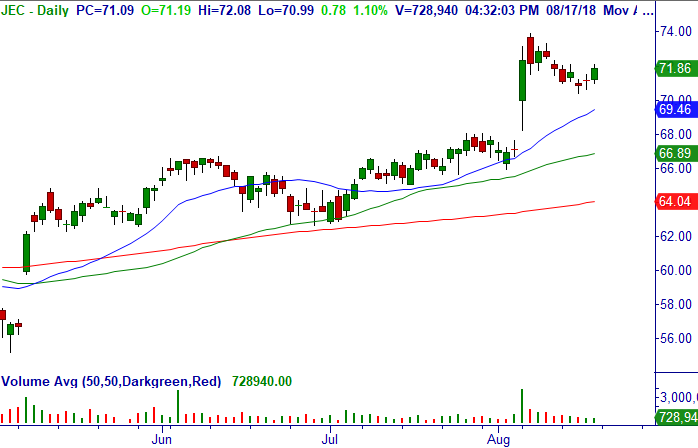
Trade: Over $72.08, consider buying stock.
Technical Setup: Master Trader Buy Setup with bullish reversal bars above r20-MA after retracement from Pro Gap Breakout daily.
Stop Loss: $70.18.
Below is a daily/weekly chart of Aflac Incorporated (AFL).
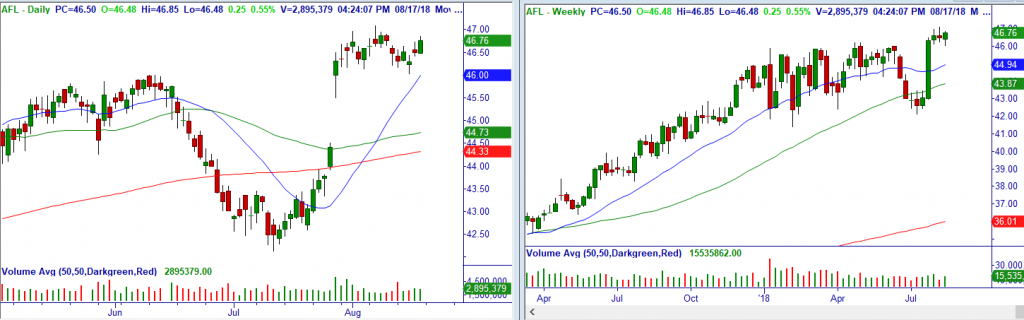
Trade: Over $47.08, consider buying stock.
Technical Setup: Bullish consolidation after Pro Gap Breakout to all-time highs daily, bullish continuation weekly and monthly.
Stop Loss: $45.98.
NEW OPTION TRADING IDEAS
Below is a daily/weekly chart of Emerson Electric Co. (EMR).
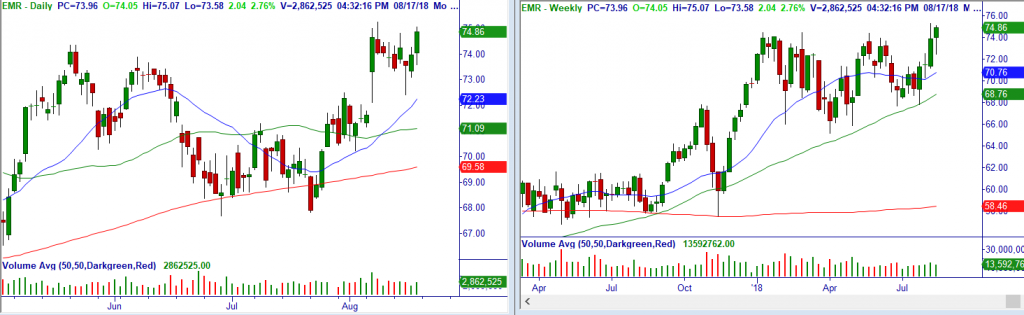
Trade: Over $75.07, consider shorting Sep (9/21) $72.5/67.5 bull put credit spread (32 DTE) for a limit of $.45/share (closed at $.47/share).
Technical Setup: Breakout all time frames after Pro Gap on 8/7.
Option Strategy: Bull Put Credit Spread (BPCS).
Stop Loss: $72.40.
Below is a daily chart Jacobs Engineering Group Inc. (JEC).
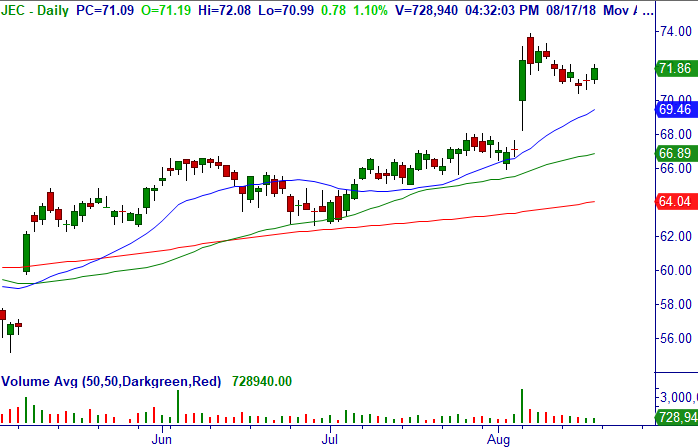
Trade: Over $72.08, consider shorting Sep (9/21) $70/65 bull put credit spread (32 DTE) for a limit of $.64/share (closed at $.70/share).
Technical Setup: Master Trader Buy Setup with bullish reversal bars above r20-MA after retracement from Pro Gap Breakout daily.
Option Strategy: Bull Put Credit Spread (BPCS).
Stop Loss: $69.98.
VIDEO ON OPEN TRADES AND ADJUSTMENTS
Thank you for being a loyal subscriber and feel to email us with any questions or comments on anything.
Learn how Master Trader Technical Strategies – MTS with Credit Spreads can make consistent money
Click Here – to Access the Program that puts you on the Master Trader Income Path.
Master Trader Weekly Lessons for Investors and Traders will build your investing and trading knowledge and confidence to profit in all markets! Learn valuable education on stocks and options; basic to advanced chart analysis and technical strategies; the professional investor’s mindset and approach to the markets; Master Trader risk management techniques, etc. Each one can change your financial future! Sign up at www.MasterTrader.com/Lessons — only $11.97/month!
Master Trader and You Building Your Financial Future Together
Happy trading! If you have any questions or comments, please e-mail Greg Capra at Greg@mastertrader.com or Dan Gibby at Dan@mastertrader.com
All the best,
Greg Capra
Managing Director of Master Trader
Trading the Pristine Method — Origin and End
Dan Gibby
Chief Options Strategist
Follow Greg on Twitter, YouTube, and StockTwits
Twitter: @GregCapra
Stocktwits: Greg_Capra
NOTE: Master Trader will show opening and closing prices of all stock and options trades. We recommend that all traders and investors use proper share sizing for positions and money management. However, we cannot recommend what that is for your particular trading style, risk tolerance, or account balance.
We urge you to calculate your own share/position size based on your individualized risk parameters, Trading Plan, and familiarity with the proposed trade strategy and risk. Advanced Management Strategies (AMS) covers in detail foundational and advanced position and money management.
NOTE: Master Trader and its representatives may have existing positions in actual or other trade recommendations before or after suggested herein. Additionally, we may manage them differently for internal purposes based on different risk parameters than noted herein.
All trade ideas and content are for informational and educational purposes only. It is not, nor is it intended to be, trading or investment advice or a recommendation that any security, option or investment strategy is suitable for any person. Trading securities can involve high risk and the loss of any funds. Investment or trading information provided may not be appropriate for all investors, and is provided without respect to individual financial sophistication, financial situation, investing time horizon or risk tolerance. Supporting documentation for any claims (including claims made on behalf of options programs), comparison, statistics, or other technical data, if applicable, will be supplied upon request. Master Trader Consulting, Inc. is not a licensed financial advisor, registered investment advisor, or a registered broker-dealer. Options, futures and futures options are not suitable for all investors. Prior to trading securities products, please read the Characteristics and Risks of Standardize Options and the Risk Disclosure for Futures and Options found here: CLICK HERE.
