
 In last Monday’s commentary, I said, “It would not be a surprise to see the Russell 2000 — which has been leading the way higher this year — make new all-time highs this week.
The theme there has been that the stocks in that index are less susceptible to the effects of a trade war.” Surprisingly, that did not happen.
While the Russell 2000 didn’t move up at the beginning of the week, it could not overcome the old all-time high. It is within striking distance of doing that, but Friday’s weak close and relative weakness now puts that in question.
We’ll see.
But that did not stop the NASDAQ 100, Computer Software, Technology, Internet and Consumer Discretionary ETF’s from making new all-time highs.
The S&P 500 inched over the prior high from June, but is far off from its all-time high. The next resistance area is just above but that should not be an issue to overcome. If it is, that would be viewed as a short-term bearish sign.
The confirmation and even the escalation of the trade war tariffs have been accepted by the broader markets. With that being the case, we may see the Russell 2000 — which was outperforming because of trade war concerns — begin to under perform.
The current under performance of the Transportation Index and narrowing yield curve must be monitored for any further deterioration. And, of course, we are doing that — and you should too.
The market internals that we follow have now become neutral, so the underpinning support of the wrong way options traders betting on the market collapse has now abated.
That does not mean that the market cannot continue to move higher. That is what last week’s action and current trends suggest is going to happen — the market move higher.
Assuming that it does, when sentiment becomes excessively bullish — as it did in June, we can expect the market to correct that excessive optimism.
Based on the above, the odds favor a bullish bias but we still have our lines in the sand to stay objective.
That first line in the sand is last week’s low in whatever broader market or sector index you’re using. After that, use the June low.
Dow Jones Industrial Average

Above is the chart of the Dow Jones Industrial Average that we review each week.
The Dow was able to overcome its recent resistance area that had formed after its trend break last week. It was even able to turn slightly positive on the year.
That would not have happened without the removal of General Electric and the insertion of Walgreens (WBA) into the index. Walgreens was actually the best performing Dow stock on Friday.
However, WBA is still in a weekly downtrend but near its long-term support where it gapped down to in June.
The amazingly Impeccable timing of insertion into the Dow index!
The Major Resistance (MR) area is between 25,200 and 25,400. And while Wednesday’s low is not a swing low as defined in the Master Trader Technical Strategies course, it is a point that should not be violated in the short term.
There are seven stocks within the Dow Index that will be reporting earnings this week to take note of.
On Tuesday the 17th are United Health (UNH), Goldman Sachs (GS) and Johnson & Johnson (JNJ).
On Wednesday the 18th is International Business Machines (IBM) and American Express (AXP).
On Thursday the 19th is Microsoft (MSFT) and Travelers (TRV).
Outside of the Dow Index, there is a full lineup of earnings that are coming. We always check earnings before providing a recommendation and you certainly should be doing so on any of your own selections.
Market Overview Video
[s3mv fileName=’July+2018+Letters/BroaderMarkets_7_16_18.mp4′ fileType=’video’ source=’s3′ width=’800′ height=’450′ splashImage=” preLoad=’Y’ autoPlay=’N’ belowVideoHTML=” cuePoint=” redirectURL=” pauseAtCuePoint=’N’ isSecure=’Y’ bucketname=”]
NEW STOCK TRADE IDEAS
Below is a daily chart of SPDR S&P Biotech ETF (XBI).
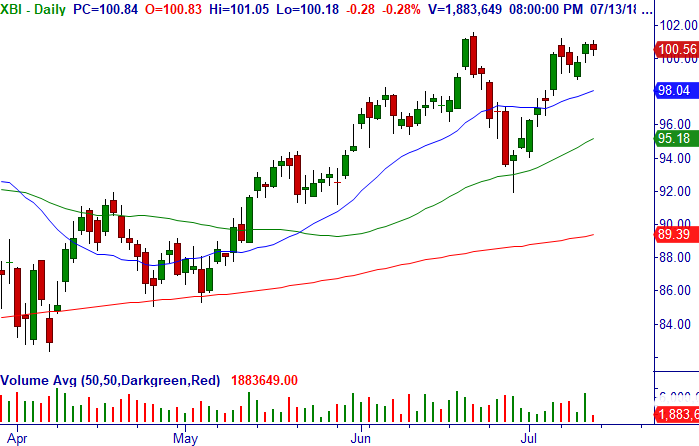
Trade: Over $101.17, consider buying a half lot of XBI (we will monitor for an add on pull backs). When we refer to “half lot,” it means to only take one-half your otherwise normal position size permitted in your Trading Plan. For example, if your max loss (risk) per trade is $500, reduce the number of shares to equal (about) that $500 at the stop price.
Technical Setup: Bullish consolidation at Major Resistance after 100% retracement and higher low on the daily, bullish narrow range bar at the high end of the bullish engulfing bar above the r20-MA on the weekly chart, and bullish uptrend on the monthly chart.
Stop Loss: $93.98 initially
Below is a weekly chart of RH (RH).
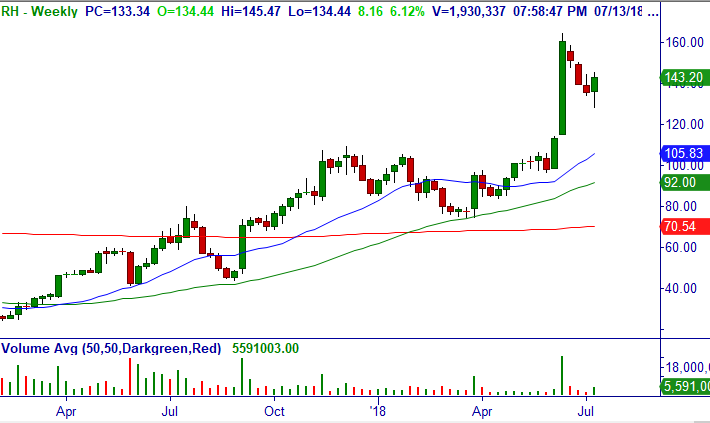
Trade: Over $145.47, consider buying a half lot of stock. When we refer to “half lot,” it means to only take one-half your otherwise normal position size permitted in your Trading Plan. For example, if your max loss (risk) per trade is $500, reduce the number of shares to equal (about) that $500 at the stop price.
Technical Setup: Master Trader Buy Setup, Bottoming Tail and bullish reversal at mid-point of prior +WRB on the weekly chart, +WRB after retracement from Pro Gap daily.
Stop Loss: None now, but if trades under $140 after entry, then sell the Jul (7/27) $145 calls to leg into a covered call.
Below is a daily chart of Darden Restaurants, Inc. (DRI).
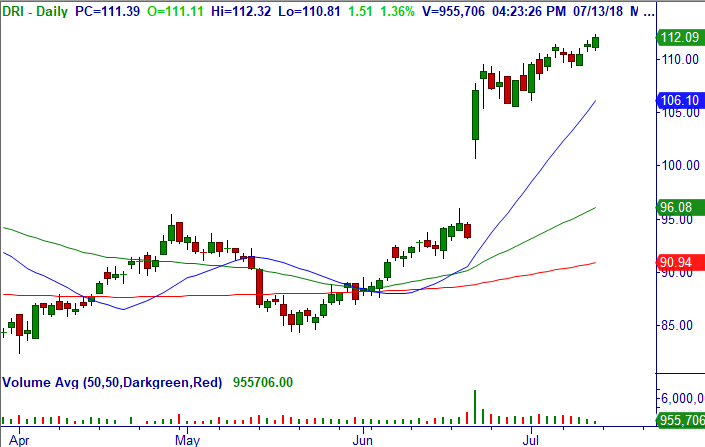
Trade: Over $112.32, consider buying a half lot of stock. When we refer to “half lot,” it means to only take one-half your otherwise normal position size permitted in your Trading Plan. For example, if your max loss (risk) per trade is $500, reduce the number of shares to equal (about) that $500 at the stop price.
Technical Setup: Continuation Breakout after bullish move and consolidation from Pro Gap daily, bullish weekly and monthly.
Stop Loss: $105.52 for now.
NEW OPTION TRADE IDEAS
Below is a weekly chart of Burlington Stores, Inc. (BURL).
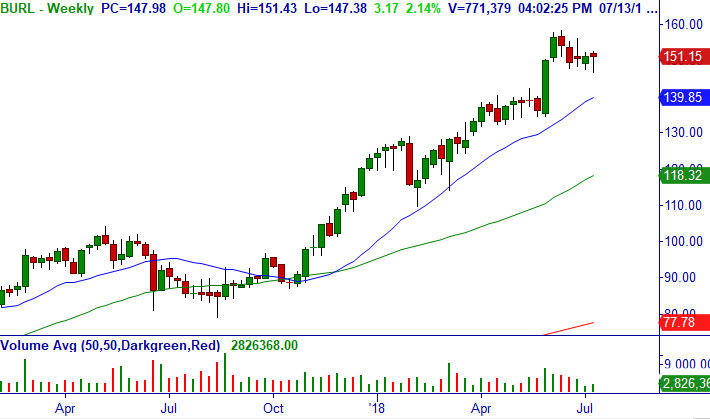
Trade: Over $152.52, consider buying stock and shorting Jul (7/20) $157.5 calls (5 DTE) (calls closed at $.50/share so the premium will lower our cost basis and give us positive time decay income and will be higher when triggers).
Technical Setup: Master Trader Buy Setup and Bottoming Tail in strong uptrend weekly.
Option Strategy: Covered Call (CC).
Stop Loss: $146.62.
Below is a daily chart of Coupa Software Incorporated (COUP).
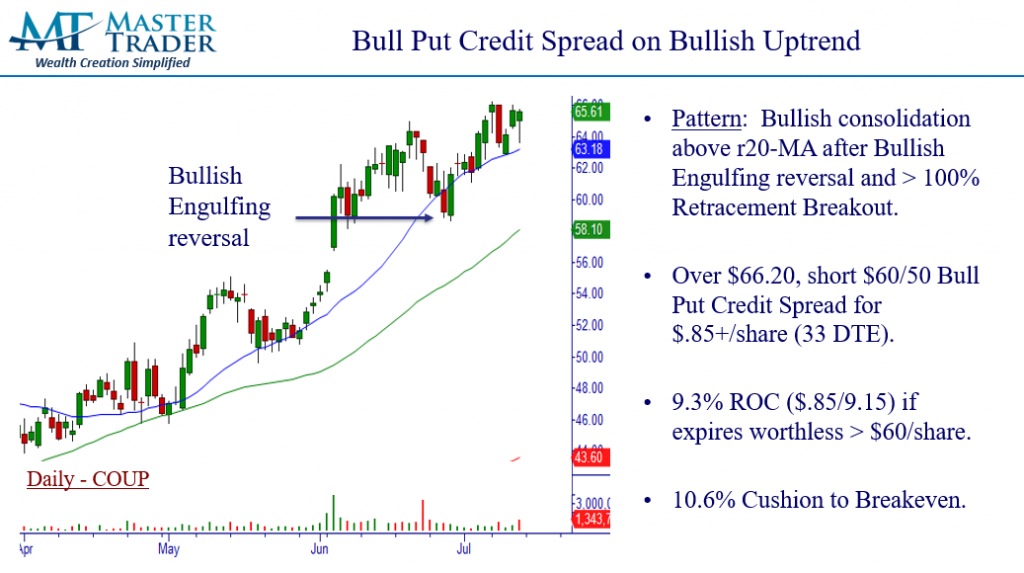
Trade: Over $66.20, consider shorting Aug (8/17) $60/50 bull put credit spread (33 DTE) for mid-point but limit of $.85/share (closed at $.95/share).
Technical Setup: Bullish consolidation above r20-MA after Bullish Engulfing reversal and > 100% Retracement Breakout on the daily chart.
Option Strategy: Bull Put Credit Spread (BPCS).
Stop Loss: $60.88.
Below is a daily chart of VMware, Inc. (VMW).
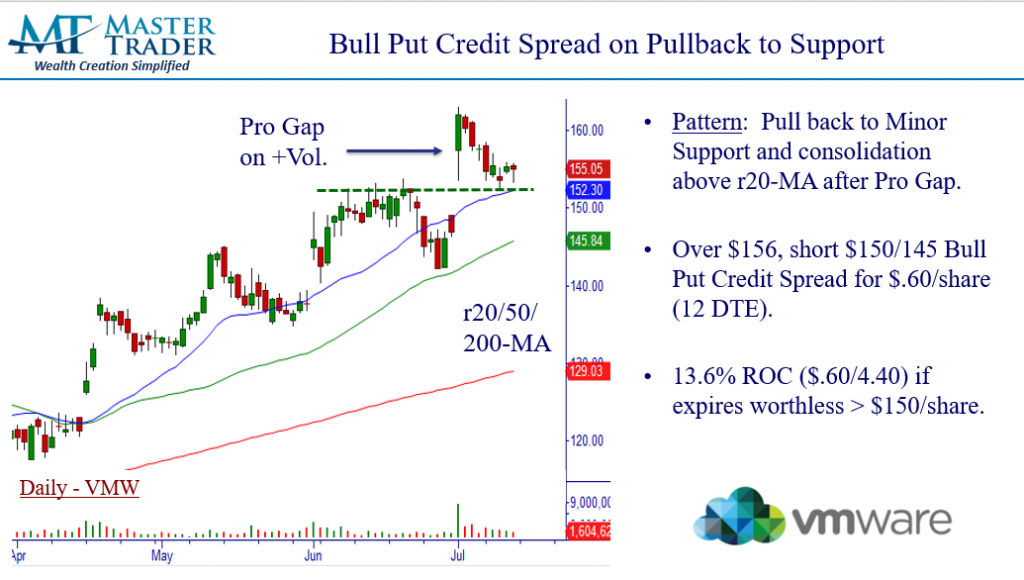
Trade: Over $156, consider shorting Jul (7/27) $150/145 bull put credit spread (12 DTE) for mid-point but limit of $.60/share (closed at $.65/share).
Technical Setup: Pull back to Minor Support and consolidation above r20-MA after Pro Gap on the daily chart.
Option Strategy: Bull Put Credit Spread (BPCS).
Stop Loss: $151.88.
VIDEO REVIEW OF OPEN AND CLOSED POSITIONS
Thank you for being a loyal subscriber and feel to email us with any questions or comments on anything.
Access Mastering Advanced Credit Spreads Course here, it’s the best $397 dollars spent to Master credit spread trading fast.
Master Trader and You Building Your Financial Future Together
Happy trading! If you have any questions or comments, please e-mail Greg Capra at Greg@mastertrader.com or Dan Gibby at Dan@mastertrader.com
All the best,
Greg Capra
Managing Director of Master Trader
Trading the Pristine Method — Origin and End
Dan Gibby
Chief Options Strategist
Follow Greg on Twitter, YouTube, and StockTwits
Twitter: @GregCapra
Stocktwits: Greg_Capra
NOTE: Master Trader will show opening and closing prices of all stock and options trades. We recommend that all traders and investors use proper share sizing for positions and money management. However, we cannot recommend what that is for your particular trading style, risk tolerance, or account balance.
We urge you to calculate your own share/position size based on your individualized risk parameters, Trading Plan, and familiarity with the proposed trade strategy and risk. Advanced Management Strategies (AMS) covers in detail foundational and advanced position and money management.
NOTE: Master Trader and its representatives may have existing positions in actual or other trade recommendations before or after suggested herein. Additionally, we may manage them differently for internal purposes based on different risk parameters than noted herein.
All trade ideas and content are for informational and educational purposes only. It is not, nor is it intended to be, trading or investment advice or a recommendation that any security, option or investment strategy is suitable for any person. Trading securities can involve high risk and the loss of any funds. Investment or trading information provided may not be appropriate for all investors, and is provided without respect to individual financial sophistication, financial situation, investing time horizon or risk tolerance. Supporting documentation for any claims (including claims made on behalf of options programs), comparison, statistics, or other technical data, if applicable, will be supplied upon request. Master Trader Consulting, Inc. is not a licensed financial advisor, registered investment advisor, or a registered broker-dealer. Options, futures and futures options are not suitable for all investors. Prior to trading securities products, please read the Characteristics and Risks of Standardize Options and the Risk Disclosure for Futures and Options found here: CLICK HERE.
