

I’m shocked at the market’s strength last week in light of the ongoing economic problems and the failure of Congress to negotiate a fifth stimulus bill. The market appears to be pricing in an expected deal and a recovering economy.
The Nasdaq set another record, and the S&P is just 1% away from its pre-coronavirus all-time high – amazing.
If the recovery is taking place, perhaps there will be more rotation from growth stocks to more economically sensitive value stocks. A lot of the beaten-down sectors like airlines, hotels, and leisure have built short term support.
Barron’s cover story is called “ELECTION 2020 – What the Outcome Will Mean for the Market.”
Most predict a Biden victory, which means more taxes and regulations are coming, but different scenarios exist for the House and Senate.
Some believe that if Trump wins and Republicans keep the Senate, then smaller companies, technology, and financials will benefit.
If Biden wins and Democrats control both houses, then green energy, infrastructure, and cannabis stocks should benefit. Taxes would definitely rise, and the stock market will likely fall; however, if Republicans keep the Senate, research shows that the Dow has the best gains with a split Congress.
Some believe that if Trump wins and Republicans keep the Senate, then smaller companies, technology, and financials will benefit.
Another article, says that clean energy, infrastructure, and some health-care companies are likely to gain no matter who wins in the 2020 election. Listed are QCLN, PBW, TAN, FAN, LIT, PAVE, IFRA, IHF, XHS, and PSCI.
As always, we will just follow our objective approach to market analysis, while always monitoring our market internals for likely turning spots. Good trading!
TREND MATRIX
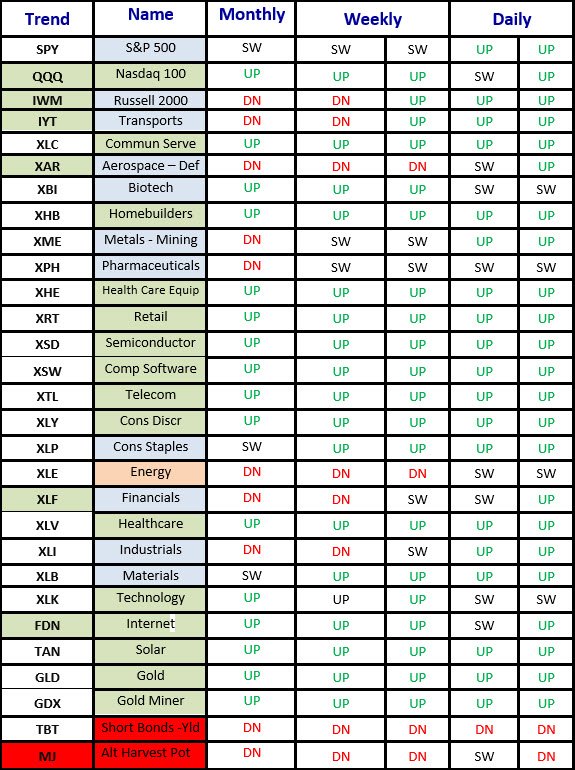
There are more sectors turning Green, and that is what happens near the end of a move; however, that end is not in sight yet.
Technology stocks in the NASDAQ 100 saw an increase in selling on Friday, and that’s a short-term concern. Technology has been the leader of this market.
The Transports and the Russell 2000 finally started playing “catch-up,” which we’ve been expecting, but it took so long that we began to think it would never happen.
Both formed +WRBs on Friday, so it would be normal to see some consolidation.
The trend remains up in the S&P 500 and the NASDAQ 100, and now that the Transports and the Russell have joined, we can only expect higher prices for now.
TREND MATRIX PERCENTAGE CHANGES
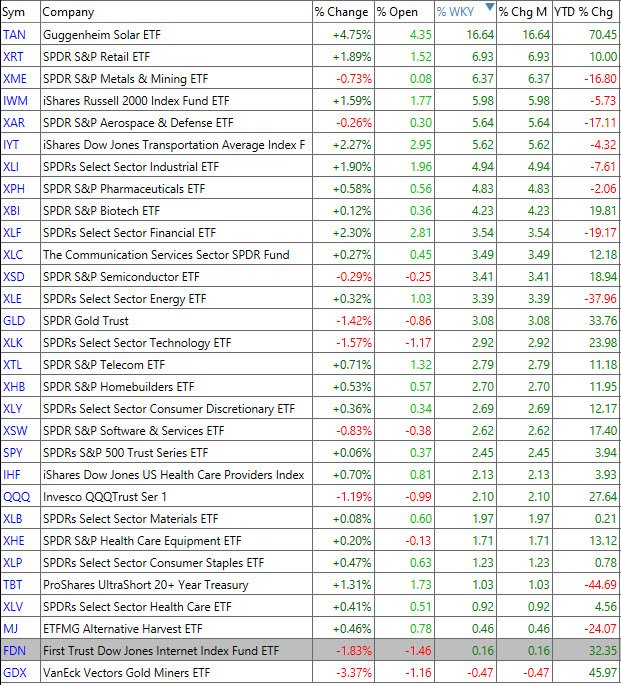
Almost 100% winners last week!
GDX was the only loser, but it and Gold (GLD) have been the strongest. So, resting now within the multiple time frame uptrend would be normal.
Solar (TAN) has been on fire and with a 16% move higher in a week, a pullback or consolidation is likely.
The laggards, that we’ve been talking about for some time that should be getting ready to play “catch-up,” did.
The Transportation Index and the Russell 2000 Index pushed higher throughout the day on Friday. They closed with +WRBs, which suggests that they should rest a bit.
Aerospace and Defense looks like it is done creating a bottom and ready to move up.
Financials finally did well and look ready to participate, “bringing up the rear” and catching up.
The Energy sector has gyrated back-and-forth week to week from the bottom and top the list. It was at the bottom last week and moved back up near the top of the list again this week.
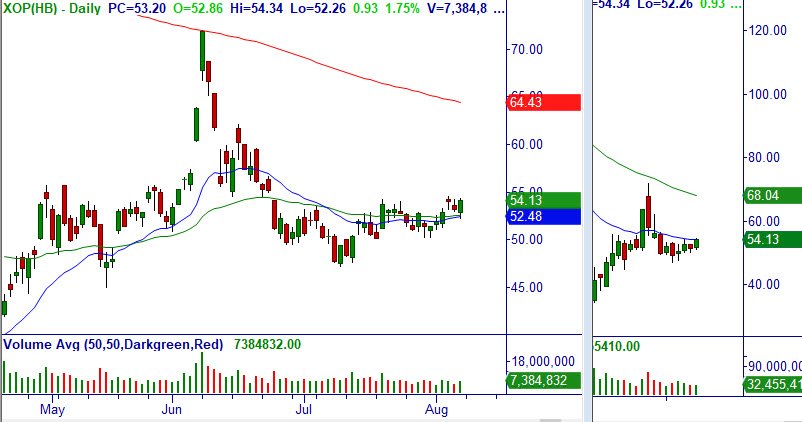
The S&P 500 Energy ETF (XLE) is not the best-looking Energy ETF chart. XOP, the Oil & and Gas ETF, is a more bullish pattern with less overhead resistance.
Technology, which has been leading the way higher, continued its gains last week, but sellers began dumping shares on Friday. It now has a short-term bearish pattern.
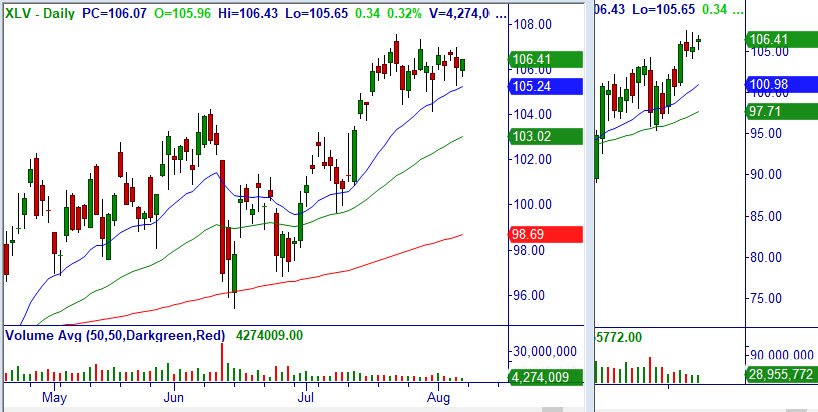
The Health Care ETF has been chopping sideways over the last month and might be ready to break out above this recent consolidation range.
Where Are the Markets Headed
Upward momentum increased last week. It’s great that prices were able to come out of the recent trading range, but it’s a small concern.
It’s a small concern because when momentum picks up for several days in a row, that is usually followed by a resting period.
A resting period isn’t a change in trend direction, but we may see more of the choppy price action that we have become accustomed to in this market environment.
The S&P 500 Index is within striking distance of an all-time high, and it would be a surprise if it didn’t get there before a larger market correction happened.
Technology stocks and the NASDAQ 100 saw an increase in selling on Friday, and that’s a short-term concern. Technology has been the leader of this market.
There have been other correction days for the NASDAQ 100, but this one occurred after a minor resting period of a few days and a +WRB breakout to a new high.
A pullback typically follows that price action. However, if we should see a Red Bar Ignored (RBI) early in the week, I suspect the market may blastoff higher.
The Transports and the Russell 2000 finally started playing catch-up, which we’ve been expecting, but it took so long that we began to think it would never happen.
Both formed +WRBs on Friday, so it would be normal to see some consolidation.
Our market internal gauges are still not in alignment and what has kept us believing that this market could go higher until they did agree.
The narrow breadth (few stocks driving the market higher) has kept that market internal gauge neutral but is inching toward a bearish level.
Sentiment is ridiculously bearish, but until breadth agrees, we don’t have a signal.
The trend remains up in the S&P 500 and the NASDAQ 100, and now that the Transports and the Russell have joined, we can only expect higher prices for now.
Master Trader Strategies (MTS) – Simple Common-Sense Analysis
VIDEO REVIEW OF MARKETS AND INTERNALS
[s3mm type=”video” source=”cloudfront” files=”aug-2020-letters/Broadermarkets_8_10_20.mp4″ /]
NEW ETF TRADE IDEAS
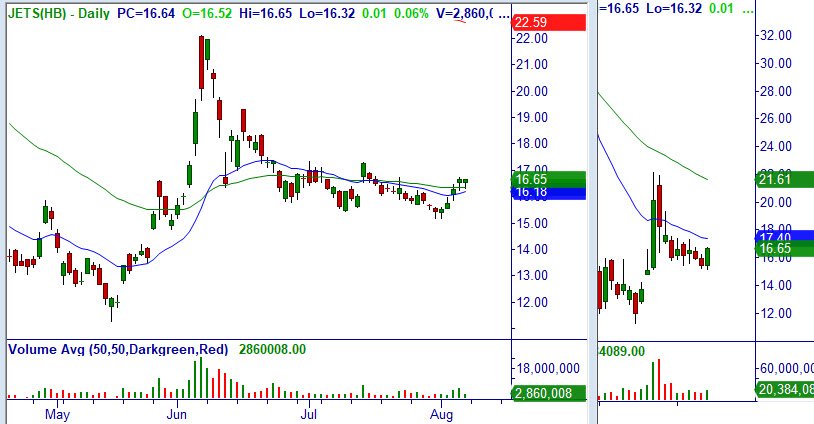
8/10: JETS – Consider buying the ETF over $16.74. Breakout daily/weekly. Stop 15.16.
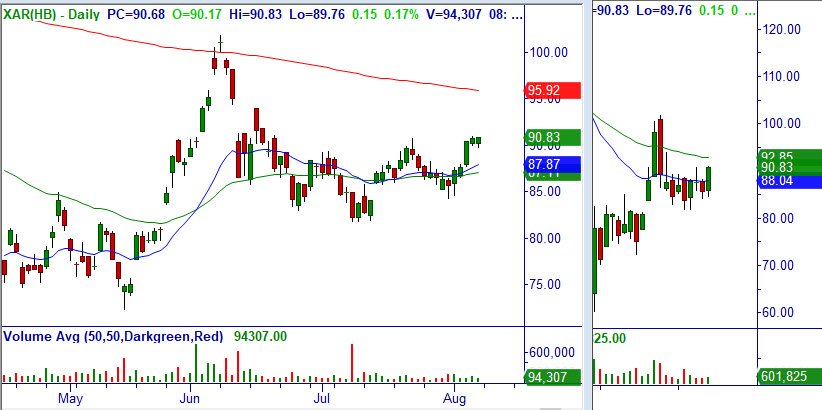
8/10: XAR – Consider buying the ETF over $90.91. Breakout daily/weekly. Stop $84.61.
8/10: XOP – Consider buying the ETF over $54.34. Bullish engulfing on support and 20/50-MA after +Gap breakout daily, breakout weekly. Stop $50.23.
8/10: XLV – Consider buying the ETF over $106.96 Breakout daily/weekly. Stop $104.13.
OPEN AND CLOSED ETF POSITIONS WITH TRADE UPDATES (NOTE: Also in Member’s Area in Open/Closed Trade Sheet)
6/22: GDX – Bought the ETF at $34.72. 8/8: Move Stop $41.76
8/4: IWM – Bought the ETF at $150.26. 8/8: Move Stop $151.77
8/10: JETS – Consider buying the ETF over $16.74. Breakout daily/weekly. Stop $15.16
8/7: KRE – Bought the ETF at $38.70. Breakout daily, Major Support weekly. Stop $35.86
7/13: MJ – Bought the ETF at $13.21. Stopped at $12.60
7/8: SIL – Bought the ETF at $39.05. 7/22: Sold half at $46.73. 8/8: Move Stop $47.14
7/23: SPHB – Bought the ETF at $41.62. 8/8: Move Stop $40.53
8/3: SPYV – Bought the ETF at $30.58. 8/8: Move Stop $29.99
8/10: XAR – Consider buying the ETF over $90.91. Breakout daily/weekly. Stop $84.61
7/20: XES – Bought the ETF at $34.46. 8/8: Move Stop $33.83
7/7: XHE – Bought the ETF at $90.02, added at $88.50. 8/8: Move Stop $95.75
8/10: XLV – Consider buying the ETF over $106.96 Breakout daily/weekly. Stop $104.13
8/10: XOP – Consider buying the ETF over $54.34. Bullish engulfing on support and 20/50-MA after +Gap breakout daily, breakout weekly. Stop $50.23
7/13: XME – Bought the ETF at $21.39. 8/8: Move stop to $22.74
Thank you for being a loyal subscriber and feel to email us with any questions or comments on anything.
Click Here – to Access the Options Credit Spread Program that puts you on the Master Trader Income Path.
Click Here to Learn The Master Trader Swing Trading Strategies to profits over a few days to weeks.
Our comprehensive Master Trader All-Inclusive Advisory Market Edge Membership includes the Master Trader Advisory Swing and Options Trader — plus much more – in providing ongoing, invaluable trading information for active investors and traders.
Click HERE Master Trader Weekly Lessons for Investors and Traders will build your investing and trading knowledge and confidence to profit in all markets! Each lesson can change your financial future — only $11.97/month!
Master Trader and You Building Your Financial Future Together!
Happy trading! If you have any questions or comments, please e-mail Greg Capra at Greg@mastertrader.com or Dan Gibby at Dan@mastertrader.com
All the best,
Greg Capra Managing Director of Master Trader
Dan Gibby Chief Options Strategist
NOTE: Master Trader will show opening and closing prices of all stock and options trades. We recommend that all traders and investors use proper share sizing for positions and money management. However, we cannot recommend what that is for your particular trading style, risk tolerance, or account balance. We urge you to calculate your own share/position size based on your individualized risk parameters, Trading Plan, and familiarity with the proposed trade strategy and risk. Advanced Management Strategies (AMS) covers in detail foundation and advanced position and money management.
NOTE: Master Trader and its representatives may have existing positions in actual or other trade recommendations before or after suggested herein. Additionally, we may manage them differently for internal purposes based on different risk parameters than noted herein. All trade ideas and content are for informational and educational purposes only. It is not, nor is it intended to be, trading or investment advice or a recommendation that any security, option or investment strategy is suitable for any person. Trading securities can involve high risk and the loss of any funds. Significant gaps or volatility can increase these losses, particularly for short option strategies. Investment or trading information provided may not be appropriate for all investors, and is provided without respect to individual financial sophistication, financial situation, investing time horizon or risk tolerance. Supporting documentation for any claims (including claims made on behalf of options programs), comparison, statistics, or other technical data, if applicable, will be supplied upon request. Master Trader Consulting, Inc. is not a licensed financial advisor, registered investment advisor, or a registered broker-dealer. Options, futures and futures options are not suitable for all investors.
