

Last Week the Market Made a Significant Change. Many Opportunities are Unfolding. Below is this Week's Advisory Letter to Update You.
Some of last week's comments from the 5-30-23 letter included,
"The positive charts mentioned support higher prices as long as they don't close below last week's low.
Institutions are wholeheartedly committed to the long side on Friday, which created a bullish wide-range bar (+WRB) on the S&P 500."
More...
Last week markets started tentatively as the markets waited for confirmation of the debt ceiling being lifted.
Prices retraced a bit on Tuesday and Wednesday, but not enough to put the prior week's bullish wide-range bar that formed that Friday in question.
Republicans and Democrats agreed to keep the money spigot open, and markets rallied on Thursday.
With the debt ceiling out of the way, the next news was the jobs report on Friday.
The report came in much higher than expected. Many more jobs were created, and not what the markets wanted to ensure that the Fed would stand pat on interest rates in June. The markets should fall on that number, but wait.
The number of people unemployed increased, and wages rose smaller than expected. That was enough to believe the Fed could not raise rates in June.
As mentioned, this market (institutions) will turn on a dime in another direction based on good or bad news. Figuring out when good is good or bad and vice versa increases the schizophrenic price action.
The price action on Friday confirmed that more people are out of work, and those working will be getting paid less than expected is fantastic for the stock market.
After months of a wide and whippy trading range followed by another two months of a relatively tight range at resistance, the S&P 500 broke out.
This breakout was important because it was accompanied by a broadening in market breadth, which has not happened all year.
We previously mentioned that for the S&P 500 to move higher, stocks other than a few related techs needed to start moving higher. That happened last week.
ETFs S&P 500 and NASDAQ 100 Weighted (weighted by capitalization) and Equal Weighted.
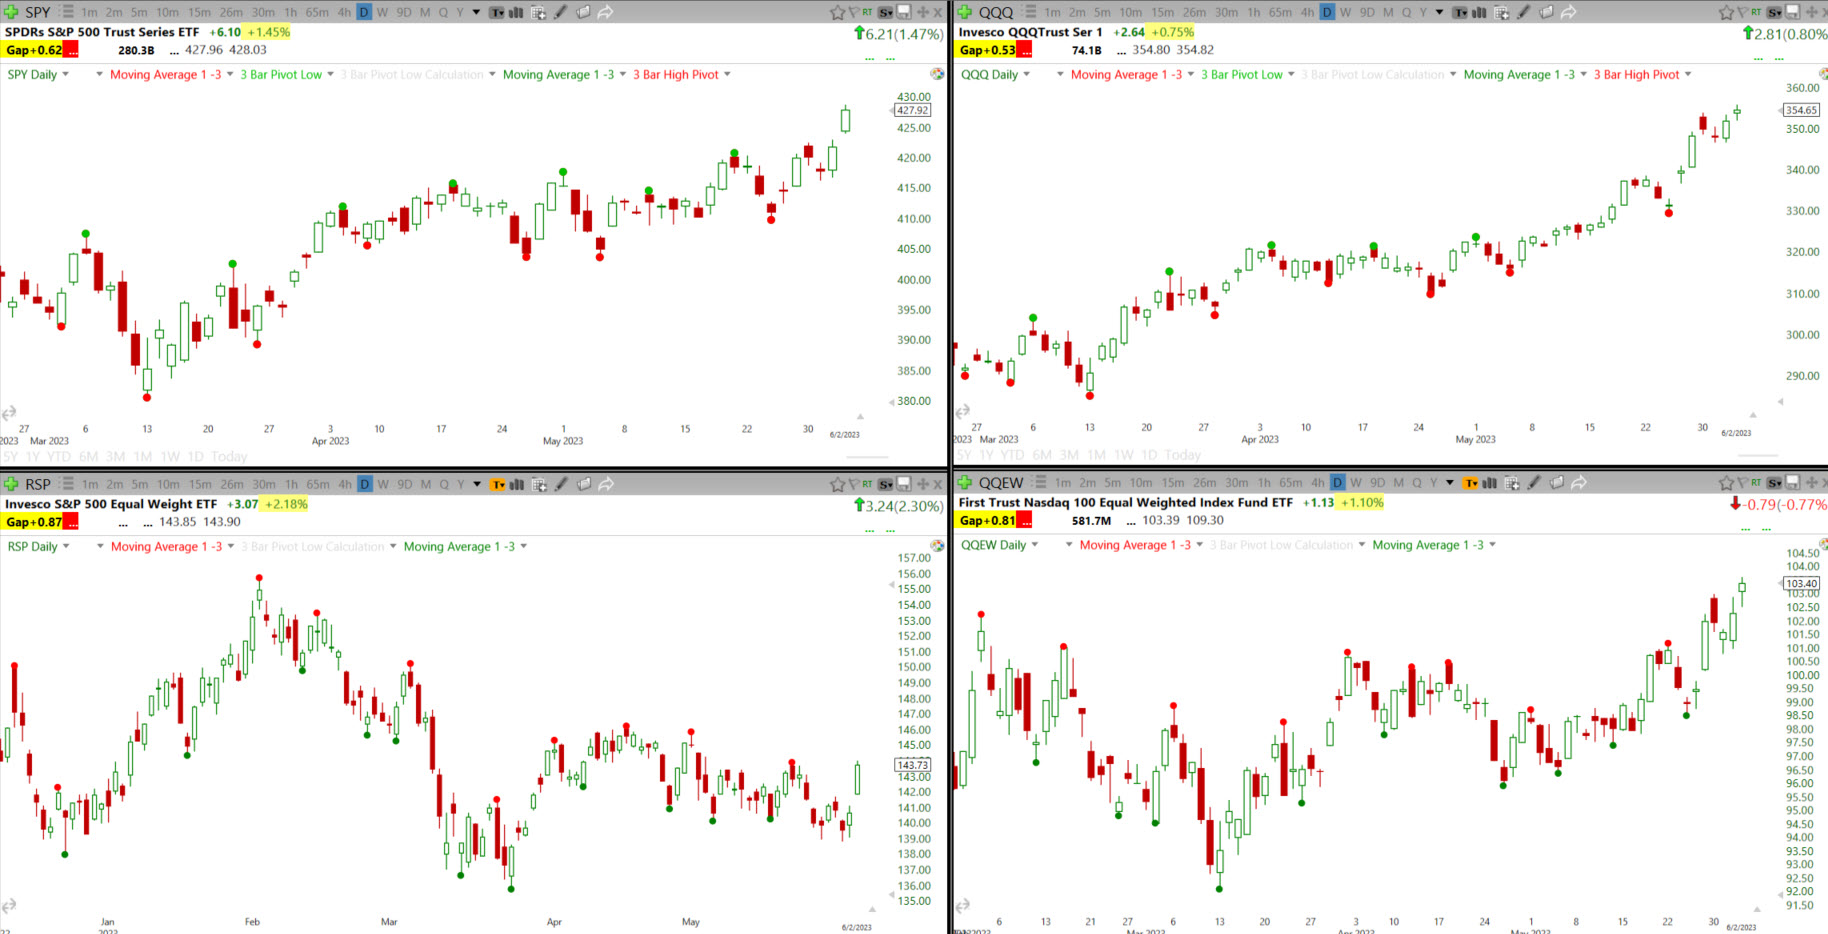
The charts above show the S&P 500 and NASDAQ 100 Weighted (weighted by capitalization) and Equal Weighted.
The two top charts are weighted, and their trends are stronger than the equal-weighted ones. The largest stocks in both indices are Apple, Microsoft, Google, Amazon, Nvidia, Meta, and Tesla.
On Friday, the equal-weighted indices out-performed, the weighted ones signaling an expansion in stocks that participated in the advance.
The market video below shows this broadening across multiple sectors, including the speculative small-cap Russell 2000 index.
Institutions are moving some money from the winners and putting to work into the laggards, setting up "Catch-Up" trades.
Based on last week's price, action should be at least a two-week window for the markets to rally into the Fed announcement on Wednesday, June 14th, and the options expiration on Friday, June 16th.
S&P Sector ETFs – Sorted by Weekly Percent Change
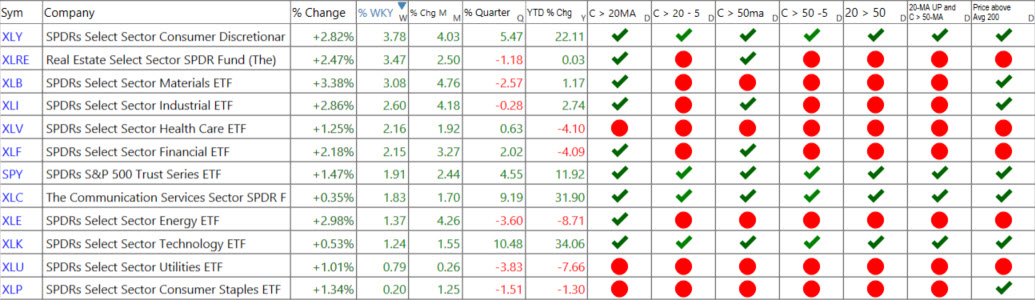
The percent changes tell you which sectors were the strongest or weakest on Friday and for the week, month, quarter, and year.
There are seven columns after the percent changes in the sector list above.
You can see the ETFs that are the strongest getting stronger or weakening.
- Close above or below the 20-MA.
- Close above or below the 20-MA 5 Days Ago. C>20 -5
- Close above or below the 50-MA.
- Close above or below the 50-MA 5 Days Ago. C>50 -5
- 20-MA above or below the 50-MA.
- 20-MA is pointed up, and the close is above the 50-MA.
- Close above or below the 200-MA
The top performer last week was the Consumer Discretionary sector. Last week's letter mentioned, "The bull case for this market needs this ETF to clear the last two weeks' highs and move up. The ETF letter is long Consumer Discretionary from a lower price."
The sector did break out, and it has room to move higher.
The Real Estate sector ETF got a reprieve as interest rates pulled back, and while it could advance, it's not a high probability pattern.
The Materials ETF was the third-best performer, another bullish market sign. This sector has been erratic all year, so continuation higher will be bullish.
The Financials also participated higher on Friday. They are at the recent Pivot high resistance, and how they react to that resistance will be telling.
The Technology ETF -- leading the advance this year -- underperformed last week but was still positive.
S&P Sector ETFs – Weekly Charts

To see larger charts, right-click and then choose – Open in new tab.
I will review all these charts and more sectors in the Market Update video below.
Most of them are not attractive on the weekly timeframe, but they all closed green last week.
The ones that needed to clear resistance did so, and the ones that needed to hold support also held and reversed.
Where Are the Markets Headed This Week?
The expansion in breadth and move up in the S&P 500, Russell 2000, Transports, and other sectors suggest those markets can move higher.
Undoubtedly, institutions are "all in" and ready to buy any dip.
The internal breadth gauge moved up to an initial extreme which is not a concern now because that occurred from a negative extreme immediately.
We previously mentioned that sentiment increased and pushed into an initial extreme last week.
With both internal gauges moving to the initial bearish extreme, however, we still believe there is an opportunity for the markets to advance into the Fed announcement and options expiration in two weeks.
Of course, that doesn't mean a straight upward movement. This market will turn on a dime, but last week's price action signals higher until proven otherwise.
Balancing the bullish sentiment is that the Volatility Index has not been this low since October 2021. It stayed low then, and the market advanced for several weeks before the market declined and volatility increased.
DOW JONES
To see larger charts, right-click and then choose – Open in new tab.
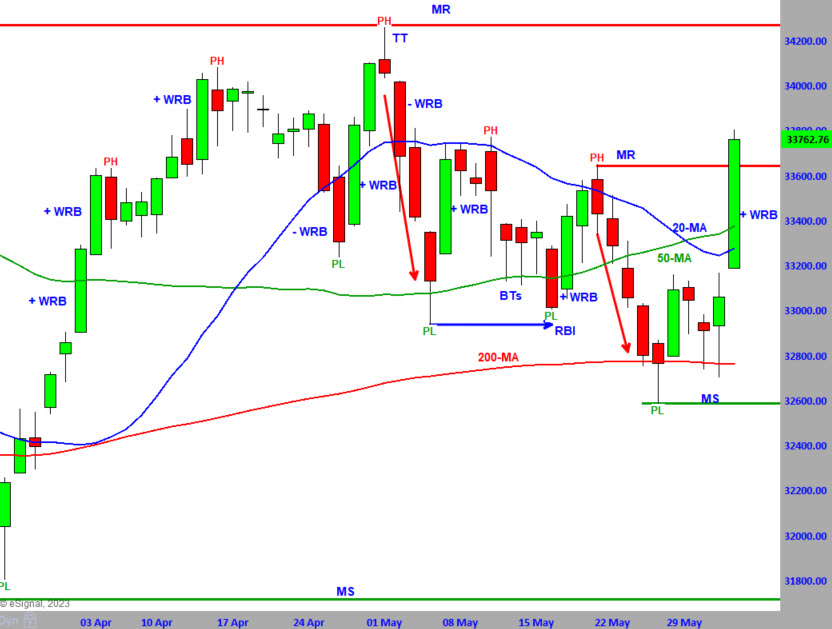
Above is the Dow Jones Industrial Average chart review for monthly MTS education and information.
Last week we expected the Dow to make the typical move to a lower low and the distance between the lows shorter. A shorter distance between lows signals slowing momentum that could result in an advance.
Patterns don't always form the same, and last week's news created an explosive move higher in the Dow.
Friday's range from low to high was over 700 points and cleared multiple days' highs. The last time this occurred was on January 6, 2023, and prices advanced sharply over the next several days.
The advance cleared and closed above the Major Resistance (MR) Pivot, creating a higher level of Major Support (MS) below.
Barring a complete retracement of Friday's bullish Wide Range Bar (+WRB), prices should advance to the MR area and slightly above.
The area of 34,200 will be significant price resistance.
The area of 33,300 - 33,500 should be where buyers are willing to step in.
VIDEO REVIEW OF MARKETS AND INTERNALS - Click lower right to open Full Screen
[s3mm type="video" s3bucket="mastertrader2" s3region="us-east-1" files="greg-2023/MarketUpdate_6_5_23.mp4" source="cloudfront" /]
NEW STOCK TRADING IDEAS and Open Trade Video Update Below

Join a Master Trader Membership Deal - Top-Down Approach to the Markets Course, Nine Months of WEEKLY LESSONS, The Months of the Advisory Swing and Options Letter, Three Months of the Weekly Options Letter, LIFETIME Live Monthly Coaching, and SCANS
NOTE: Please see the document in RESOURCES entitled Master Trader Guidelines for Trading the Open and Gaps.
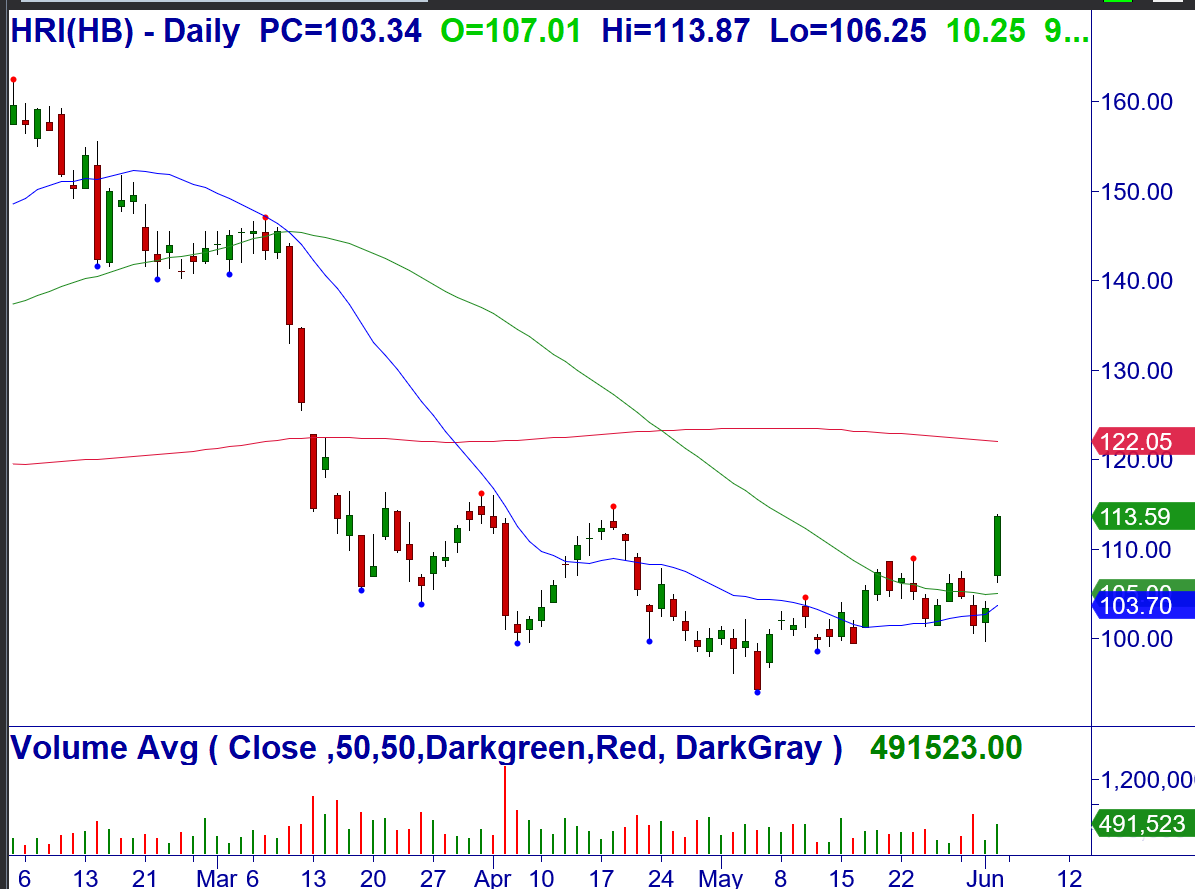
6/5: HRI – Over $113.87, consider buying the stock. +WRB Breakout of a bottoming pattern at the 20/50-MA. Stop $106.24.
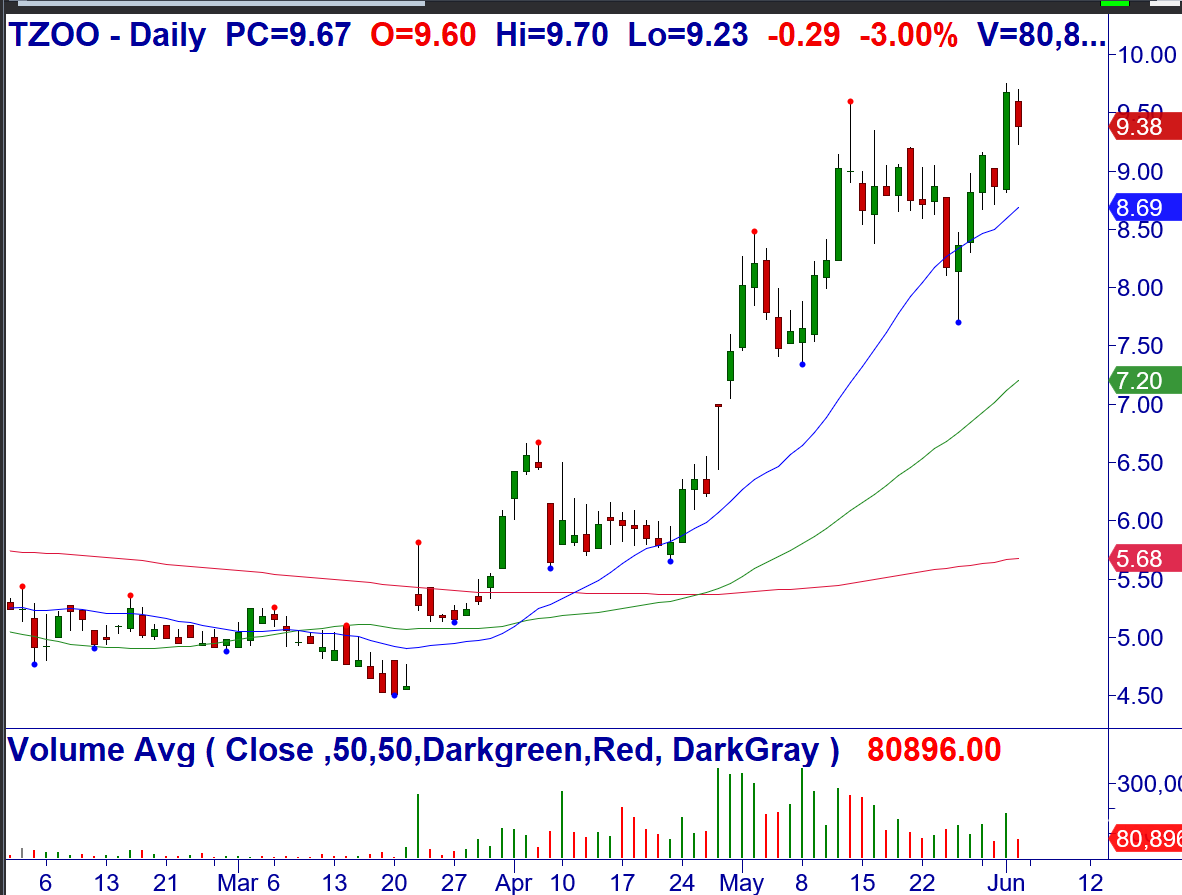
6/5: TZOO – Over $9.75, consider buying the stock. +123 Continuation at the 20-MA. Stop $8.81.
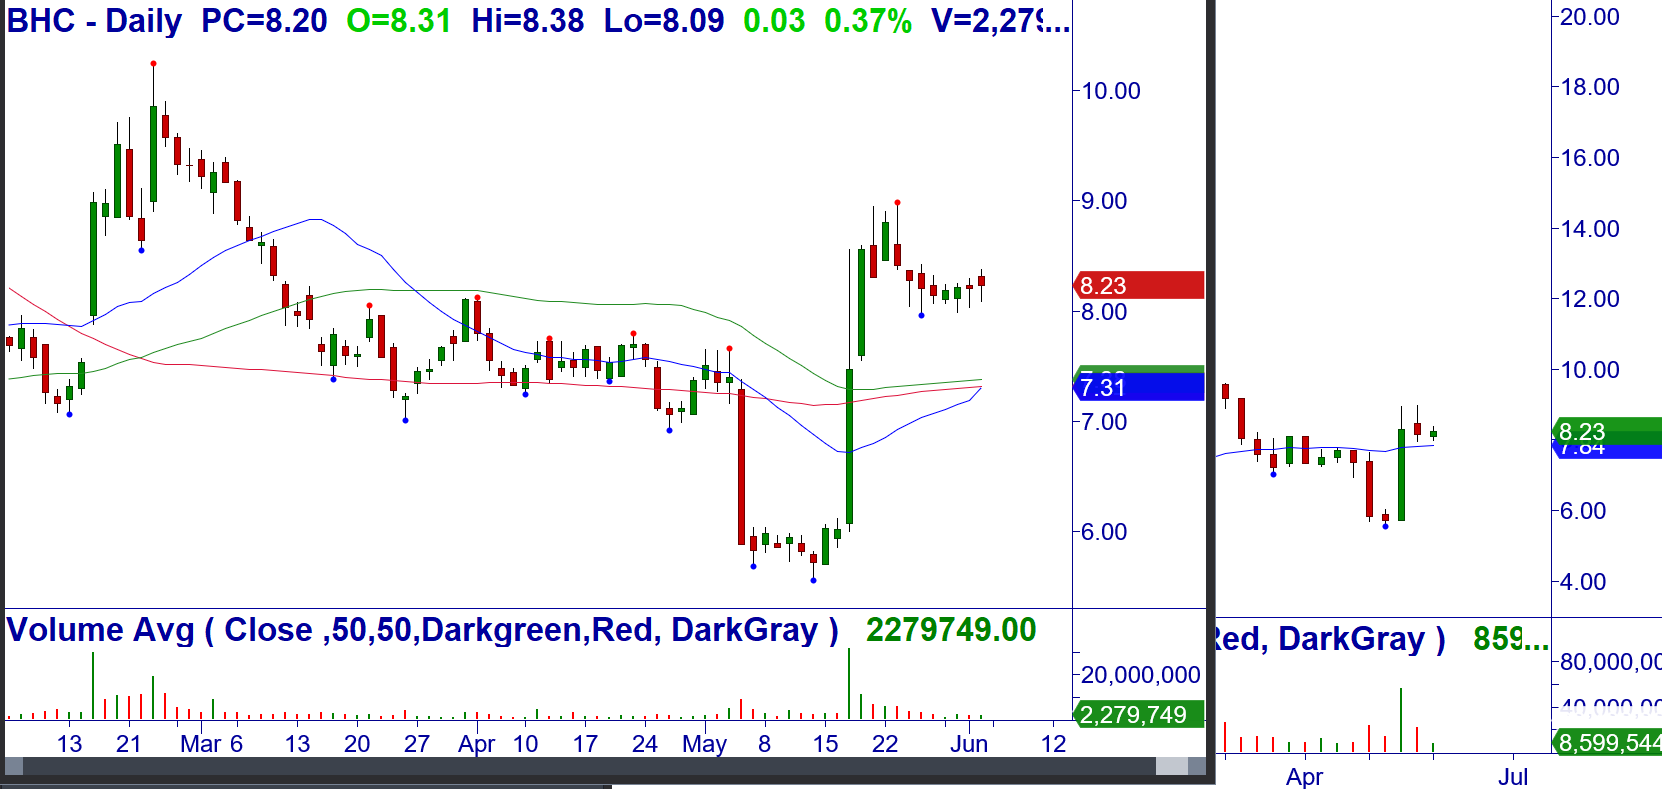
6/5: BHC – Over $8.38, consider buying the stock as a core long. Buy Setup and reversal, bullish +1234 weekly, Buy Setup after Breakout monthly. Earnings 8/8. Stop $7.31 (20-MA).
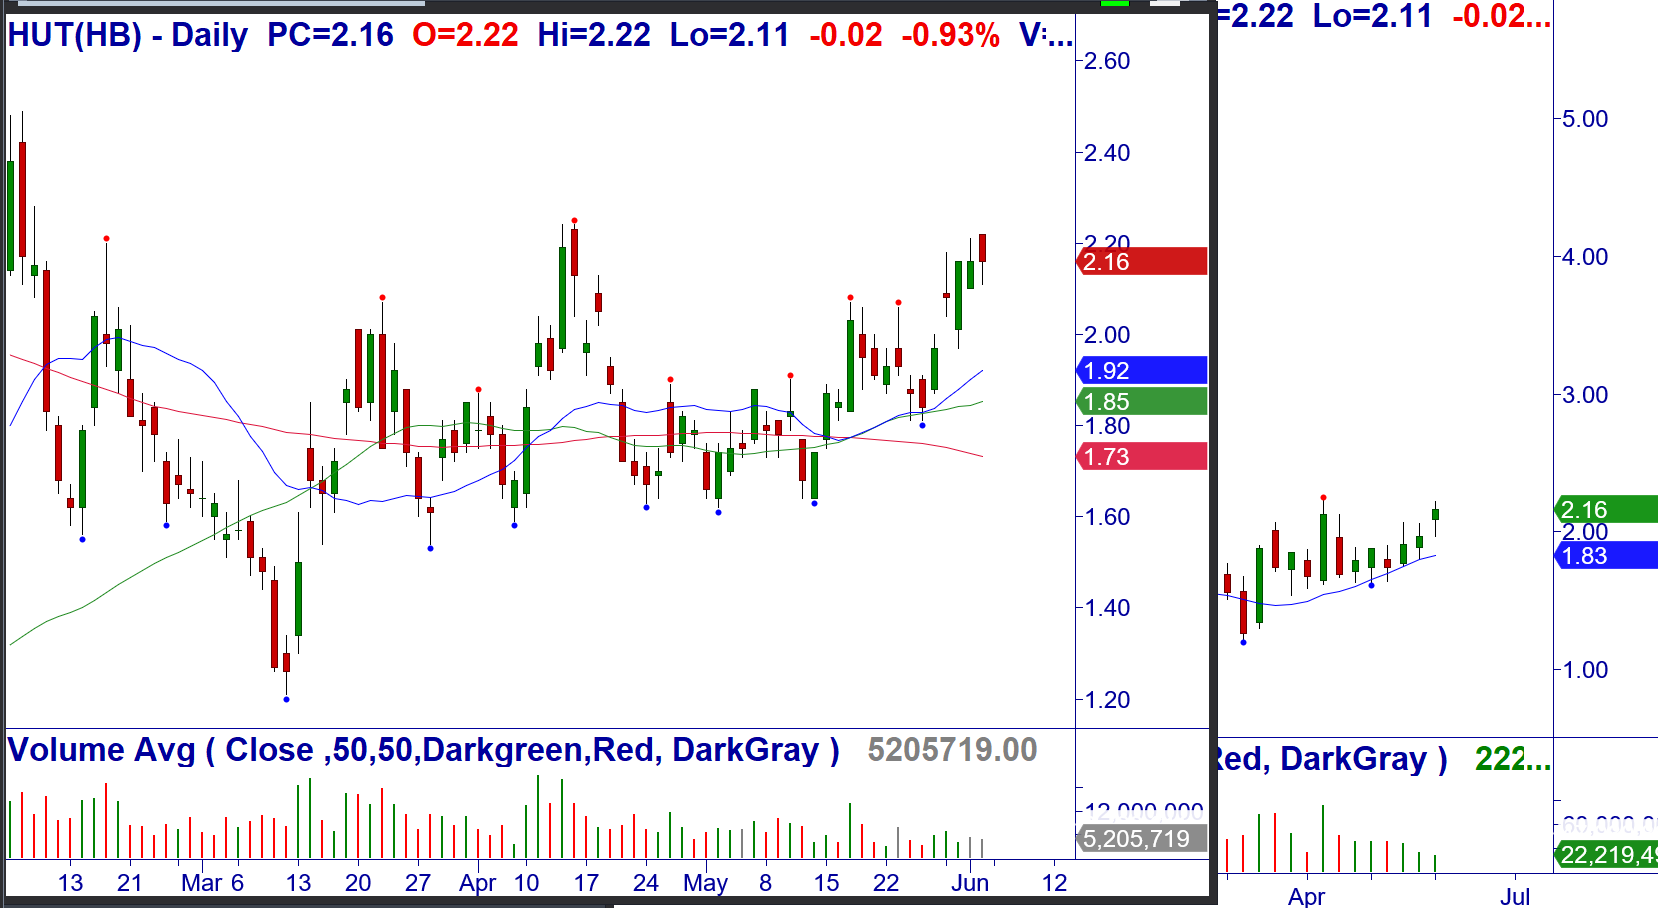
6/5: HUT – Over $2.22, consider buying a 1/3 position of the stock as a core long. Breakout all time frames. Earnings 8/10. Stop $1.80.
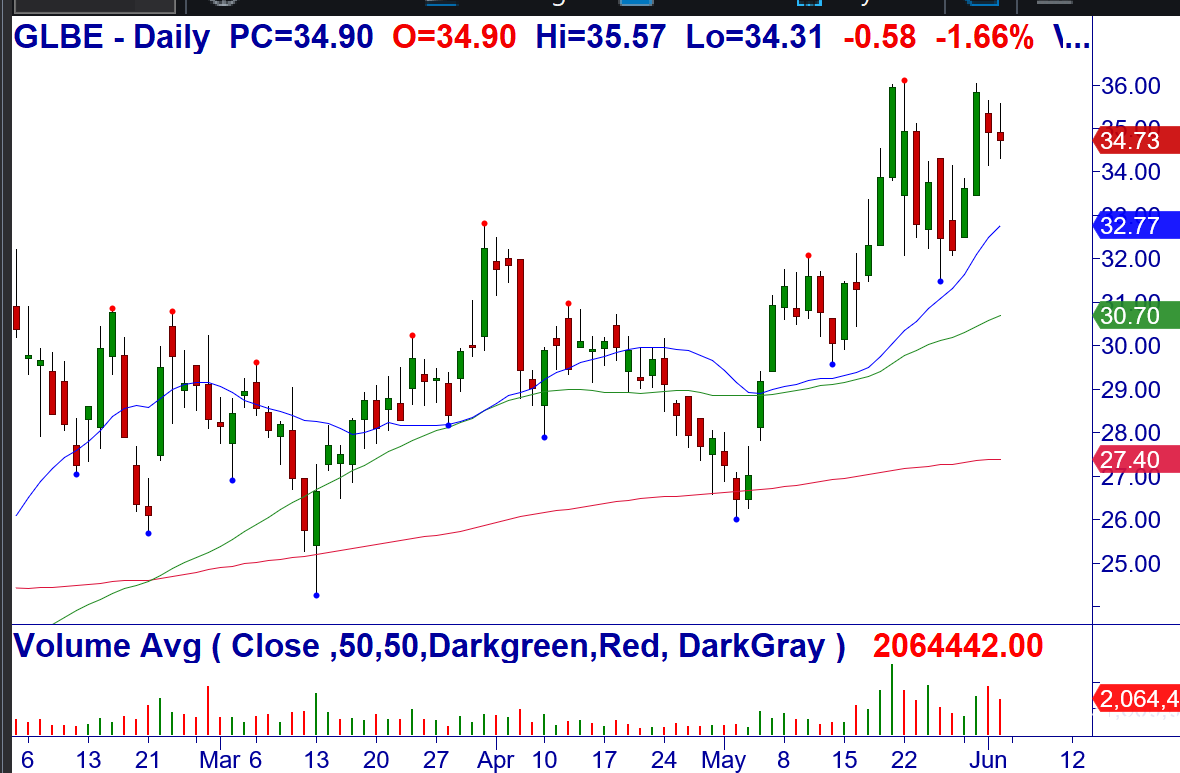
6/5: GLBE – Over $35.57, consider buying a 1/3 position of the stock as a core long. +123 Breakout, Bear Sandwich +WRB Breakout monthly. Earnings 8/15. Stop $31.49.
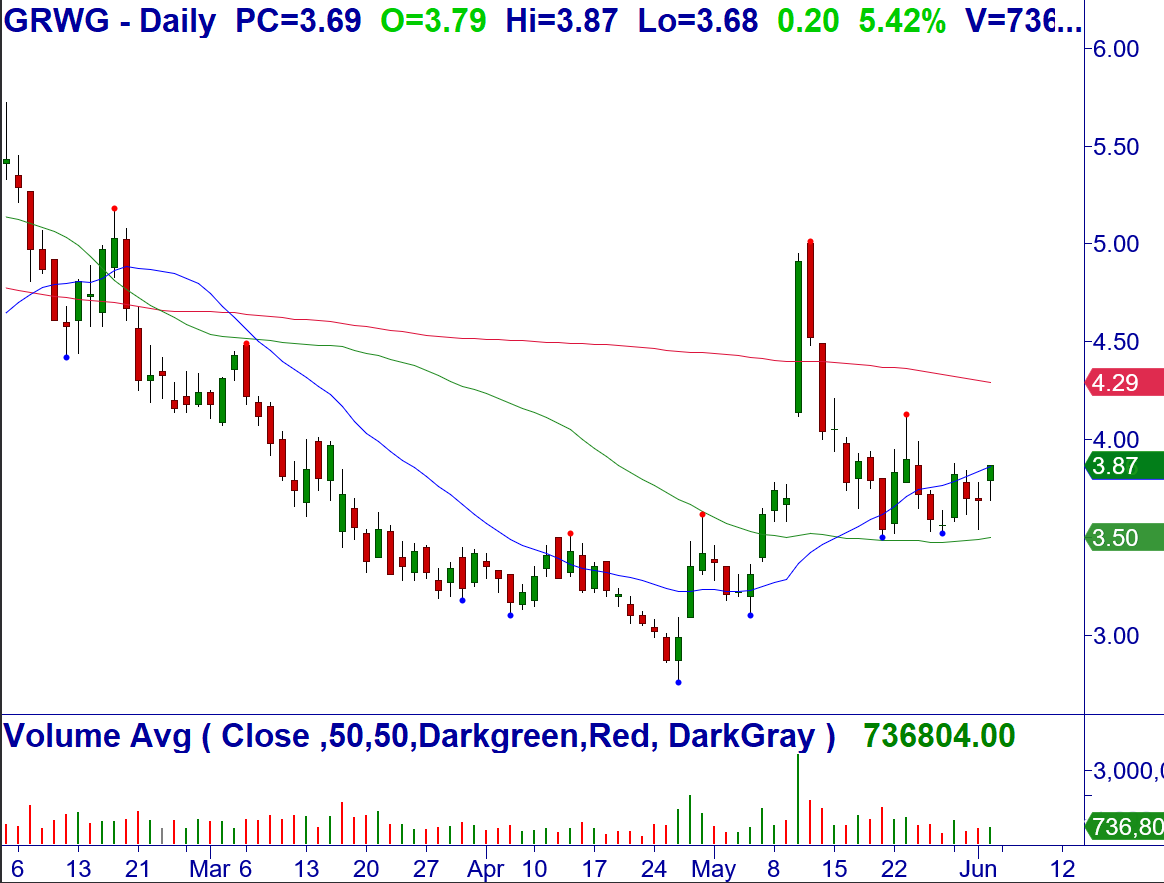
6/5: GRWG – Over $3.87, consider buying the stock. Breakout of a bottoming pattern at the 20/50-MA. Stop $3.53.
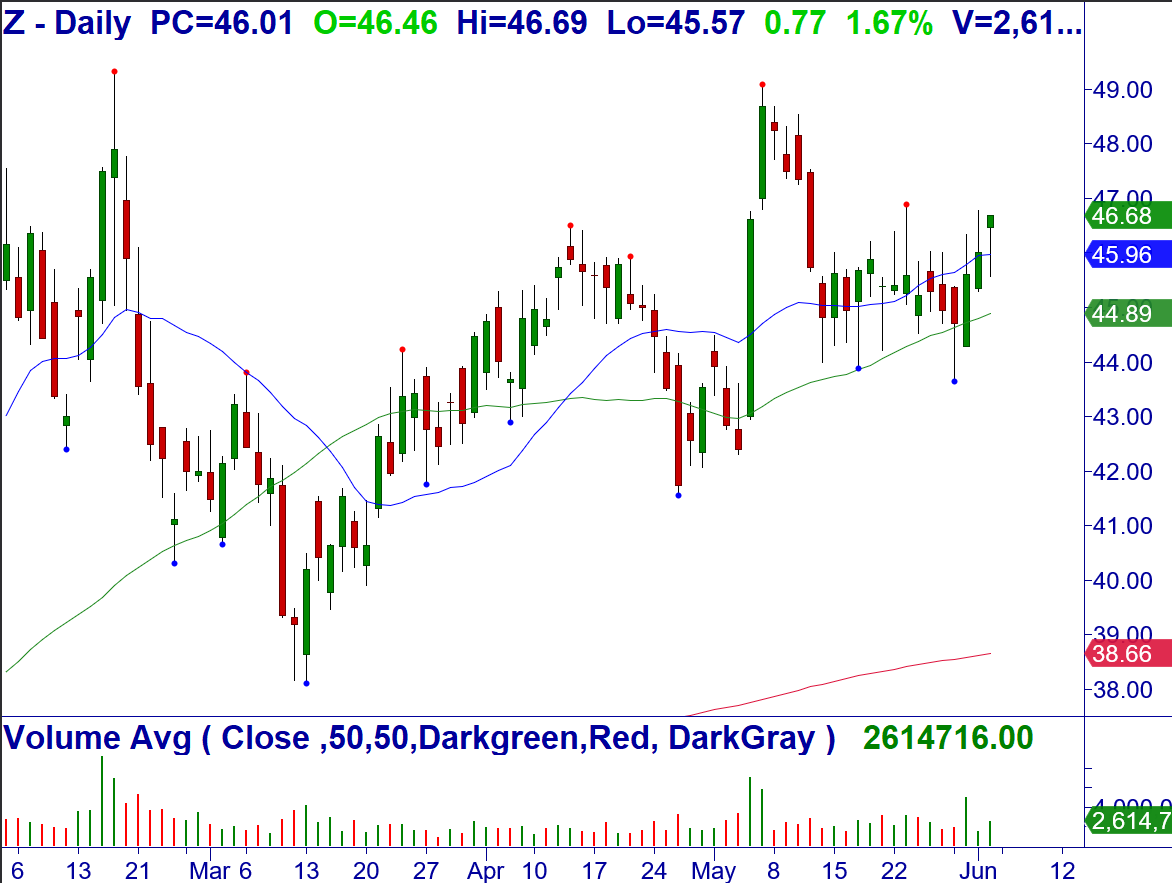
6/5: Z – Over $46.77, consider buying a 1/3 position of the stock as a core long. Breakout all time frames. Earnings 8/3. Stop $43.64.
6/5: BHC – Over $8.38, consider buying the stock as a core long. Buy Setup and reversal, bullish +1234 weekly, Buy Setup after Breakout monthly. Earnings 8/8. Stop $7.31 (20-MA).
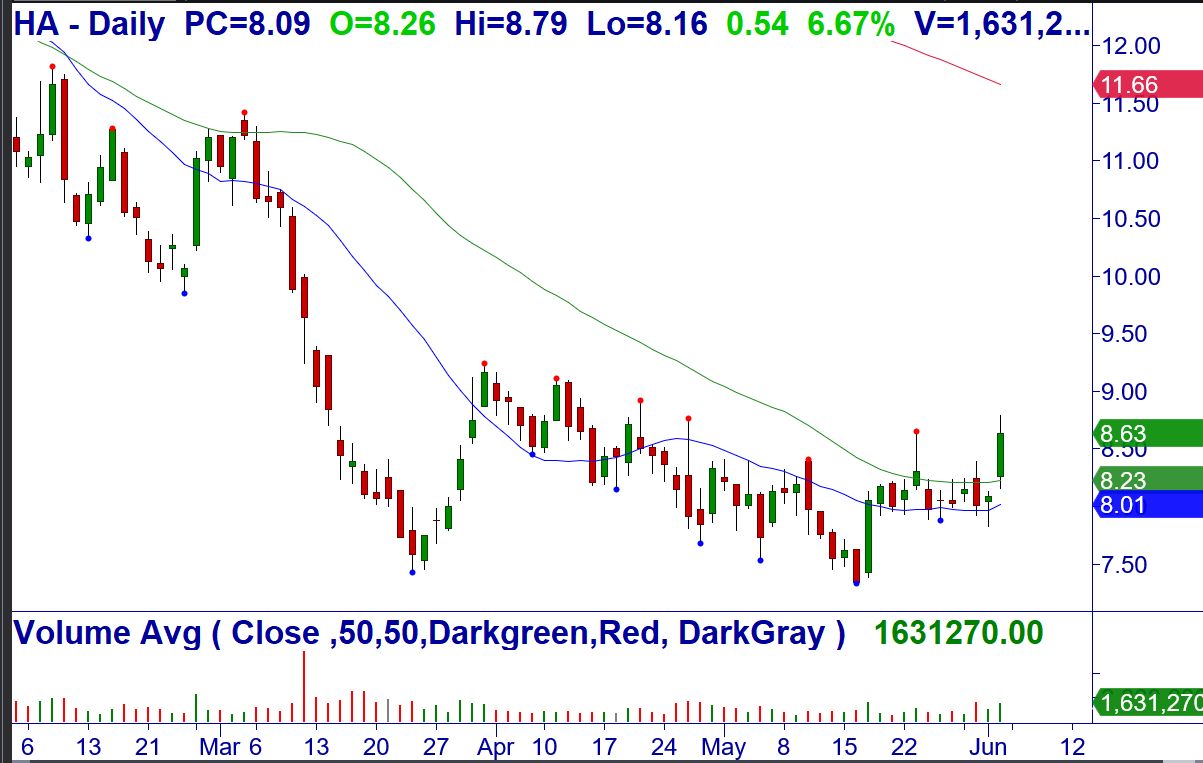
6/5: HA – Over $8.79, consider buying the stock. Breakout of a bottoming pattern at the 20/50-MA. Stop $7.98.
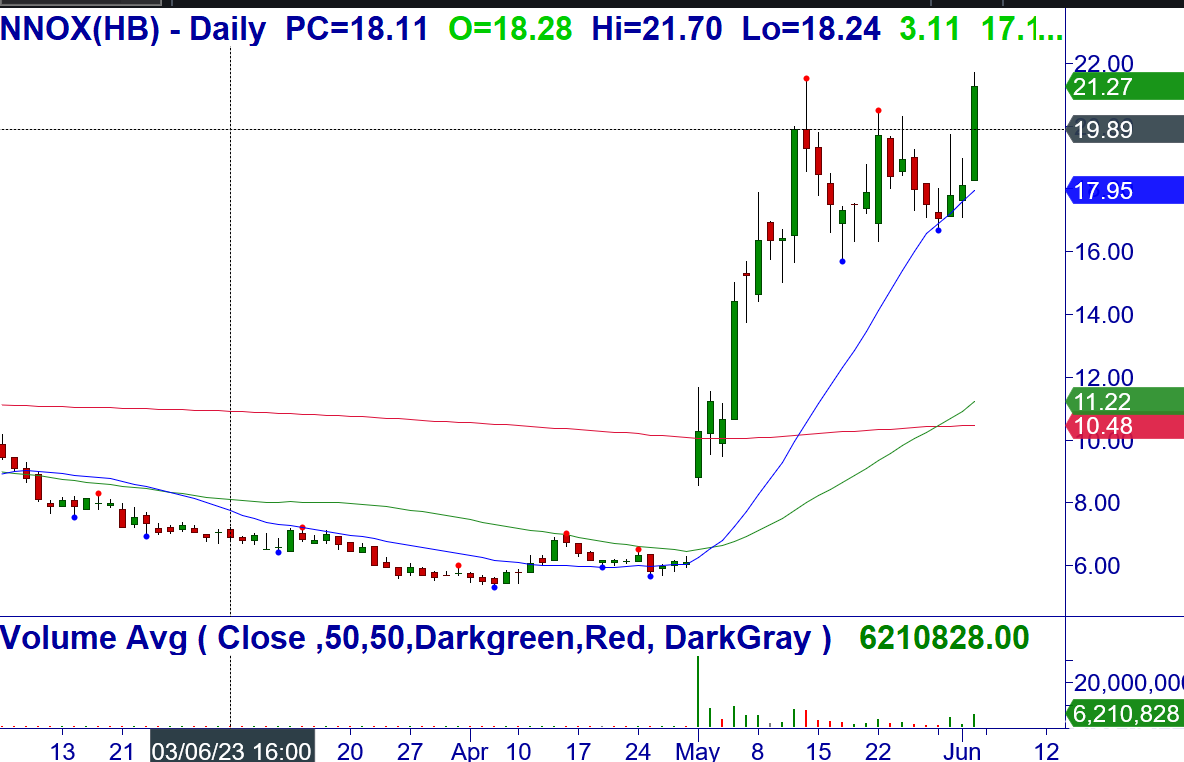
6/5: NNOX – Over $21.27 (closing price), consider buying a 1/3 position of the stock as a core long. Breakout all time frames. Earnings 8/15. Stop $15.69.
Money Management for Trading and Investing
Proper money management for investing and Trading starts with position-sizing based on the amount of money you are willing to risk on a signal trade.
CLICK HERE to review these Master Trader Guidelines and Basic Money Management and Position Sizing Table.
NEW OPTIONS TRADING IDEAS and Video Update Below
Directional Options Strategies and Debit Spreads for Swing and Day Trading Course
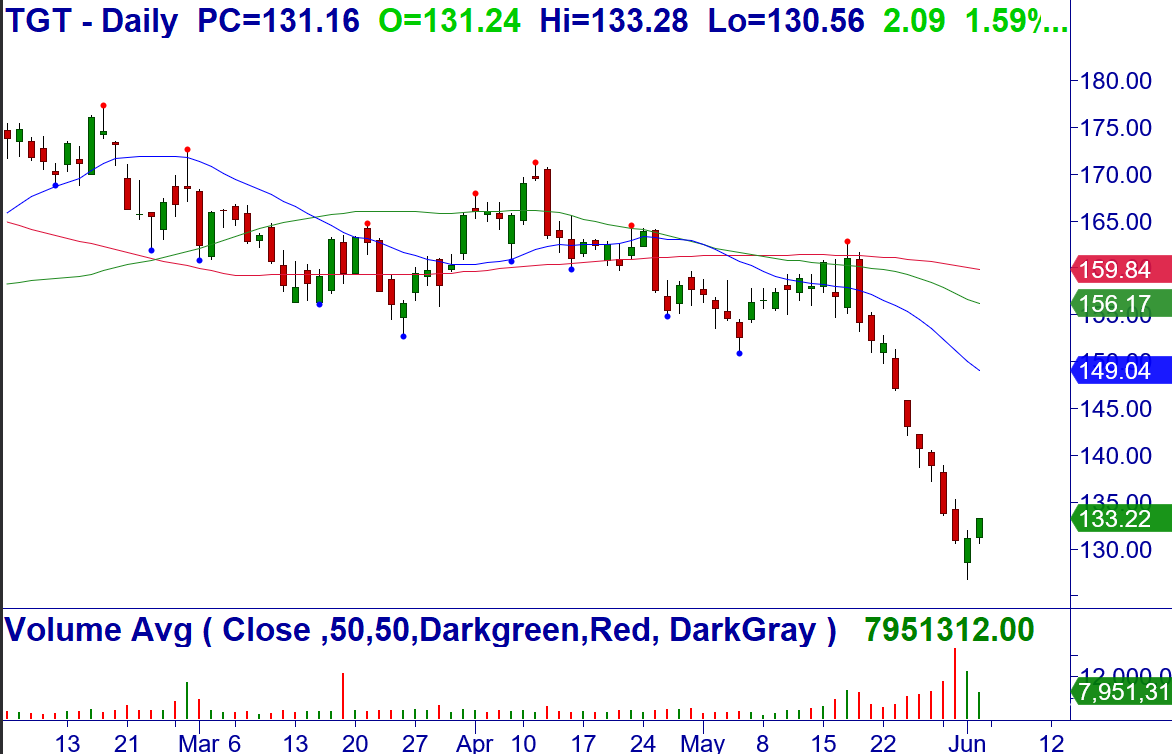
6/5: TGT – Over $133.28, consider buying Jun (6/16) $130/137 bull call debit spread for mid-point (closed at $3.52/share). Climactic Buy Setup and bullish reversal. Stop $128.18.
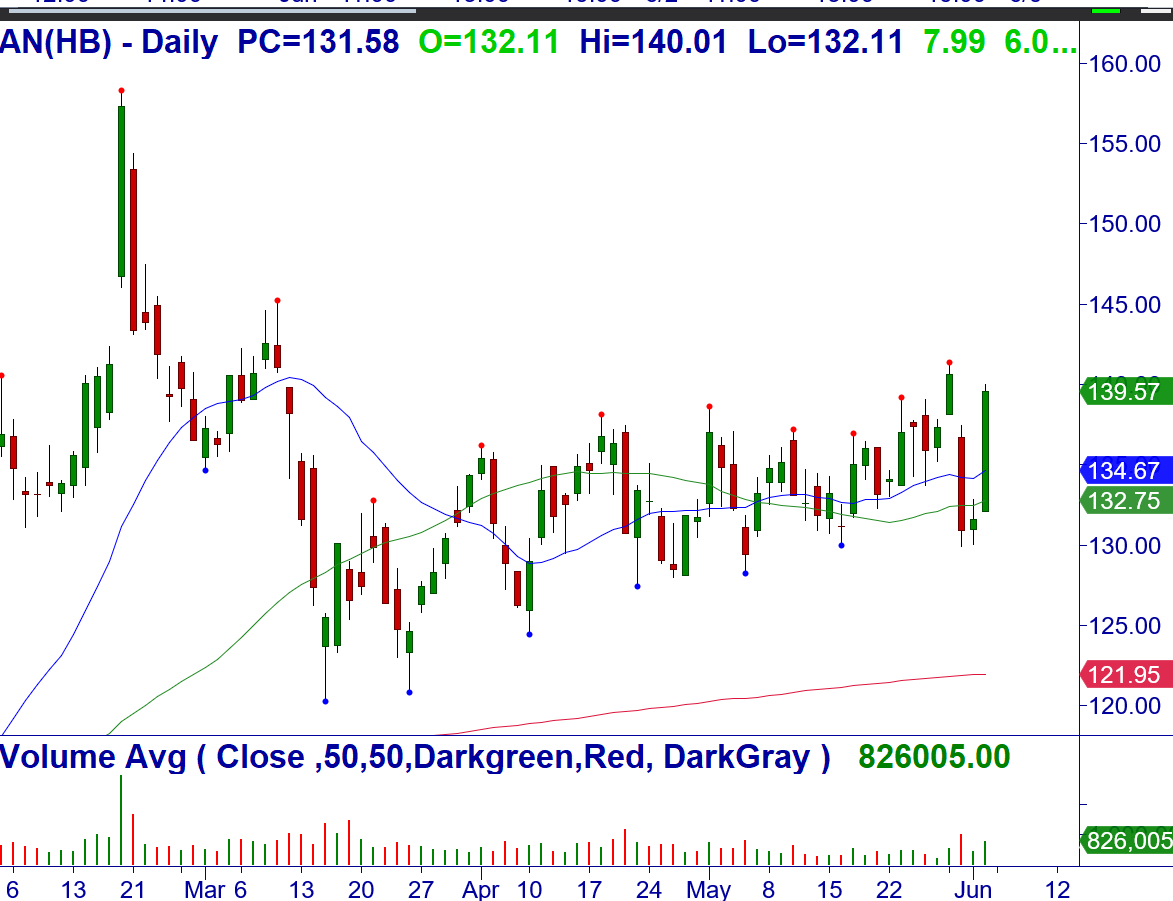
6/5: AN – Over $139.57 (closing price), consider shorting Jun (6/16) $130/120 bull put credit spread for a limit of $.70/share (closed at $.72/share). +WRB Igniting from a bullish consolidation above the 20/50-MA. Stop $129.98.
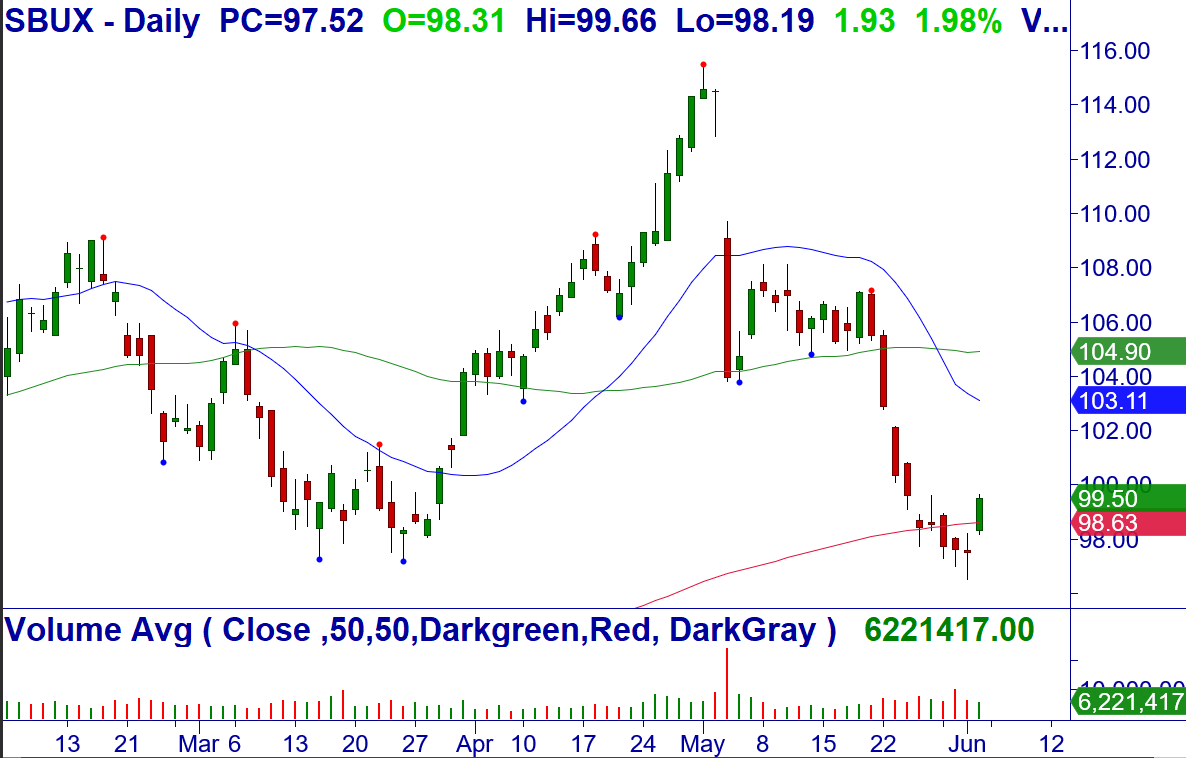
6/5: SBUX– Over $99.66, consider buying Jun (6/9) $97 calls for a limit of $2.90/share (closed at $2.85/share). Climactic Buy Setup and bullish reversal at the 200-MA. Stop $97.37.
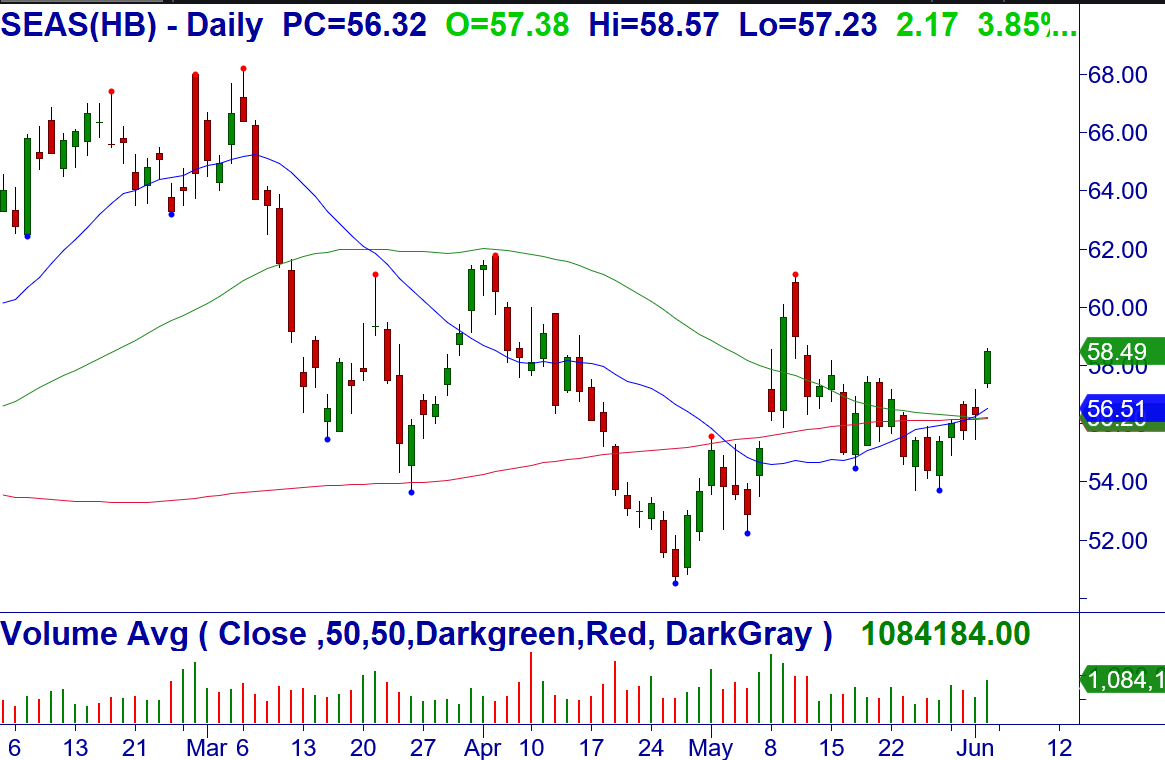
6/5: SEAS – Over $58.57, consider shorting Jun (6/16) $55 puts for a limit of $.50/share (closed at $.52/share). +WRB Igniting from a bullish consolidation at the 20/50/200-MA. Stop $55.48.
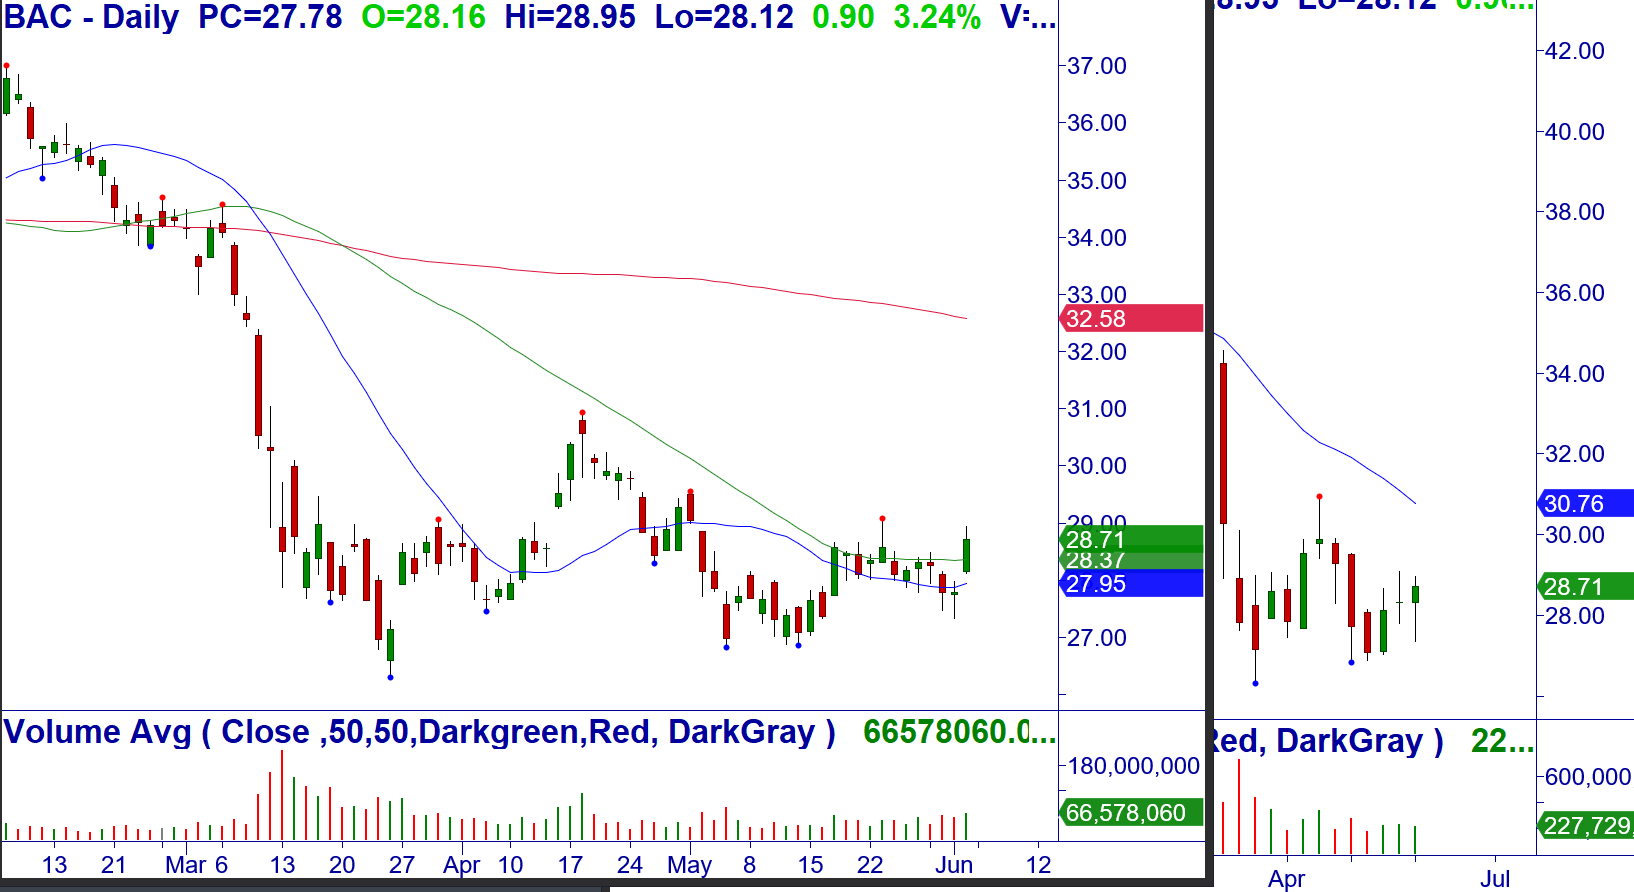
6/5: BAC– Over $28.95, consider buying Jun (6/16) $27.5 calls for mid-point (closed at $1.44/share). Breakout of a bottoming pattern at the 20/50-MA, W-Bottom weekly, sector Breakout. Stop $27.47.
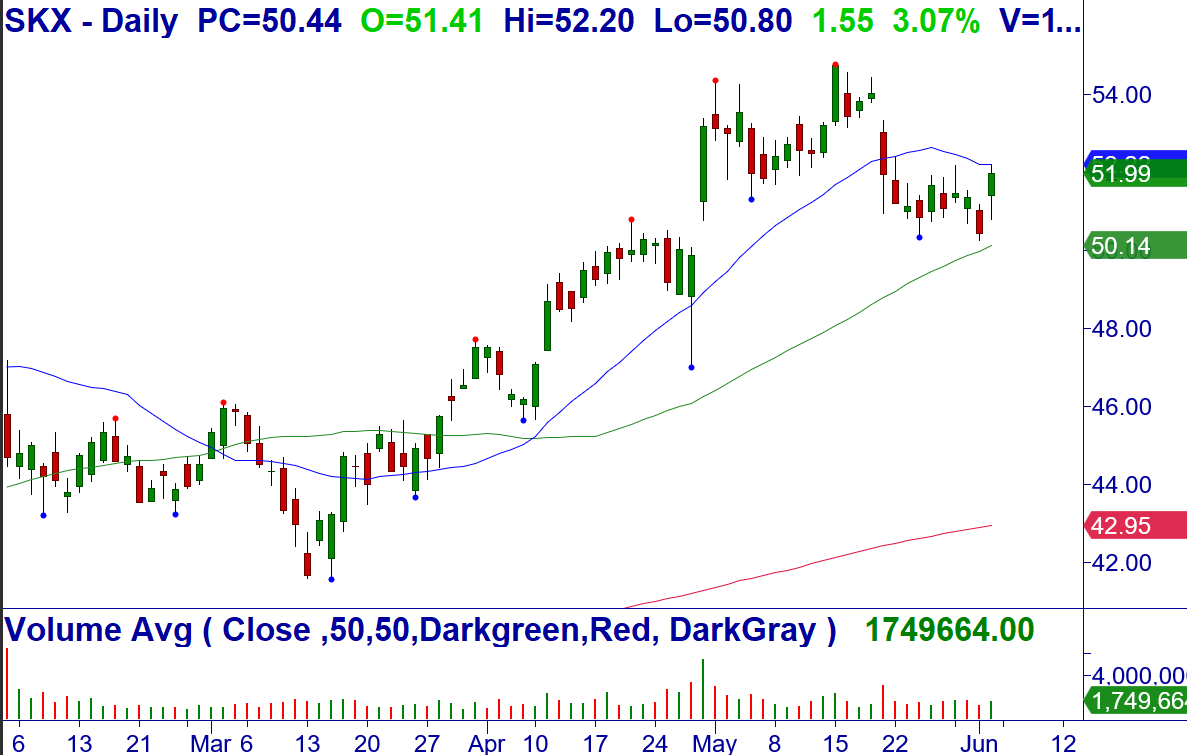
6/5: SKX – Over $52.20, consider shorting Jun (6/16) $50 puts for a limit of $.50/share (closed at $.50/share). Breakout after Downside Shakeout at the 50-MA. Stop $50.18.

VIDEO ON OPEN TRADES AND ADJUSTMENTS (Note: Also see the Open/Closed trade sheet in Member area
[s3mm type="video" s3bucket="mastertrader2" s3region="us-east-1" files="dans-video/advisory_230603.mp4" source="cloudfront" /]
Because your success is vital to you – and us.
Before selling options or credit spreads, we urge you to review the valuable and detailed information that we have provided for you in your Member’s Area Resources.
A quick simplified approach to calculating contract size is to simply base your contract size based on the number of shares permitted in your Trading Plan as if you were trading the stock or ETF. Simple Share Sizing = $ Risk / Stop Loss

The amount of money that you are willing to risk – divided by – the stop loss amount. For example, $100 / .20 = 500 shares. Credit Spread example, if your Trading Plan allowed you to trade 543 shares of AAPL based on the stop loss, then simply round down to the nearest hundred and short an equivalent number of contracts of the option. Since 1 contract represents 100 shares of the underlying, this would be five (5) contracts.
Master Trader and You Building Your Financial Future Together!
Happy trading! If you have any questions or comments, please e-mail Greg Capra at Greg@mastertrader.com or Dan Gibby at Dan@mastertrader.com
All the best,
Greg Capra Managing Director of Master Trader
Dan Gibby Chief Options Strategist
NOTE: Master Trader will show the opening and closing prices of all stock and options trades. We recommend that all traders and investors use proper share sizing for positions and money management. However, we cannot recommend what that is for your particular trading style, risk tolerance, or account balance. We urge you to calculate your own share/position size based on your individualized risk parameters, Trading Plan, and familiarity with the proposed trade strategy and risk. Advanced Management Strategies (AMS) covers in detail foundation and advanced position and money management.
NOTE: Master Trader and its representatives may have existing positions in actual or other trade recommendations before or after suggested herein. Additionally, we may manage them differently for internal purposes based on different risk parameters than noted herein. All trade ideas and content are for informational and educational purposes only. It is not, nor is it intended to be, trading or investment advice or a recommendation that any security, option, or investment strategy is suitable for any person. Trading securities can involve high risk and the loss of any funds. Significant gaps or volatility can increase these losses, particularly for short option strategies. Investment or trading information provided may not be appropriate for all investors, and is provided without respect to individual financial sophistication, financial situation, investing time horizon or risk tolerance. Supporting documentation for any claims (including claims made on behalf of options programs), comparison, statistics, or other technical data, if applicable, will be supplied upon request. Master Trader Consulting, Inc. is not a licensed financial advisor, registered investment advisor, or a registered broker-dealer. Options, futures, and futures options are not suitable for all investors.