How Master Trader Technical Strategies Builds a High-Probability Thought Process
Most traders look at a chart and ask one question:
“Is this stock going up or down?”
That question is too simplistic.
More...
A professional thought process asks something very different:
How many objective technical concepts are aligned, where should buyers or sellers act, what would confirm the analysis, and how will risk be managed if the expectation is wrong?
That is the purpose of Master Trader Technical Strategies.
MTS provides a checklist for evaluating the quality of a trade setup. The greater the number of concepts aligned in the same direction, the stronger the probability that the trade will work as anticipated.
Cincinnati Financial Corporation (CINF) provides an excellent example of how several MTS concepts can be combined to develop an objective bullish bias—without relying on predictions, opinions, or an endless collection of indicators.
From Uncertainty to Institutional Buying
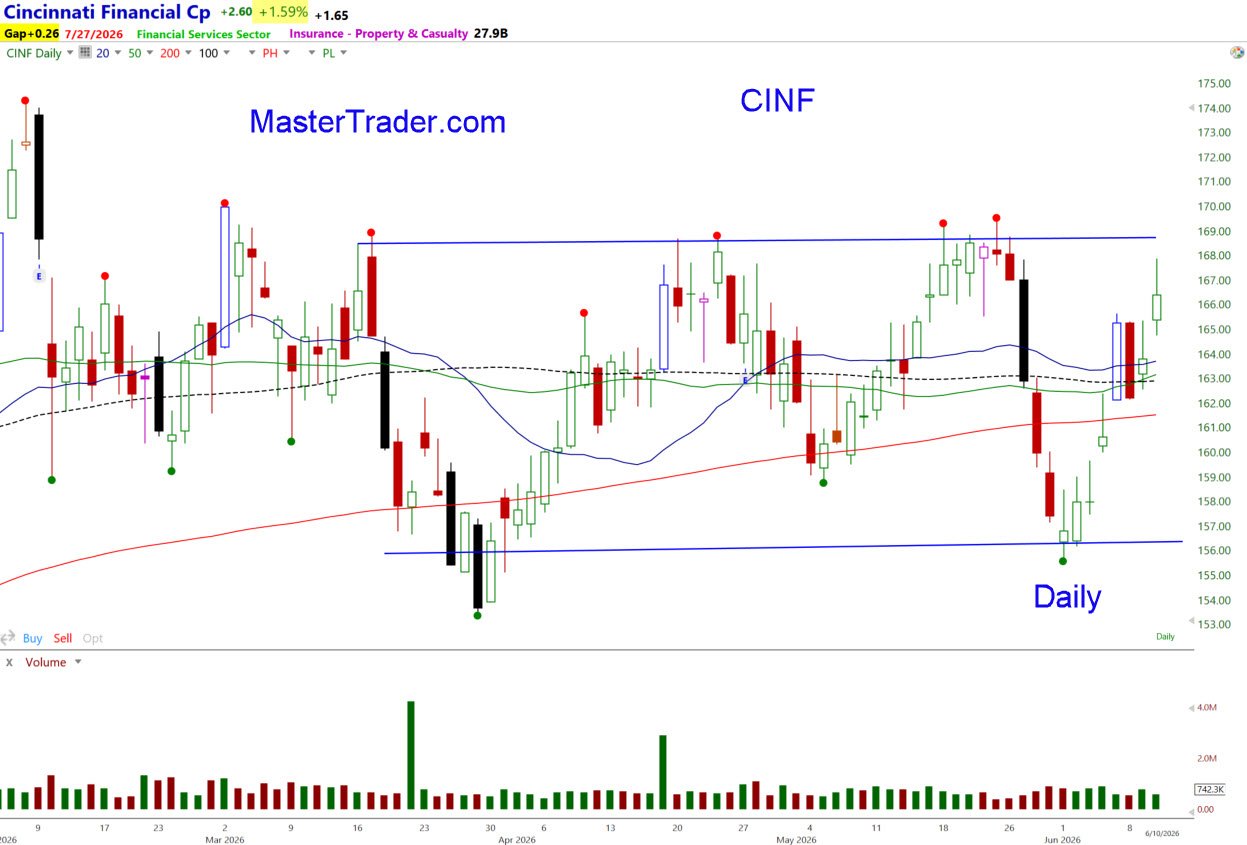
From March through early June, CINF traded within a wide consolidation formed by a series of swing highs and swing lows.
A trading range represents uncertainty. Buyers and sellers are active, but neither side has enough conviction to establish control.
During this period, the four moving averages intersected through the middle of prices. The moving averages were not aligned or consistently sloping in one direction, visually confirming that CINF was trendless and erratic.
Master Trader Tip
Moving averages are subjective reference points rather than automatic buy-and-sell signals. However, they are valuable visual aids for identifying:
- Trend or the lack of trend
- Indecision versus certainty
- Potential support and resistance
- Multiple timeframe alignment
- Changes in momentum
In mid-June, that uncertainty ended. See Below.
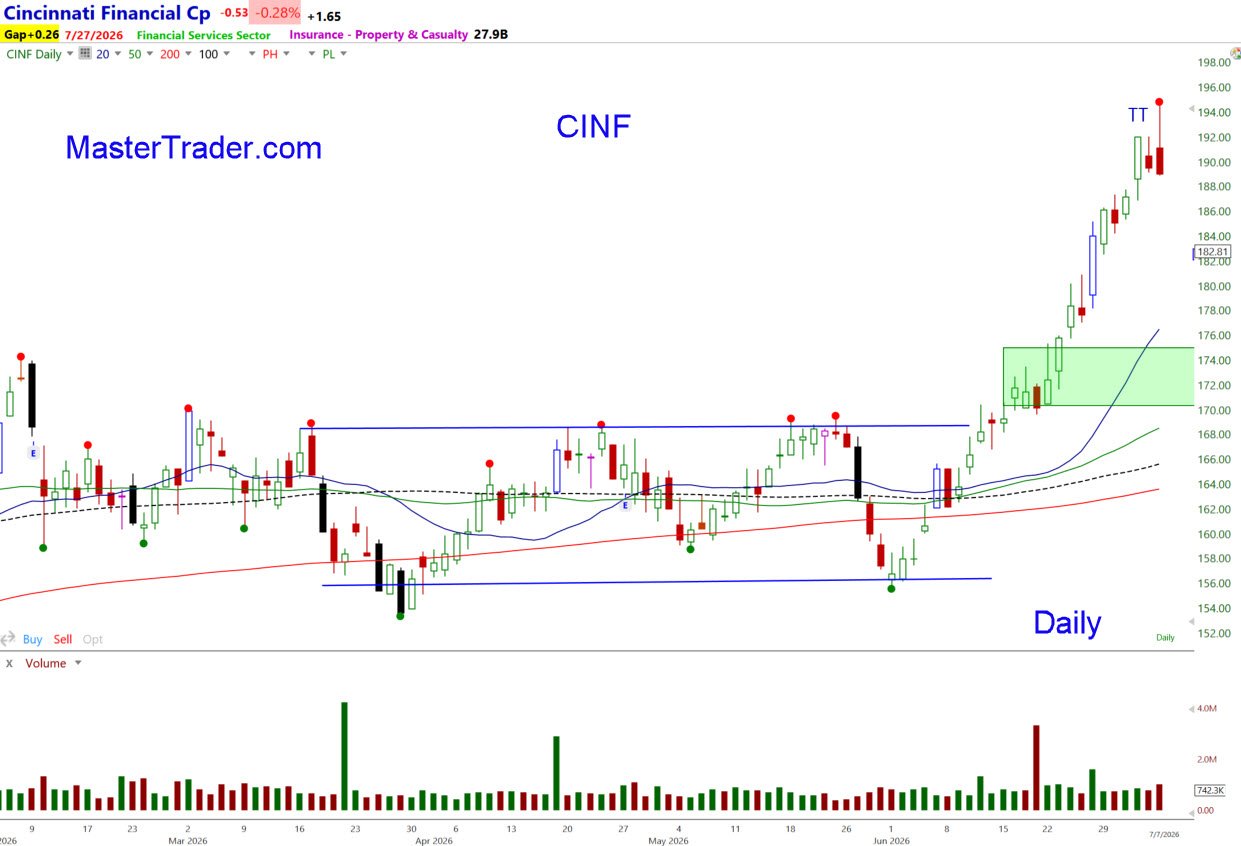
CINF broke decisively above the trading range and began a powerful Bar-by-Bar advance, during which prices did not trade below a prior bar’s low.
That type of persistent momentum indicates aggressive institutional buying. Institutions were no longer waiting inside the trading range attempting to buy at lower prices. They were willing to compete for available shares and pay increasingly higher prices.
Too Far, Too Fast
The advance was impressive, but it also created a new problem.
Prices moved so quickly that they became extended from meaningful price support. The rapid advance left a Price Void below—a price area containing little consolidation or support that could slow a future decline.
At the top of the move, CINF formed a Topping Tail, or TT.
The candle had initially been green before sellers took control and pushed prices well below the high. That reversal told us that the buying momentum had become temporarily exhausted.
From the bottom of the prior trading range to the Topping Tail, CINF had advanced approximately 25% in only a few weeks.
The stock had not necessarily become bearish. However, it had moved too far, too fast, making profit-taking and a corrective move increasingly likely.
An investor who remained bullish longer term but believed CINF was short-term extended might have considered selling covered calls against the position. That strategy can generate option premium and reduce the effective cost of holding the shares while prices consolidate or correct.
Where Should Buyers Return?
Strong trends can correct in two ways.
They can correct through time, with prices moving sideways while the moving averages catch up.
Or they can correct through price, with prices declining toward an area where buyers previously demonstrated demand.
CINF corrected through price in a sharp vertical move lower.
Vertical advances and declines usually leave little support behind. However, CINF had previously paused for several bars within the green highlighted area on the chart. That consolidation created a potential support zone where buyers could reasonably be expected to reappear.
Expected does not mean guaranteed.
No methodology can know the future. What MTS provides is a structured belief system based on historically reliable price concepts. We identify where buyers should appear and then wait for the price action to confirm whether that belief is becoming reality.
That is why the modules within our MTS courses are called Thought-Building Lessons.
The goal is not to memorize patterns. The goal is to understand the forces behind them.
The Moving Averages Confirm the Trend
Following the advance, the moving averages became widely separated, stacked and sloping upward.
Bullishly stacked moving averages occur when:
- The shorter-term moving averages are above the intermediate-term averages
- The intermediate-term averages are above the longer-term averages
- The moving averages are sloping higher
This alignment is a visual representation of strength and trend certainty.
As CINF declined, prices approached both the prior consolidation area and the rising 50-period simple moving average.
This created an important technical test.
If the larger bullish trend remained intact, institutions should begin buying again near those areas.
Confirmation Through Price Action
Support alone is not a reason to buy.
Prices can break through support, just as they can reverse from it. The next step is to evaluate how prices behave after reaching the area.
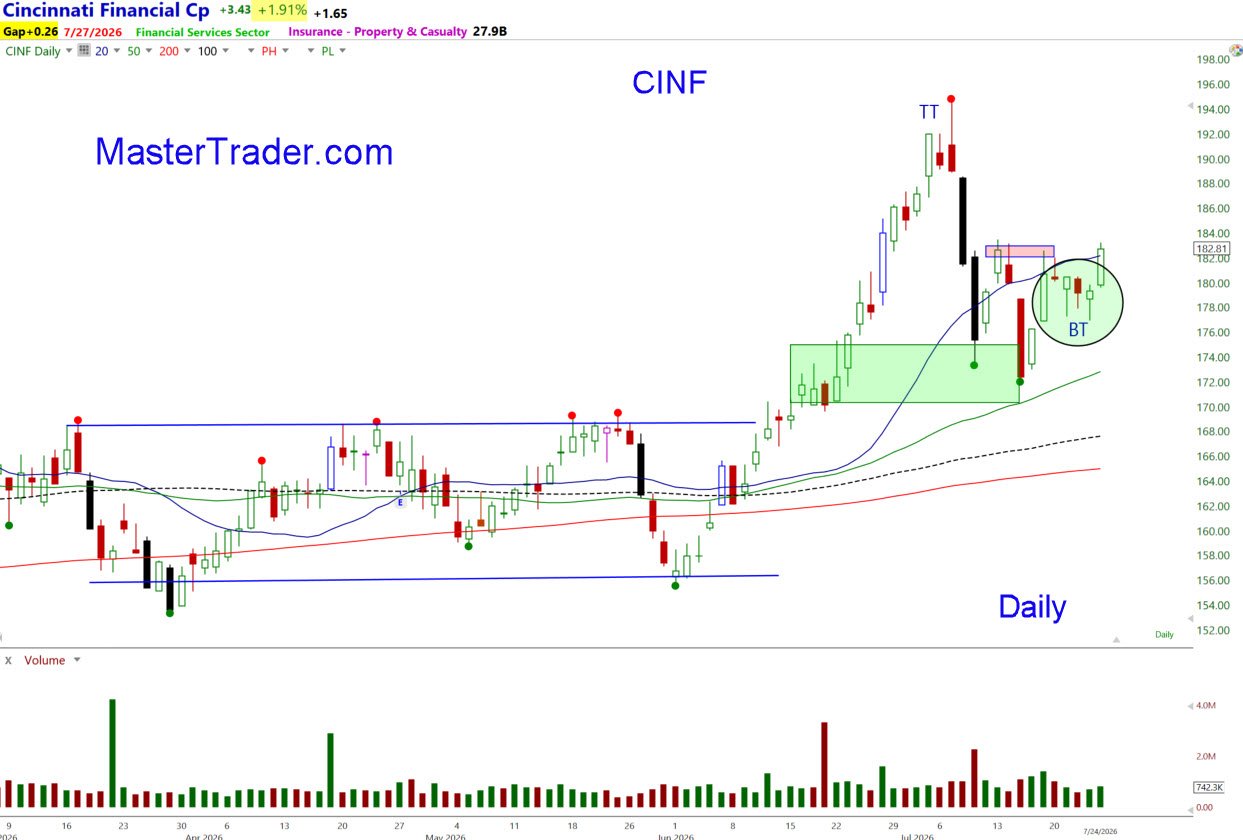
CINF declined with wide-range, overlapping and erratic candles. That price action reflected uncertainty and aggressive selling.
Prices then rebounded sharply from near the rising 50-SMA and retraced a significant portion of the prior decline.
More importantly, when CINF reached the expected reversal area, it did not collapse.
Instead, prices began moving sideways. The candle ranges contracted, the price action tightened, and several Bottoming Tail, or BT, candles formed.
Those Bottoming Tails showed that sellers were able to push prices lower intraday, but buyers repeatedly stepped in on the declines.
Master Trader Tip
Charts are pictures of traders’ beliefs created with money.
Opinions are easy to express. Buying and selling decisions reveal where market participants are willing to commit capital.
The tightening price action was particularly important. Loose, wide-range and erratic movement reflects uncertainty. Tight price action communicates that uncertainty is diminishing and that control may be shifting back toward buyers.
The final candle on the chart was a bullish wide-range bar that closed strongly, signaling that buyers remained active into the end of the trading session.
Taken together, the support area, rising moving averages, Bottoming Tails, tightening price action and bullish wide-range candle created the technical evidence that CINF was preparing for another potential move higher.
A Quality Setup Does Not Eliminate Risk
Even when the technical concepts align, traders must consider upcoming events that can disrupt normal price behavior.
The chart showed that CINF was scheduled to report earnings on Monday, July 27, 2026.
Earnings can accelerate an existing trend, create a large opening gap or invalidate an otherwise attractive technical setup.
That leaves traders with a decision.
A risk-averse trader may wait until after the earnings announcement before entering. Another trader may accept the event risk while reducing share size, using an options hedge or allowing for a wider stop based on the expected volatility.
There is no single correct choice for every trader.
The correct decision depends on your strategy, experience, risk tolerance and position-management plan.
What is not acceptable is entering without recognizing that the earnings announcement exists.
The Real Opportunity Is Learning How to Think
CINF is only one chart, but the thought process applies to virtually any stock, ETF, market or timeframe.
The opportunity does not come from finding a magical indicator or waiting for someone else to tell you what to buy.
It comes from learning how to objectively evaluate:
- Trend
- Support and resistance
- Momentum
- Price Voids
- Retracements
- Candlestick confirmation
- Tight versus loose price action
- Multiple timeframe alignment
- Position and money management
The financial markets will continue creating opportunities. The question is whether you will be prepared to recognize them, evaluate their quality and act with confidence when they appear.
Master Trader education is designed to help you become a self-reliant investor and trader—someone capable of building an objective analysis, managing risk and making decisions without depending on predictions, media opinions or indicator-based promises.
A single trade will not determine your financial future.
Developing a repeatable skill and a disciplined thought process can. Why Master Trader
Build an Edge You Can Use for a Lifetime
The Master Trader MTS courses and coaching programs teach you how to read price action, combine technical concepts and develop the professional thought process demonstrated in this analysis.
You will not simply learn what happened on the CINF chart.
You will learn how to recognize similar conditions for yourself—before the opportunity becomes obvious to everyone else.
Review the Master Trader course bundles and coaching programs at MasterTrader.com.
For help choosing the education that best matches your trading and financial goals, contact support@mastertrader.com.
If you have found this post helpful, Share it Forward with other Traders
All the best
Greg Capra