
How a Bullish Wide Range Bar Ignited a Fast WGS Swing Trade
GeneDx Holdings Corp. (WGS)
Successful swing trading is not about predicting the exact high or holding every trade for the largest possible gain. It is about recognizing a compelling setup, entering when price confirms it, and managing the position as conditions change.
GeneDx Holdings Corp. provided an excellent example of that process. The setup combined a prior momentum move, a successful retest of support, bullish moving-average alignment, and a bullish Wide Range Bar that became the entry trigger.
The Setup Before the Breakout
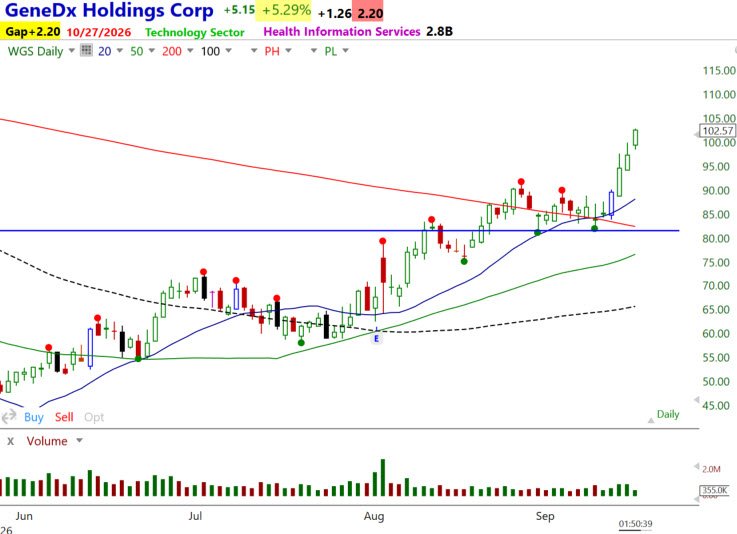
WGS moved strongly higher during August before consolidating its gains near the end of the month and into early September.
The August 31 low became a pivot low and an important reference point. Price successfully retested that area on September 9 without breaking down. Buyers responded, confirming support and preserving the bullish price structure.
This was important because the pullback was controlled. WGS was not collapsing from its prior advance. It was digesting the move while holding above support and setting up for another potential move higher.
The MTS Technical Picture
The moving averages added visual confirmation to the bullish price action.
The 20-MA was above the 50-MA, and both were positioned above the rising 100-MA. That represented bullish intermediate-term alignment.
The declining 200-MA prevented this from being a completely bullish moving-average stack. However, price had moved above the 200-MA and was holding there, which was still positive.
As we teach in Master Trader Strategies, we trade price—not moving averages. The moving averages helped us recognize the trend and the favorable location, but price still needed to provide an entry trigger.
The Bullish Ignition Candle
On September 14, WGS formed a bullish Wide Range Bar, or +WRB, that expanded out of the consolidation.
This was an ignition candle. It signaled a decisive increase in demand and provided objective evidence that buyers were taking control.
The trade trigger was above the high of the +WRB at $90.17. Moving above that level confirmed the breakout and activated the swing-trade entry.
The prior consolidation and successful support retest helped define the risk. The +WRB provided the confirmation needed to act.
Entry and Trade Management
The entry was above the $90.17 trigger, and WGS accelerated quickly after the breakout.
Within only a few trading days, price approached the psychologically important $100 whole-number area, producing close to a $10-per-share move.
We exited the trade just below $100.
That decision was based on three developing risk factors:
- The stock was approaching the $100 whole number, an area with meaningful options activity.
- Options expiration was approaching.
- A Federal Reserve interest-rate decision created additional event risk.
With WGS already extended following a fast move, the combination favored taking the gain and reducing exposure.
In other words: risk off.
We Did Not Sell the Top—and That Is Okay
WGS continued above $100 after the exit. It would be easy to look at the chart afterward and say we should have continued holding.
That is hindsight, not trade management.
Our objective was not to predict the exact top. The objective was to capture the high-probability portion of the move while controlling exposure as the stock approached resistance and significant market events.
The trade produced close to a $10-per-share gain in only a few days. That was an excellent swing trade based on a defined setup, an objective trigger, and disciplined management.
The Master Trader Lesson
This trade brought several MTS concepts together:
- A strong prior advance
- A controlled consolidation
- A successful retest of a pivot low
- Bullishly aligned short- and intermediate-term moving averages
- A +WRB ignition candle
- An objective entry trigger
- Proactive management as price approached a whole number and event risk increased
The +WRB did not create the opportunity by itself. Its significance came from where it formed and the price structure that preceded it.
That is the difference between simply identifying a candlestick and understanding the complete technical picture.
At Master Trader, we teach traders how to combine price patterns, trend, support and resistance, moving-average relationships, Multiple Time Frame analysis, and objective trade management.
For stock and options trade ideas, market analysis, and ongoing MTS education, learn more about the Master Trader Advisory Swing and Options Letter:
