This week’s Chart of the Week is about Crude Oil at a critical level and news pending.
After a sharp war-driven rally earlier in 2026, Light Crude Oil Futures have given back a significant portion of that move. The market is now weighing the possibility of de-escalation, lower inflation pressure, and whether a potential “deal” could remove more of the geopolitical risk premium from oil prices.
What the Chart Shows
More...
From an MTS perspective, the chart tells a clear story.
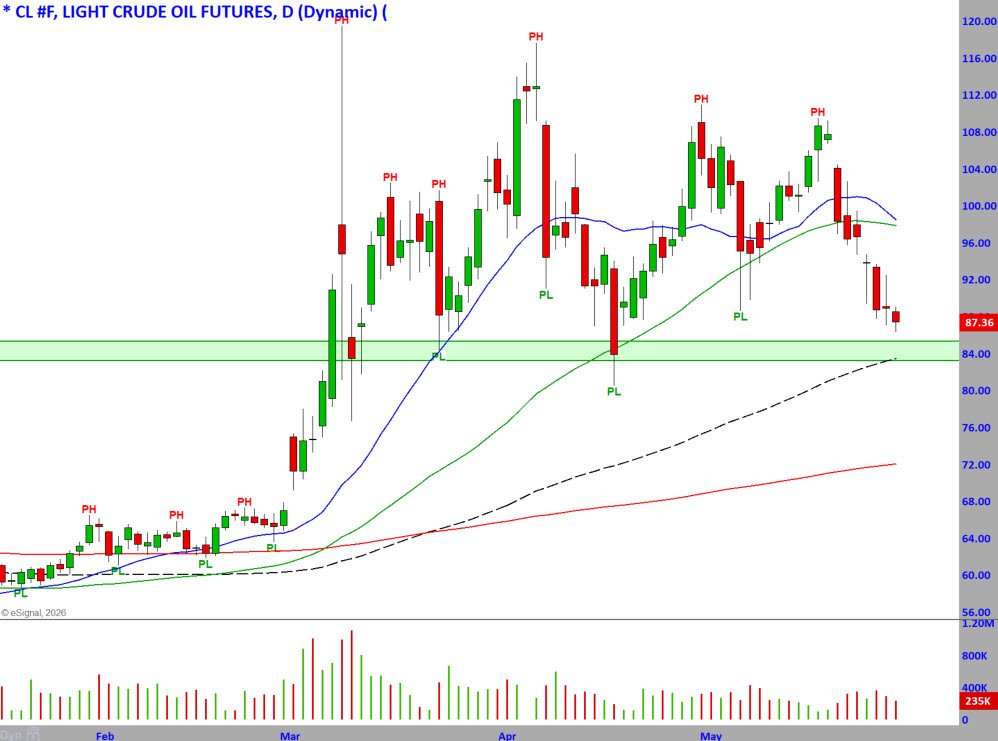
Oil made a powerful advance in March and April, pushing above $110 and forming several Pivot Highs amid intensifying geopolitical concerns. That type of move reflects urgency, emotion, and fear of supply disruption.
But the character has changed.
In May, price broke down hard from the $100 area and is now trading below the shorter-term and intermediate moving averages. Both moving averages have started to roll over, showing that short-term momentum has shifted bearish.
The key area now is the green support zone near $84–$85.
That level matters because it acted as resistance on the way up and is now being tested as potential support. A decisive break below that area would be technically important and could open the door toward the $75–$80 area.
On the upside, the $92–$94 zone becomes the first area of resistance. What was support on the way down may now become resistance on a bounce.

Use Coupon Code Memorial26 at Checkout - Mostly Site Wide
Why the Broader Market Is Watching Oil
Oil is not just an energy chart. It connects directly to inflation, interest rates, and risk appetite.
Lower oil prices can reduce headline inflation pressure. That helps the market believe the Fed may have more flexibility, which has supported equities as the S&P 500 and Nasdaq push toward new highs.
The geopolitical side is just as important. If a confirmed deal, ceasefire, or reopening of key shipping routes develops, oil could quickly lose more of its war premium. On the other hand, renewed escalation could cause another fast upside reaction.
That is why this chart matters.
It is not about predicting the news. It is about knowing the technical levels, understanding the broader market impact, and being prepared for what price does next.
Key Levels to Watch
Support: $84–$85
A break and close below this area would be bearish and could accelerate selling.
Resistance: $92–$94
A bounce into this zone may find sellers unless price can reclaim it with strength.
Catalyst: Deal or escalation headlines
Confirmed de-escalation could pressure oil lower. Renewed conflict fears could quickly reverse the current decline.
Bottom Line
Crude oil is a great example of how Master Trader Technical Strategies combine price action, support and resistance, moving averages, and broader market context.
The chart reflects more than candles and moving averages. It shows the shift from fear-driven buying to aggressive selling as traders reassess the geopolitical and inflation outlook.
That is the value of MTS education.
We do not rely on opinions, headlines, or predictions. We learn to read what price is saying, identify the levels that matter, and understand how one market can influence the broader picture.
Learn more about Master Trader education and how to build a clear, objective process for analyzing markets, sectors, and stocks with confidence.