
The Need to Know
Do you get your market guidance from YouTube?
It’s a natural place to start. There are hundreds—maybe thousands—of videos sharing opinions about whether markets are about to crash or push to new highs. When you’re looking for direction, it feels productive.
But here’s the problem…
More...
Watching endless videos is no different than using indicators with endless settings. It often leads you down a path of confusion—not clarity.
Most of what you’ll find are opinions.
Very little of it is a method.
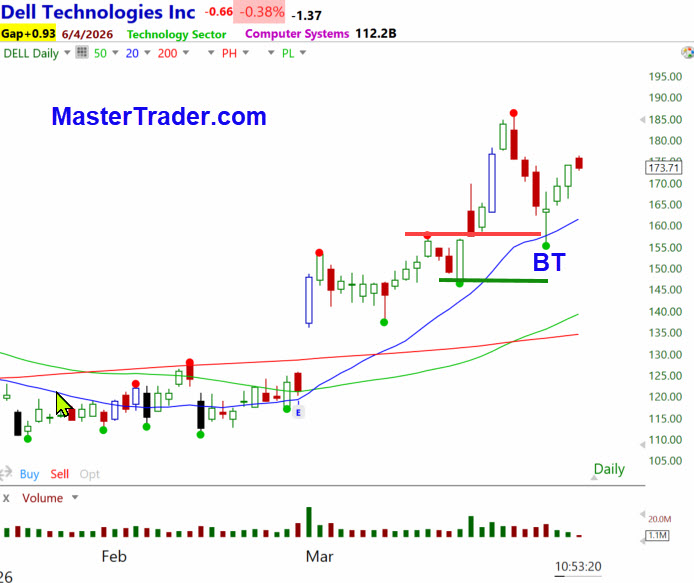
And without a method, like the chart below, you’re left trying to piece together fragmented ideas, hoping they align at the right time.
The Gap Most Traders Never Fix
Anyone can look at a chart and say a market is going up, down, or sideways.
That’s the easy part.
The real challenge—the part that separates struggling traders from consistent ones—is understanding:
- Where buyers are likely to step in
- Where sellers will take control
- When a move is likely to continue… or stall and reverse
That doesn’t come from random videos.
It comes from structure, context, and repetition.
Where Simplicity Becomes Powerful
With the right foundation, the market becomes far more logical.
In an uptrend, for example, buyers tend to step in between:
- The prior swing low
- And the breakout area that created the new high
Widely followed levels—like the 20 and 50 moving averages—act as reference points not because they’re magical, but because institutions are watching them too.
This is where technical analysis becomes what it really is:
A self-fulfilling prophecy framework of behavior. Master Trader Tip: Much of technical analysis is a self-fulfilling prophecy. Read, there is nothing new in technical analysis. Where I explain in detail.

Real Example – Not Theory
As shown in the DELL chart
After earnings, (E) price broke out and formed a base—creating a new support level. From there:
- Higher highs and higher lows confirmed the uptrend
- Price pulled back into the breakout area and rising 20-MA
- A Bottoming Tail confirmed buyers stepping in
When it retraced to the recent breakout area and the rising 20-MA, we knew buyers would show up there. I cannot tell the future, but since technical analysis is a self-fulfilling prophecy, using Bar-by-Bar analysis, the Bottoming Tail (BT) confirmed the turn.
That wasn’t luck.
That was an objective, systematic method documented since 1994.
From there, the opportunity wasn’t just directional—it also created a high-probability income trade using a bull put credit spread.
The trade was, and still is, open in the Weekly Options Trader. The trade was Shorted Apr (4/10) $162.5/157.5 bull put credit spread for $.57/share. Buy Setup and reversal at the 20-MA. Stop $164.48.
Most traders see a chart.
Professionals see trends,
location, odds, and strategy selection.
Why Most Traders Stay Stuck
Many traders never move past the “information stage.”
They:
- Watch more videos – your time is wasting away in front of your eyes!
- Add more indicators
- Look for the next opinion
But never build a repeatable process.
This overview is a great start to creating a bias for your trading plan. It can also be used for intraday trading, which we do in real time in the Green Room. In the room, we review the trading concepts covered in the courses daily.
What Actually Changes Everything
What professional traders rely on isn’t more information.
It’s a Methodology.
One that is:
- Systematic
- Objective
- Adaptable to changing market conditions
A method that tells you:
- What the market is doing
- What it’s likely to do next
- And how to act on it with defined risk
I explain the Master Trader Methodology and apply it to broader market sectors across multiple time frames in each letter: the Advisory Swing Letter and the Options Trader Letter.
At this link, you can get the letter for 2 months for the price of one and two short courses.
