Master Trader Technical Strategies (MTS): Building a Professional Trading Belief System
Master Trader Technical Strategies (MTS) is built on a structured set of concepts that form a trading “belief system”—one that allows you to objectively determine what has happened, what is happening now, and what is most likely to happen next.
This does not mean predicting the future.
It means aligning with probabilities based on repeatable patterns and behavior.
As traders, our job is not to guess—it is to interpret price through a defined framework and act when the odds are in our favor.
MTS is built on a combination of technical concepts that, when understood and applied together, create clarity in what most perceive as randomness.
Understanding the Chart Below: Turning Information into Bias CHART
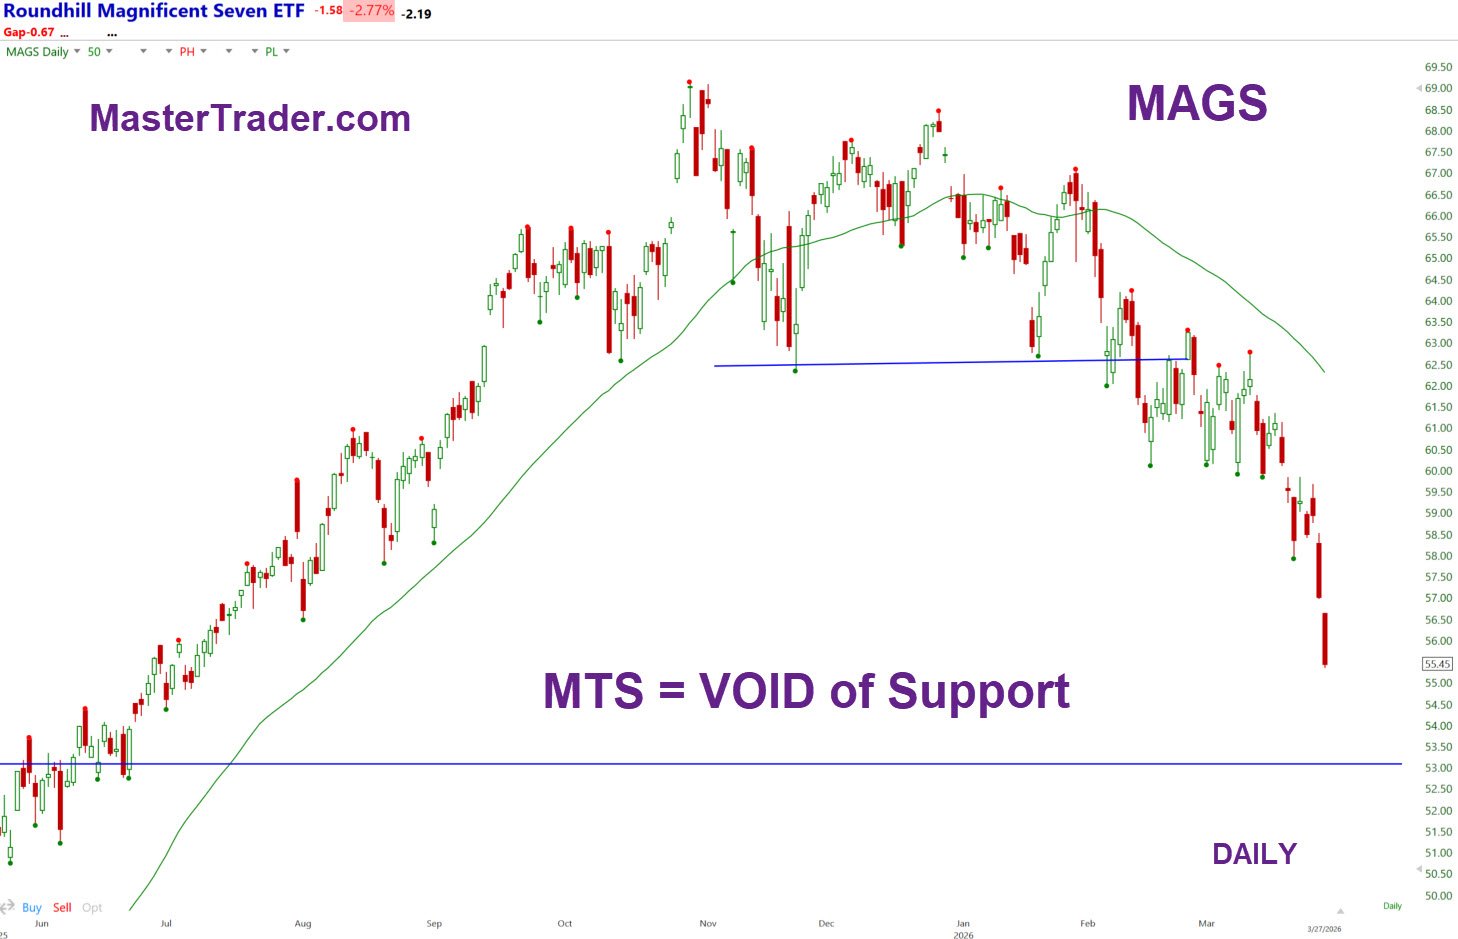
In the example shown (MAGS ETF), we apply several core MTS concepts to build a directional bias.
The candlestick chart provides immediate insight into price behavior—opening and closing prices, the strength of buyers vs. sellers, and where price is positioned within its range.
From there, we define structure.
Pivot highs (red dots) and pivot lows (green dots) serve as objective reference points. A pivot high forms when a bar has three lower highs on both sides. A pivot low forms when a bar has three higher lows on both sides.
These pivots are not just markers—they define structure.
A sequence of higher pivot highs and higher pivot lows defines an uptrend.
A sequence of lower pivot highs and lower pivot lows defines a downtrend.
When pivots begin to overlap and compress, the market is transitioning into a sideways environment.
Clusters of pivots define key support and resistance—areas where decisions are made.
Smart Moving Averages: Context Across Time Frames
The 50-period moving average provides a reference for the intermediate trend and reflects institutional positioning.
In MTS, we refer to this as a Smart Moving Average because it bridges multiple time frames. The 50-MA on a daily chart approximates the 10-MA on a weekly chart, providing insight into higher-time-frame direction without switching charts.
When price is trending above a rising 50-MA, the expectation is for a higher continuation.
When price breaks below it, and the average flattens or declines, the environment shifts.
From Trend to Transition: Recognizing Change Early
On the left side of the chart, MAGS was in a clear uptrend—higher highs, higher lows, and a rising 50-MA.
That structure supports a bullish mindset. The correct thought process is to look for buying opportunities until proven otherwise.
That changed.
Near the end of 2025, price behavior became erratic. Wide swings, failed breakouts, and sharp reversals replaced orderly movement. This type of price action is not random—it reflects uncertainty
MTS Principle:
Erratic price movement after an extended trend often signals a transition phase and increases the probability of a trend change.
During these periods, directional trading becomes less reliable. The correct response is not to force trades—but to recognize the shift and adapt.
If price begins to tighten, the trend may resume. If it remains unstable, caution is warranted.
This is also where certain strategies—like credit spreads—can be applied selectively using bar-by-bar analysis.
Breakdown and Probability Shift
In February, price broke below the multi-month consolidation and the 50-MA.
That break was significant.
When price breaks below a well-established base, the probability of continuation lower increases. Attempts to stabilize—seen as overlapping pivots—are typically weak after such damage.
This is where many traders make a critical mistake. They assume the market will “bounce” simply because it has declined.
MTS teaches otherwise.
Price must prove strength—not suggest it.
When MAGS failed to rebuild structure and resolved lower, it entered a price void—an area with little to no prior support to the left.
That is where acceleration occurs.
Understanding Momentum and Psychology
The sharp, vertical decline that followed reflects a shift in psychology—what we define as a “sell at any price” environment.
This type of movement is driven by urgency and emotion, not orderly decision-making.
While this often leads to further downside in the short term, it also plants the seed for a future opportunity.
MTS Insight:
Climactic, emotional selling is a necessary condition for a tradable bottom—but not a signal to act.
That is where most traders fail—they act too early.
We wait for confirmation.
MTS is not about isolated indicators or patterns.
It is about combining structure, trend, momentum, and psychology into a unified belief system.
In this example, the process leads to clear conclusions:
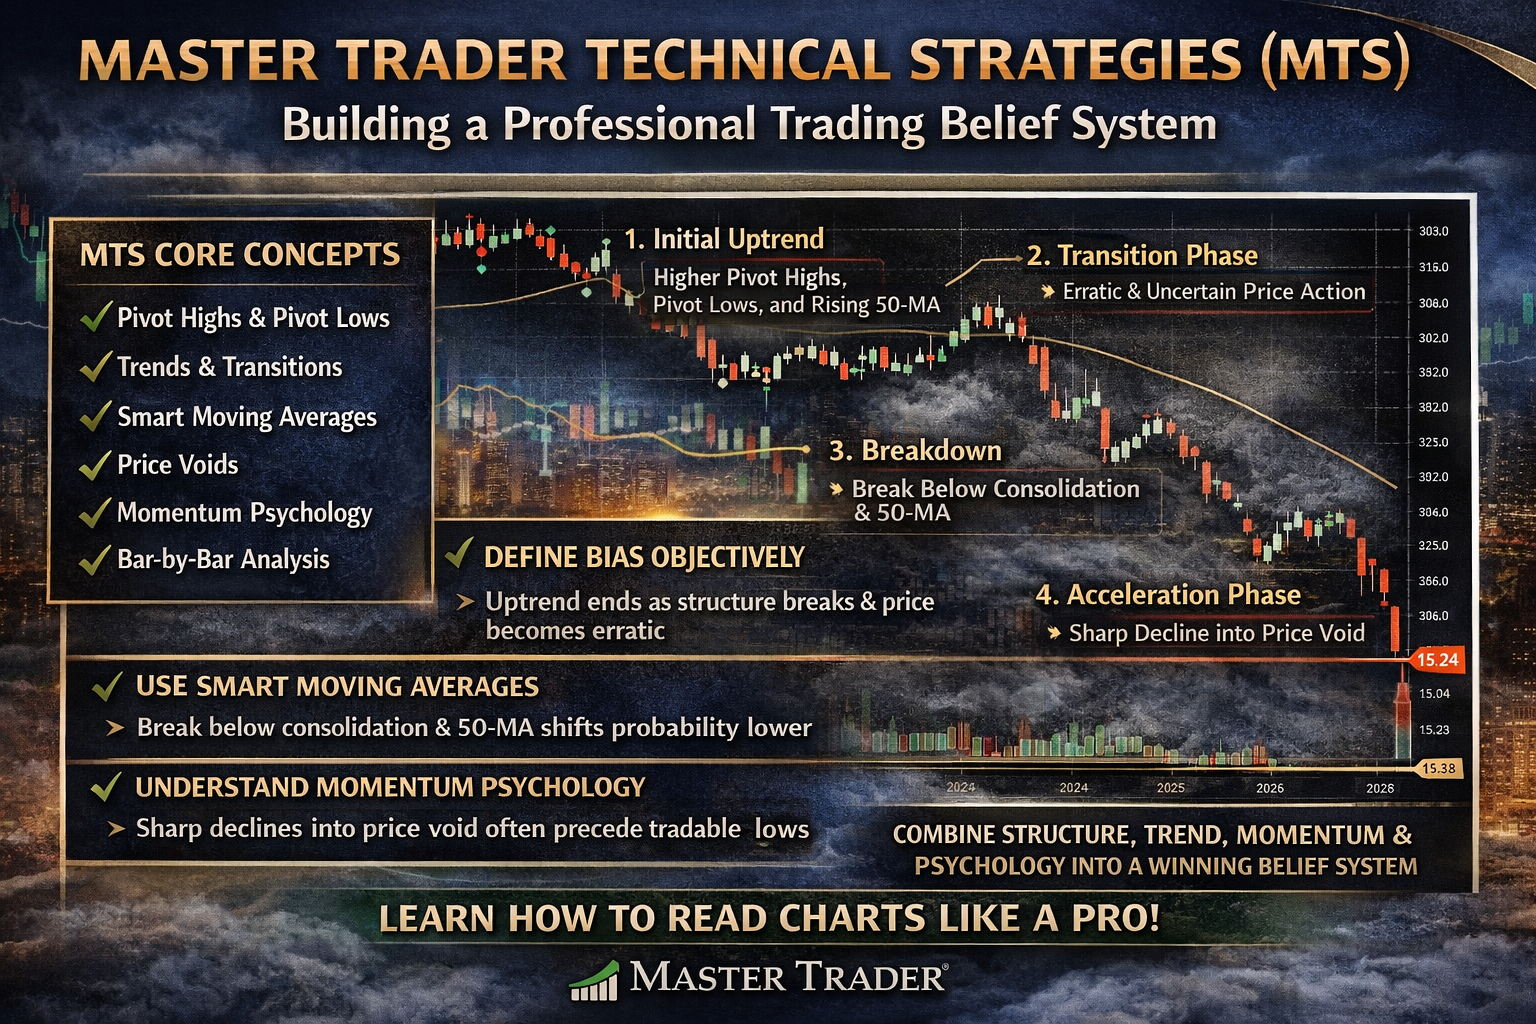
• The uptrend ended when structure broke and price became erratic
• The breakdown below consolidation and the 50-MA shifted probability lower
• The lack of support created a price void, leading to acceleration
• The vertical decline reflects emotional selling, increasing the potential for a future reversal
But the key is this:
We do not act on potential—we act on confirmation.
That is what separates disciplined traders from reactive ones.
What MTS Teaches
MTS teaches you how to think—not just what to look for.
It gives you a structured process to:
• Define bias objectively
• Recognize transitions early
• Avoid low-quality environments
• Identify high-probability setups
• Execute with defined risk
Most traders see charts.
We teach you how to read them.
And once you can read them, you no longer rely on opinions—you rely on a process.
That is where consistency begins.
Read about the Bar-by-Bar Analysis course, I break down these nuances and a lot more in detail—like management, multiple time frames and trader psychology, so you can move beyond recognizing patterns and start understanding what they actually mean.
This week only, See Your Significant Pre-Applied Discount at the Checkout!