

Some of last week’s comments included,
Historically, there has never been a sustained bull market where these three economically critical, heavily weighted sectors were all weak at the same time.
When leadership fractures this way, markets typically transition into correction phases or extended choppy environments rather than clean, trending advances. For now, the evidence suggests rotation, not collapse.
Chasing strength has rarely been rewarded, except in the very short term.
Market Overview – Rotation, Not Ruin (Yet)
Over the past several weeks, we’ve emphasized a critical historical observation:
There has never been a sustained bull market where three economically critical, heavily weighted sectors were all weak at the same time.
When leadership fractures, markets don’t typically collapse immediately. They transition. They rotate. They churn. They become selective.
And that is exactly what we are seeing.
Chasing strength has not been rewarded beyond very short bursts. Leadership has narrowed, broadened, and then narrowed again. This is not the clean trending environment of April and May. This is a market deciding what it wants to be next.
Last week, however, the tone changed.
It will likely be remembered as the week when AI stopped being a theme and started being a disruptor.
AI: From Hype to Displacement
Software stocks have been in a quiet bear market for months. That wasn’t new.
What was new was how AI-driven fear expanded beyond tech.
Freight brokers:
- C.H. Robinson (CHRW)
- Landstar (LSTR)
- Expeditors (EXPD)
Wealth & asset managers:
- Schwab (SCHW)
- LPL Financial (LPLA)
- Ameriprise (AMP)
- Raymond James (RJF)
Real estate services:
- CBRE (CBRE)
- JLL (JLL)
- Cushman & Wakefield (CWK)
Even media giants like FOX and News Corp were hit hard.
This wasn’t earnings disappointment. It was structural fear — AI removing middle layers of human intermediation.
That is a very different animal. The market is beginning to price not just productivity gains, but displacement.
The Technical Breakdown – Worst Week of 2026
Monday & Tuesday: The Setup
The week began with momentum. The powerful advance from the prior week suggested:
- The S&P 500 could push toward new highs.
- The Nasdaq 100 might reclaim its 50-MA.
Tuesday’s gap higher looked promising — until it wasn’t.
We got a bearish reversal day.
In Master Trader Technical Strategies (MTS), a reversal is never judged in isolation. Potency depends on what preceded it.
What strengthened the reversal:
- S&P 500 was at the top of its trading range.
- Nasdaq 100 was pressing into Minor Resistance.
What weakened it:
- The advance into resistance was powered by bullish Wide Range Bars (WRBs), signaling aggressive demand.
Master Trader Tip: When a bearish reversal is preceded by bullish WRBs, it is historically a poor sell setup.
And that proved true — briefly.
Wednesday: Another Concern
Another gap higher, buyers were not giving up, which makes sense after the power of the move from the week before last.
Buyers, rightly so, based on the price action at the time, continued to step in, but by 10 AM ET, without further thought, gave up, and another bearish reversal day formed.
Thursday: The Trap
The broader markets gapped above Wednesday’s high.
That gap suggested:
- Institutional sponsorship
- Potential breakout
- Possible new all-time highs
But within 30 minutes, the tone shifted.
Prices sliced through the gap. The Nasdaq 100 fell as if support didn’t exist.
An intraday pivot temporarily caught the fall. Prices bounced.
Uncertainty returned.
Then at 10:30 AM, sellers hit the market with force.
What followed was one of the largest bearish Wide Range Bars (-WRB) we’ve seen in some time.
A true air pocket.
Friday became a day for short-term bounce traders — not trend traders.
Where Did the Money Go?
When markets fall that sharply, capital doesn’t disappear. It relocates.
It went to bonds.
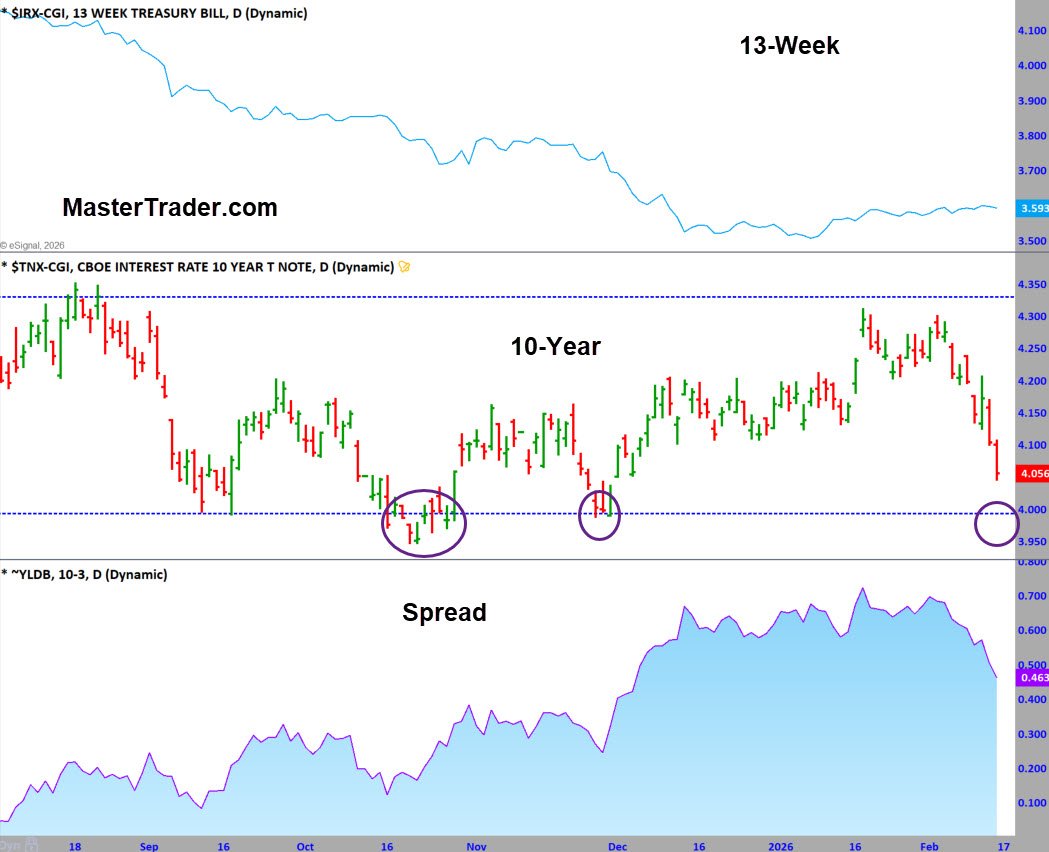
- 10-Year yield fell sharply.
- 5-Year and 30-Year yields followed.
- 3-Month held steady.
The yield spread narrowed quickly — a classic risk-off signal.
Falling long-term yields signal:
- Growth concerns
- Economic uncertainty
- Increased probability of Fed rate cuts
Liquidity expectations re-entered the conversation.
This move directly benefited positions in our ETF letter:
- Utilities (XLU)
- Real Estate (XLRE)
Defensive sectors and yield-sensitive assets found sponsorship.
That is rotation — not collapse.
Rolling Correction Since November
Using the S&P 500, Nasdaq 100, Magnificent Seven, and sector charts, this has been a rolling correction since late last year.
The pain simply keeps moving:
- First software.
- Then semiconductors.
- Now transports and asset managers.
- Next?
Yet two important ETFs continue to quietly hold trend:
- Equal-Weighted S&P 500 (RSP)
- S&P 500 Value (SPYV)
That tells us something critical.
The market is not imploding. It is repricing leadership.
Breadth, Internals & Leadership
The selloff was broad — Transports and Russell 2000 were caught in the downdraft — but their uptrends remain intact for now.
Our internal sentiment gauges are approaching a bullish level but are not there yet.
Breadth remains near zero — still weak — but holding.
This is exactly the environment where:
- Leaders stall.
- Laggards attempt to lift.
- Defensive sectors outperform.
- Momentum traders get chopped.
It is uncomfortable — but not structurally broken.
Interest Rates – The Real Catalyst
The 13-week vs. 10-year yield spread is becoming critical.
Each time the 10-year has moved toward 4%, equities have stabilized.
If yields continue to fall on soft data:
- Rate cut probability increases.
- Defensive rotation continues.
- High-multiple growth could attempt relief rallies.
If inflation reappears:
- Long yields rise.
- Valuations compress.
- Leaders remain vulnerable.
Interest rates are the fulcrum.
AI & Software
Software and bitcoin-related stocks have been in prolonged declines.
Interestingly, during Thursday’s collapse, they did not fall proportionally.
That relative strength — after extended declines — can signal early accumulation.
They are not bottomed.
But they may be closer to a relief rally than most realize.
S&P Sector ETFs – Daily Charts - To See a Larger Image,
Right-Click and Press Open in a New Tab

S&P Sector ETFs – Weekly Charts - To See a Larger Image,
Right-Click and Press Open in a New Tab

S&P Sector ETFs – Sorted by Weekly Percent Change This Week

Last week’s percentage changes.
The percentage changes tell you which sectors were the strongest or weakest on Friday and for the week, month, quarter, and year.
There are seven columns after the percent changes in the sector listed above.
You can see the ETFs that are the strongest getting stronger or weakening.
- Close above or below the 20-MA.
- Close above or below the 20-MA 5 Days Ago. C>20 -5
- Close above or below the 50-MA.
- Close above or below the 50-MA 5 Days Ago. C>50 -5
- 20-MA above or below the 50-MA.
- 20-MA is pointed up, and the close is above the 50-MA
Where are the Markets Headed this Week?
Trader sentiment has moved close to levels typically seen near market lows, but it has not reached an extreme. There is still room for additional pessimism before we get the kind of washed-out condition that often marks durable turning points.
Breadth remains neutral. The reason is simple: the sharp rotation out of AI-related growth stocks has been offset by rotation into defensive and value sectors. That push-pull dynamic has kept the breadth oscillator hovering around the zero line rather than reaching an extreme.
One possible scenario for this week is that the broader market weakens further, pulling most stocks lower. If that occurs, breadth could finally push to a bullish extreme at the same time sentiment reaches one.
That combination would generate a buy signal we have not seen in some time. When breadth reaches a bullish extreme, we typically begin to see constructive reversal patterns develop, which present higher-probability buying opportunities.
This week is an options expiration week. These weeks are often choppy as market makers adjust and rebalance hedges, which can mute momentum and reverse sharp moves. After expiration, those hedges are unwound, and the market tends to move with more clarity. That timing suggests patience early in the week may be rewarded.
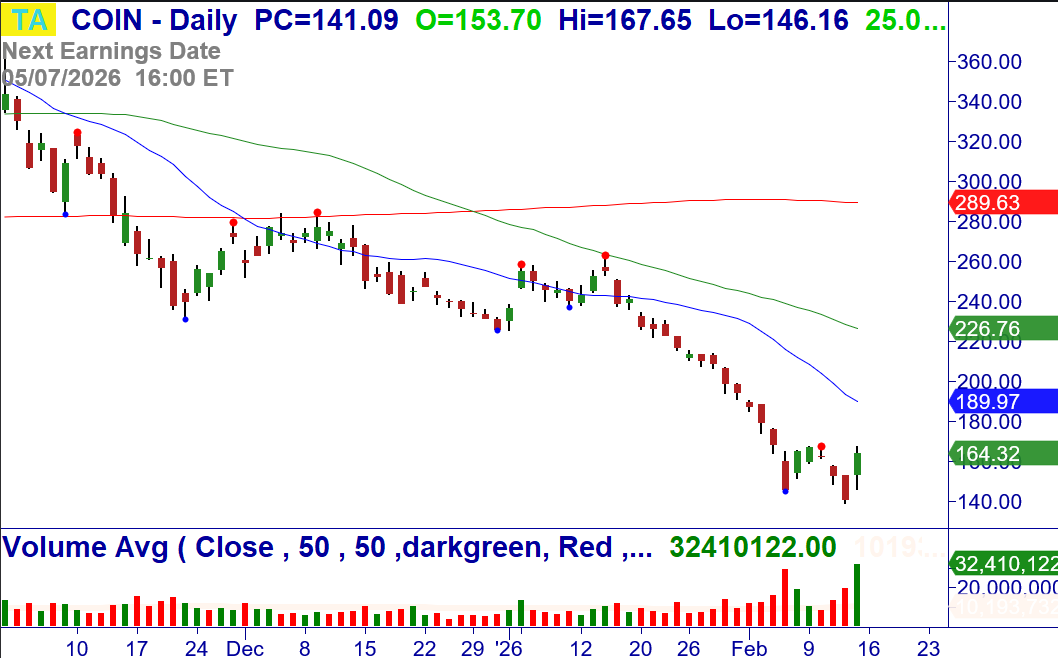
I am optimistic that this week could provide a clearer view of a short-term tradable low in both Bitcoin and Software (IGV). The bullish reversal in Coinbase (COIN) is worth noting, as individual leaders often turn before the broader group stabilizes.
Friday will likely be the key catalyst. PCE and GDP are scheduled for release, and both have the potential to move markets significantly. If inflation data surprises to the downside, risk assets could respond favorably. If not, we may get the final push toward the breadth extreme discussed above.
In short, conditions are approaching a level where opportunity may emerge—but confirmation is still required. Patience remains the priority.
DOW JONES
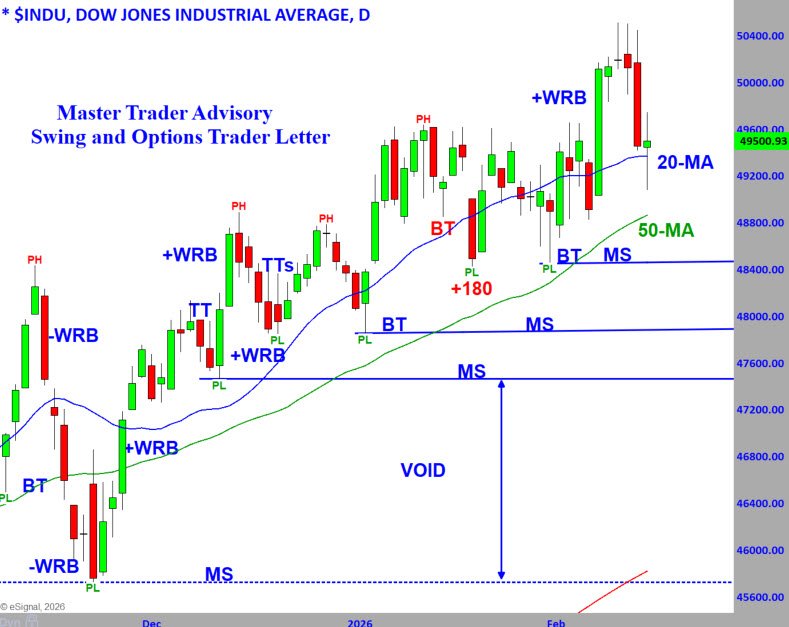
The chart above shows the Dow Jones Industrial Average through the lens of Master Trader Technical Strategies (MTS).
If you did not catch the Chart of the Week about the breakout, read here.
At the start of last week, the Dow held firmly above 50,000 and made several attempts to extend its advance, briefly pushing above 50,500 before being sharply rejected. The following day produced another rejection.
Rejections at prior highs signal profit-taking. But one or two days of profit-taking do not change a trend.
Bar-by-bar analysis teaches us that a single candle sends a message—but that message must always be interpreted in the context of trend, support, resistance, and whether there is a tradable void beneath it.
The Dow had recently broken out of a sloppy trading range. Those early rejections did not negate that breakout. They simply reflected sellers testing the resolve of buyers at new highs.
Thursday’s decline was more meaningful. It clearly put pressure on the bullish case. However, price held at Major Support (MS) and at the rising 20-MA, which continues to act as dynamic support in this advance.
That is the key level now.
If bulls defend this area and price stabilizes, the path toward new highs remains intact. If that level fails, the next logical destination is the recent Major Support near 48,400, where the last meaningful base was formed.
This week will tell the tale. Either the Dow consolidates above support and resumes its advance—or we begin a retracement toward deeper support. The levels are well defined. Now we wait for price to confirm which side gains control.
VIDEO REVIEW OF MARKETS, SECTORS, AND INTERNALS - Click lower right to open Full Screen. This IS the Advisory Update - Not ETF :)
NEW STOCK TRADING IDEAS Below
NOTE: Please see the document in RESOURCES entitled Master Trader Guidelines for Trading the Open and Gaps.
Note on Position Size Calculation in the Open Trades Sheet:
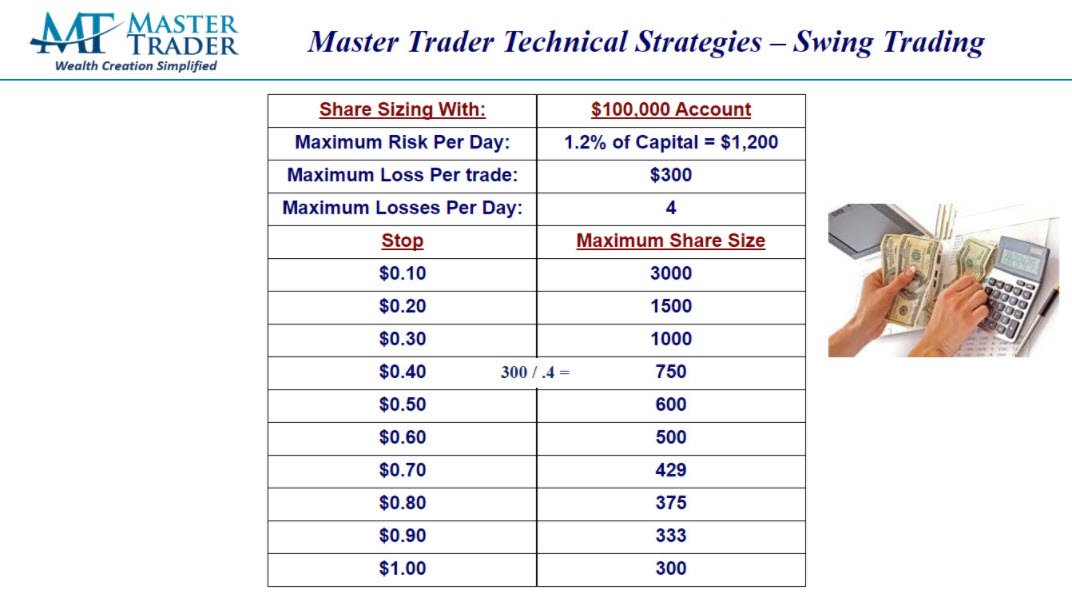
All trades are based on a hypothetical Max Loss of $300/trade. For Stocks, that is $300 / (Entry - Stop). Directional option trades use the same formula, then divided by 100, rounded down to the nearest whole number, with a minimum of one (1).
The “Master Trader Blended Method” for shorting options/spreads size starts with the stock position size, multiplying by 1.5, then divide by 100 because 1 contract represents 100 shares.
Please calculate position size according to your Max Loss per your Trading Plan.
Here's an example:
AMS Teaches You How to Maximize Profits on Every Trade. Click Here to Read More
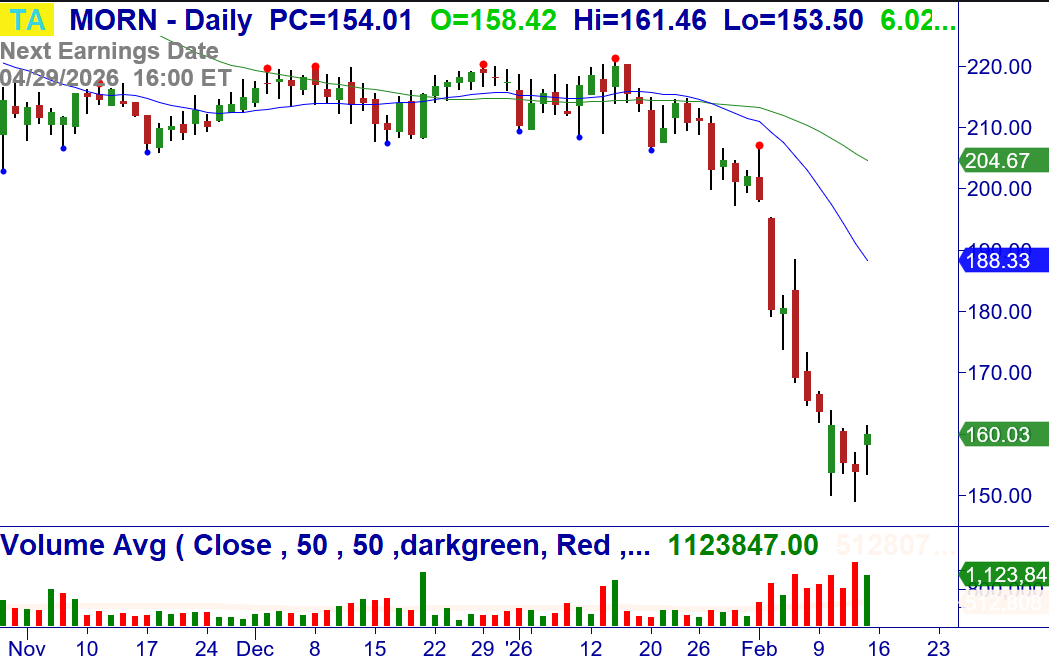
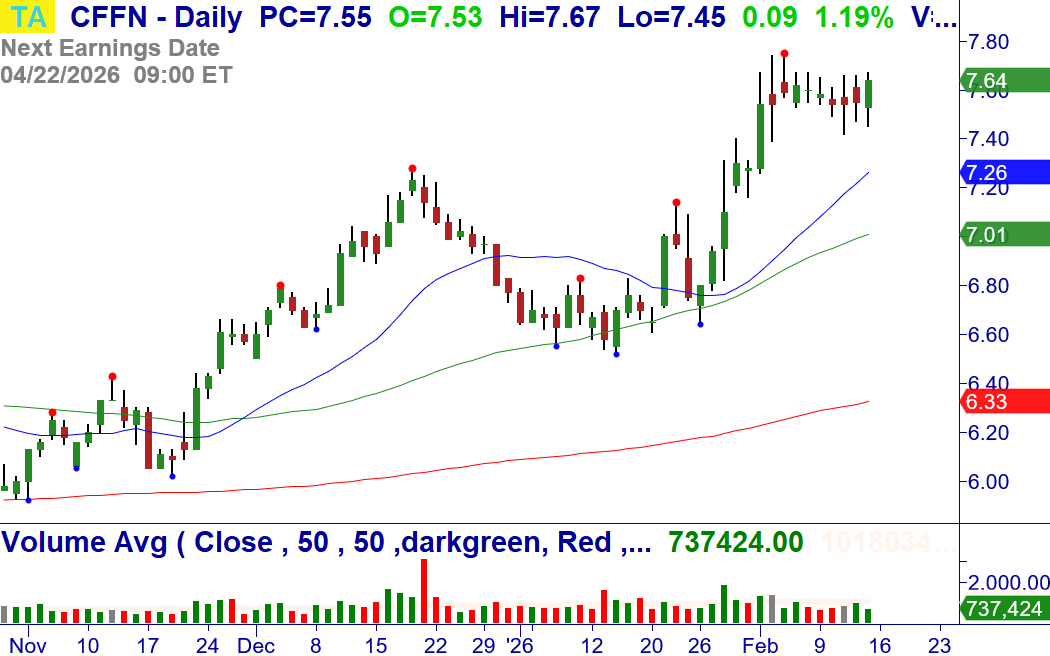
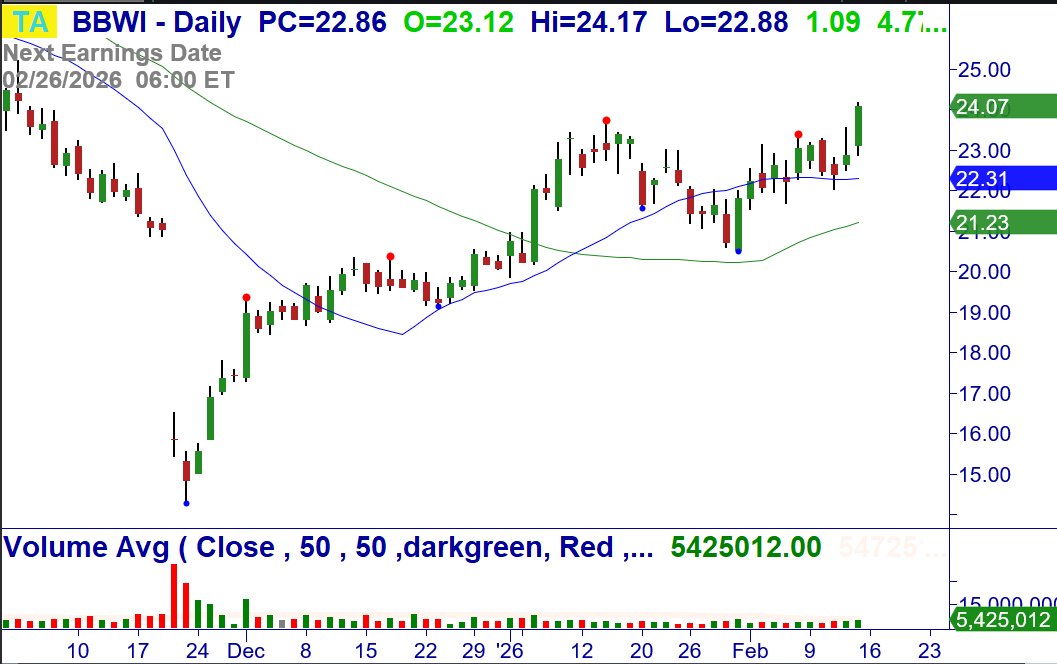
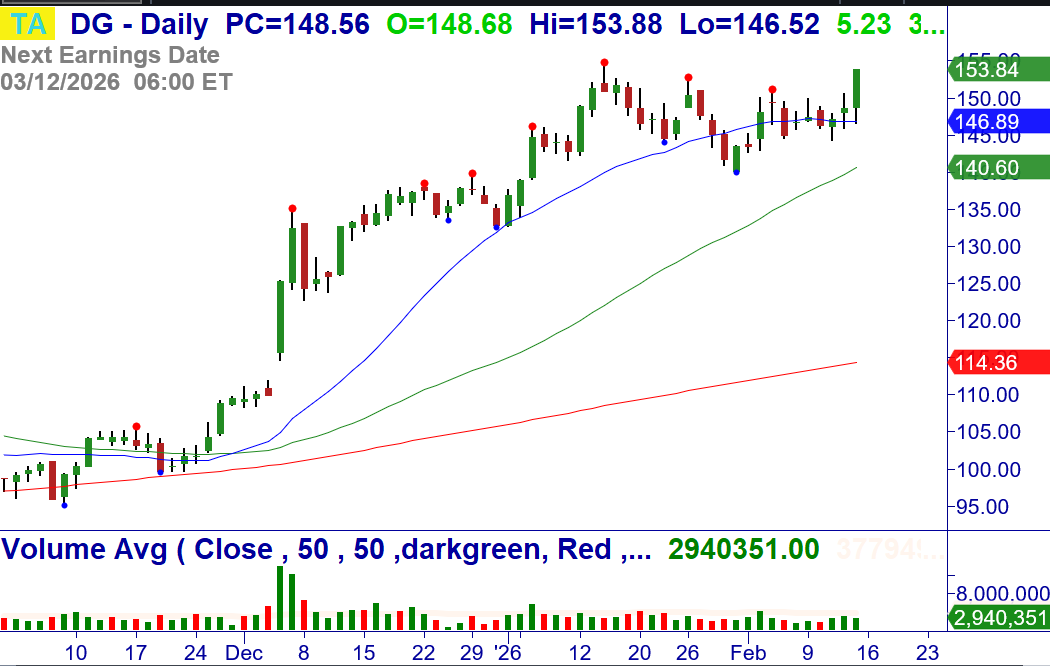
2/17: MORN – Over $161.46, consider buying the stock. Climactic Buy Setup and bullish 4-bar reversal on +Vol. Stop $149.07. Climactic Buy Setups can surprise with a significant move, since they have created a VOID, but as countertrend setups, there are many traders caught and hopeful to sell the anticipated bounce.
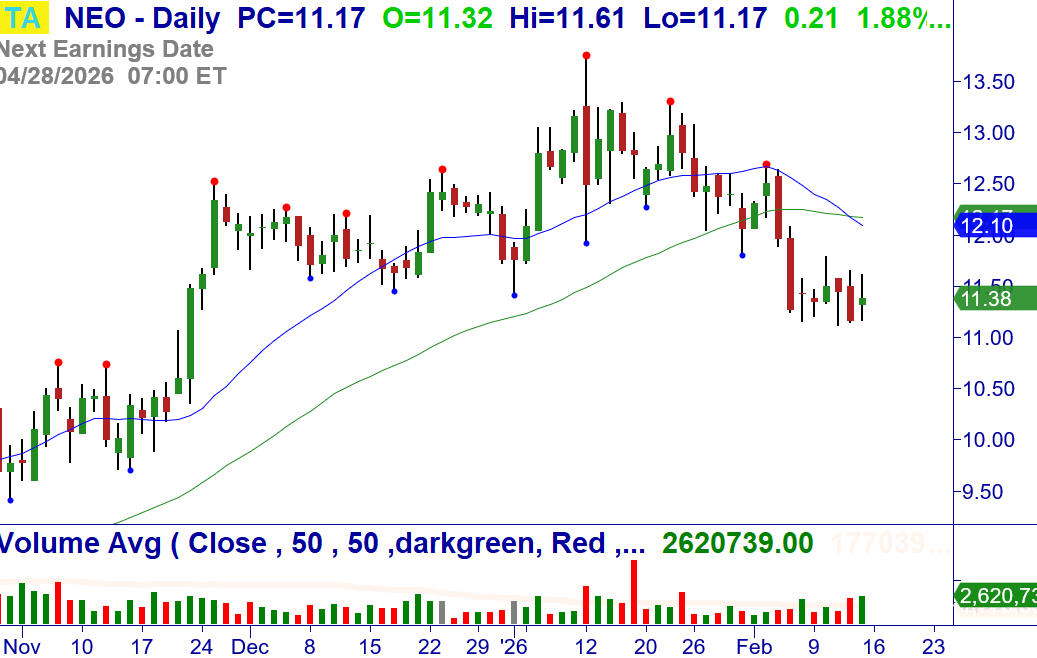
2/17: NEO – Under $11.12, consider shorting the stock. Continuation Breakdown. Stop $11.82.
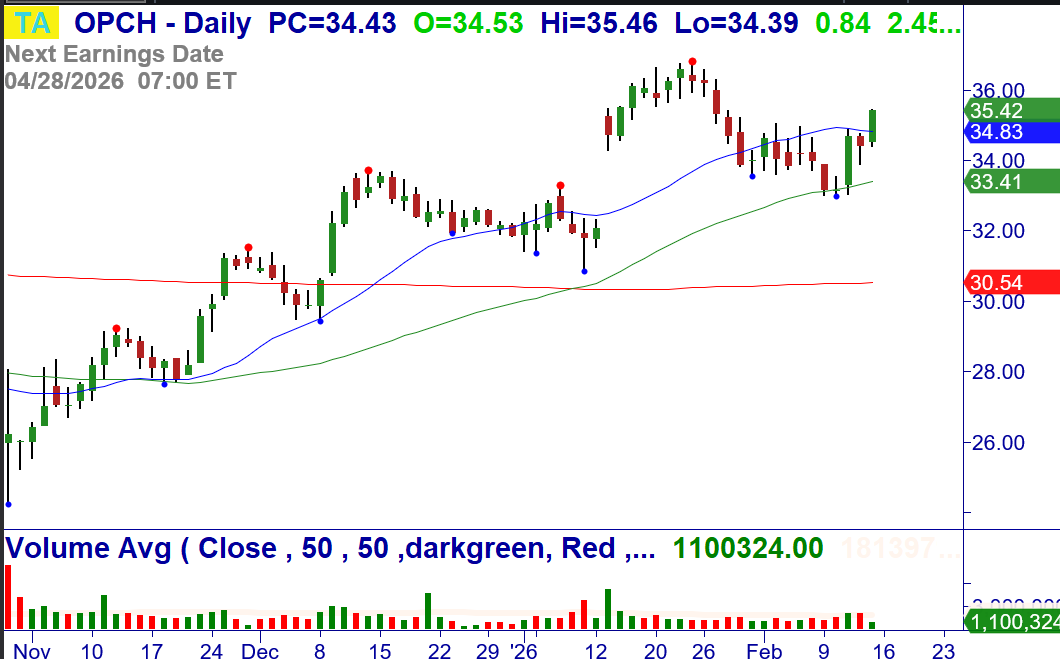
2/17: OPCH – Over $35.46, consider buying the stock. Continuation of +123 Breakout at the 20-MA. Stop $33.03.
Money Management for Trading and Investing
Proper money management for investing and Trading starts with position-sizing based on the amount of money you are willing to risk on a signal trade.
CLICK HERE to review these Master Trader Guidelines and Basic Money Management and Position Sizing Table.
NEW OPTIONS TRADING IDEAS
Directional Options Strategies and Debit Spreads for Swing Trading (See the Weekly Options Trader letter, which sells options/spreads for weekly Income that primarily expire in 10 days or less, CLICK HERE)
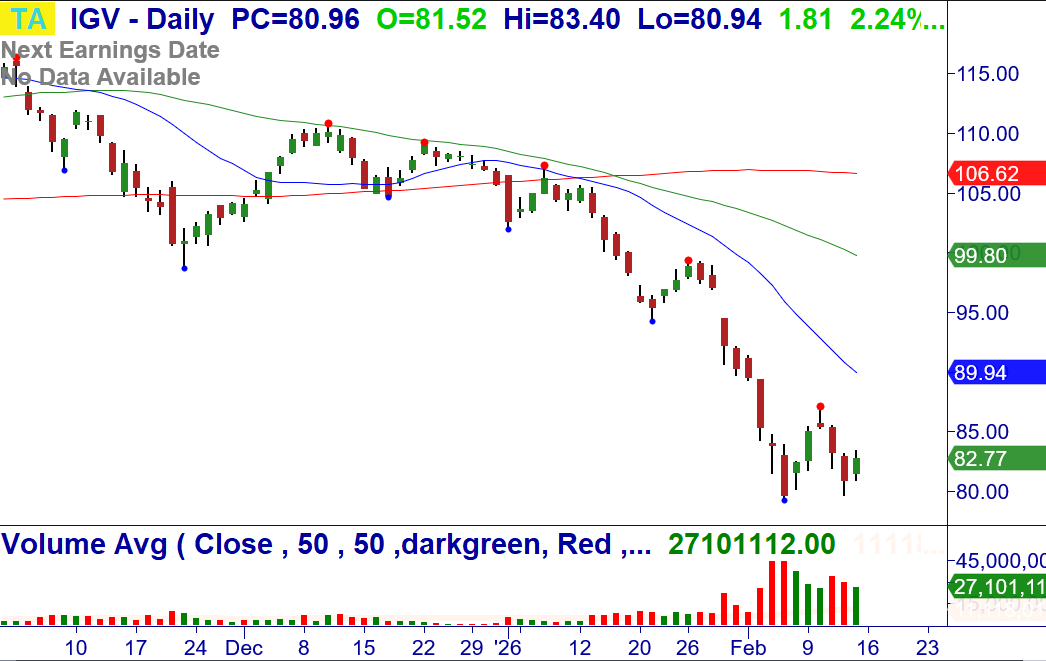
2/17: IGV – W-Bottom reversal following Climactic Buy Setup on +Vol., long watch or short put spread.
The Master Trader approach to selling credit spreads around technical turning points.
Read about the Weekly Options Trader letter, which sells options/spreads for weekly Income that primarily expire in 10 days or less, around Master Trader technical turning points, CLICK HERE
By selling spreads on stocks and ETFs where MTS indicates price is unlikely to go, we become the “smart money,” getting paid to take calculated, well-defined risk.
Check out the blog article with more information and monthly results, CLICK HERE
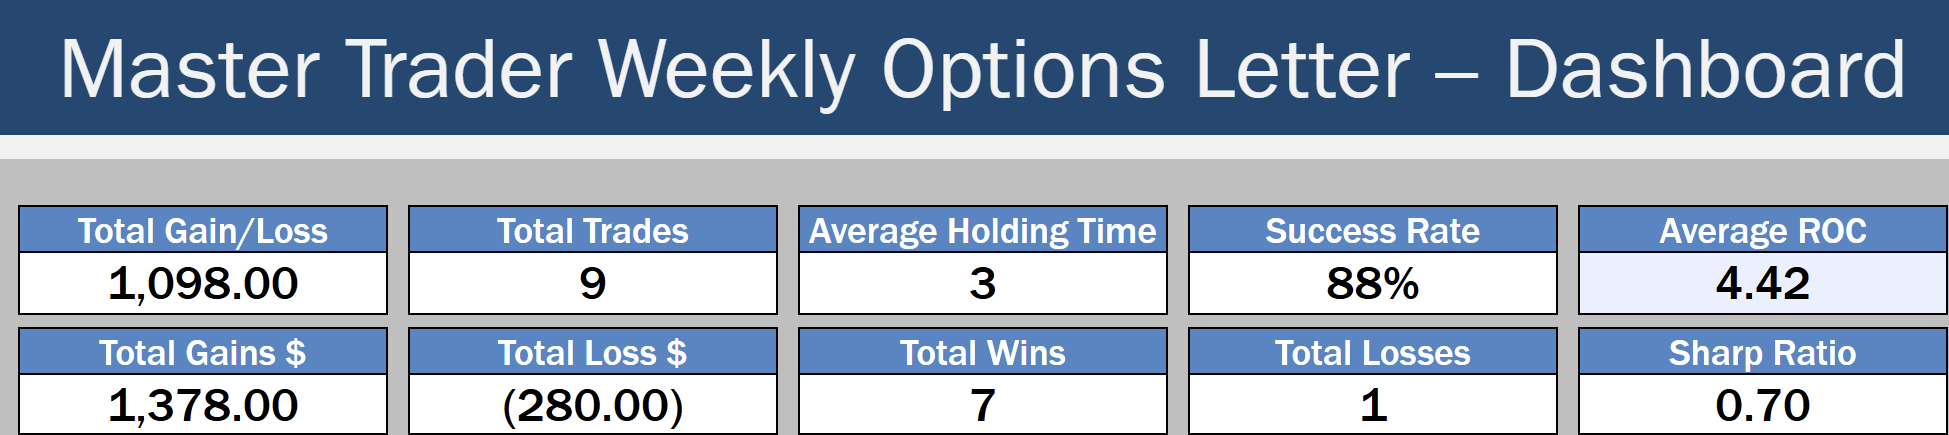
Professional consistency, short-duration trades, and risk-controlled income — that’s what defines the Master Trader approach.
Because your success is vital to you – and us.
Before selling options or credit spreads, we urge you to review the valuable and detailed information that we have provided for you in your Member’s Area Resources.
A quick simplified approach to calculating contract size is to simply base your contract size based on the number of shares permitted in your Trading Plan as if you were trading the stock or ETF. Simple Share Sizing = $ Risk / Stop Loss
The amount of money that you are willing to risk – divided by – the stop loss amount. For example, $100 / .20 = 500 shares. Credit Spread example, if your Trading Plan allowed you to trade 543 shares of AAPL based on the stop loss, then simply round down to the nearest hundred and short an equivalent number of contracts of the option. Since 1 contract represents 100 shares of the underlying, this would be five (5) contracts.
Master Trader and You Building Your Financial Future Together!
Good trading!
If you have any questions or comments, please e-mail Greg Capra at Greg@mastertrader.com or Dan Gibby at Dan@mastertrader.com
All the best,
Greg Capra Managing Director of Master Trader
Dan Gibby Chief Options Strategist
NOTE: Master Trader will show the opening and closing prices of all stock and options trades. We recommend that all traders and investors use proper share sizing for positions and money management. However, we cannot recommend what that is for your particular trading style, risk tolerance, or account balance. We urge you to calculate your own share/position size based on your individualized risk parameters, Trading Plan, and familiarity with the proposed trade strategy and risk. Advanced Management Strategies (AMS) covers in detail foundation and advanced position and money management.
NOTE: Master Trader and its representatives may have existing positions in actual or other trade recommendations before or after suggested herein. Additionally, we may manage them differently for internal purposes based on different risk parameters than noted herein. All trade ideas and content are for informational and educational purposes only. It is not, nor is it intended to be, trading or investment advice or a recommendation that any security, option, or investment strategy is suitable for any person. Trading securities can involve high risk and the loss of any funds. Significant gaps or volatility can increase these losses, particularly for short option strategies. Investment or trading information provided may not be appropriate for all investors, and is provided without respect to individual financial sophistication, financial situation, investing time horizon or risk tolerance. Supporting documentation for any claims (including claims made on behalf of options programs), comparison, statistics, or other technical data, if applicable, will be supplied upon request. Master Trader Consulting, Inc. is not a licensed financial advisor, registered investment advisor, or a registered broker-dealer. Options, futures, and futures options are not suitable for all investors.

