
In the Advisory Swing and Options Letter each week, we provide an extensive review of the week, analysis of the broader markets and S&P Sectors, Multiple Time Frame analysis, a video recap of it all, and a review of the Dow Jones Industrials chart for MTS Education.
As you know, the Dow broke out to a new all-time high and closed above $50,000 last week.
Breakouts are a common trading strategy, and I trade them - if they meet my trading plan criteria.
Let's review the Dow Chart and what happened last week. See the chart and review below.
The chart below shows the Dow Jones Industrial Average through the lens of Master Trader Technical Strategies (MTS).
The Dow remains in a well-defined uptrend, characterized by higher highs, higher lows, and rising moving averages, with the 20-MA above the 50-MA. That structure alone keeps the intermediate-term bias pointed higher.
That said, the price action has been persistently erratic. Despite the whippy behavior, buyers have consistently stepped in on pullbacks. A good example was the +180 bullish reversal, followed by a successful retest that formed a Bottoming Tail (BT)—a classic sign of demand defending price.
From a bias standpoint, the chart supported higher prices.
From a MY Swing trading-plan standpoint, it did not.
Under Master Trader Technical Strategies (MTS), erratic, overlapping price action does not qualify as a buy signal—even when the trend is up. Directional bias and executable trades are not the same thing.
You might reasonably ask: Why not buy the breakout above the highs?
Yes—you could have.
But let’s walk through what that trade actually required.
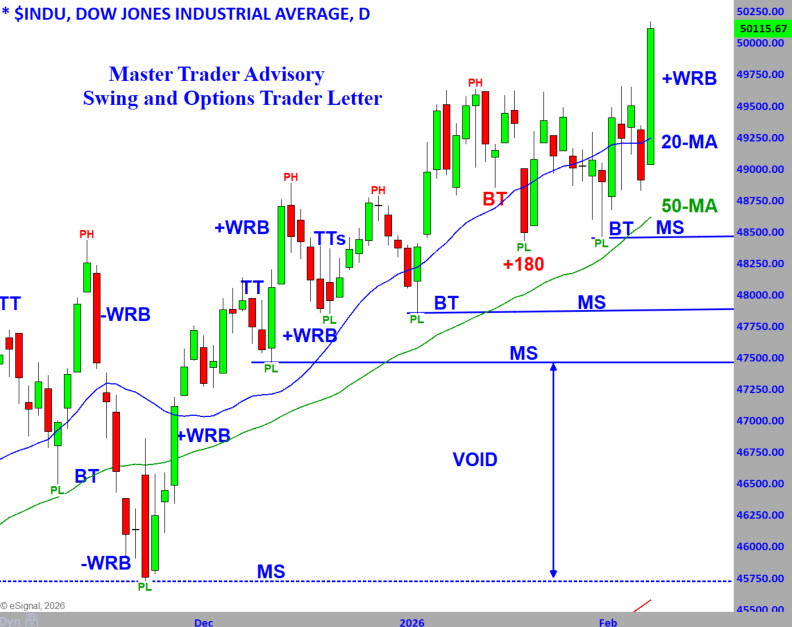
On Friday, the Dow opened roughly 124 points above Thursday’s close and held within its opening range. To decisively break out from the month-long trading range, price needed to travel roughly another 635 points, implying a total move of about 760 points from the prior consolidation. A logical stop would have had to be placed below Friday’s low, meaning risk expanded quickly.
What happened next was dramatic.
The Dow surged roughly 1,206 points on the day, forming a Wide Range Bar (+WRB)—a clear signal of institutional urgency and higher prices ahead.
So yes, the move was bullish.
But here’s the rub, and it matters.
My trading plan is designed to buy breakouts from tight consolidations, not from erratic, whippy ranges. History shows that sloppy price action tends to stay sloppy until it contracts. Chasing expansion after disorder is not part of the plan—even when it works.
That discipline means something important:
There is still no trade in the Dow based on my plan.
What now?
Now we wait.
We look for prices to tighten, digest the +WRB, and form a recognizable pattern that aligns with the plan. That process could take a day, several days, or longer—we don’t know yet, and we don’t need to know. Our job is not prediction; it’s preparation.
Until that happens, we stand aside and deploy capital in other instruments that do meet our criteria.
With Friday’s breakout and new high, we have now marked a higher level of Major Support (MS) near the Bottoming Tail and rising 50-MA. As long as price holds above that area, the uptrend remains intact. A decisive close below MS would be the first technical evidence that the trend is changing.
Until then, the Dow is bullish—but patience, not participation, is the correct position.
I hope that you've found this helpful. If you have, consider sharing it with others.
Greg Capra
