

Despite good economic data, most markets finishing negative on the week led by technology shares amid concerns over AI-driven disruption which bled into other industries. QQQ was down 1.3% and the MAGS worse, down 2.3%.
In the past, the artificial intelligence (AI) scares hit software, gaming, travel, and education stocks. This week, it hit freight, tax planning, financial services, wealth management, business software, real estate services. insurers, commercial real estate, trucking and logistics, and media.
Which industries are next?
Wednesday’s delayed January jobs report showed stronger-than-expected payroll growth which pushed Treasury yields higher (but closed much lower on the week). That, along with inflation continuing to run above target for years, most think that the Fed won’t cut rates until late 2026. The futures market, however, predicts a July cut.
Trader sentiment has moved close to levels typically seen near market lows, but it has not reached an extreme. There is still room for additional pessimism before we get the kind of washed-out condition that often marks durable turning points.
Breadth remains neutral. The reason is simple: the sharp rotation out of AI-related growth stocks has been offset by rotation into defensive and value sectors. That push-pull dynamic has kept the breadth oscillator hovering around the zero line rather than reaching an extreme.
One possible scenario for this week is that the broader market weakens further, pulling most stocks lower. If that occurs, breadth could finally push to a bullish extreme at the same time sentiment reaches one.
That combination would generate a buy signal we have not seen in some time. When breadth reaches a bullish extreme, we typically begin to see constructive reversal patterns develop, which present higher-probability buying opportunities.
This week is an options expiration week. These weeks are often choppy as market makers adjust and rebalance hedges, which can mute momentum and reverse sharp moves. After expiration, those hedges are unwound, and the market tends to move with more clarity. That timing suggests patience early in the week may be rewarded.
I am optimistic that this week could provide a clearer view of a short-term tradable low in both Bitcoin and Software (IGV). The bullish reversal in Coinbase (COIN) is worth noting, as individual leaders often turn before the broader group stabilizes.
Friday will likely be the key catalyst. PCE and GDP are scheduled for release, and both have the potential to move markets significantly. If inflation data surprises to the downside, risk assets could respond favorably. If not, we may get the final push toward the breadth extreme discussed above.
In short, conditions are approaching a level where opportunity may emerge—but confirmation is still required. Patience remains the priority.
The political drama continues with a partial government shutdown starting on Saturday over funding of Department of Homeland Security and ICE. Many employees, including TSA workers, are now working without pay.
Nothing changes in how we operate. We will continue to trade the same price patterns, manage risk the same way, and let the market—not opinions—tell us when opportunity is present.
If you're not in the Green Room with us, log in to YouTube, Facebook, or Twitter to get our pre-market review at 9 AM ET. If you can't make it, you can view the recording.
Good trading and enjoy the day off on Monday for President’s Day.
TREND MATRIX
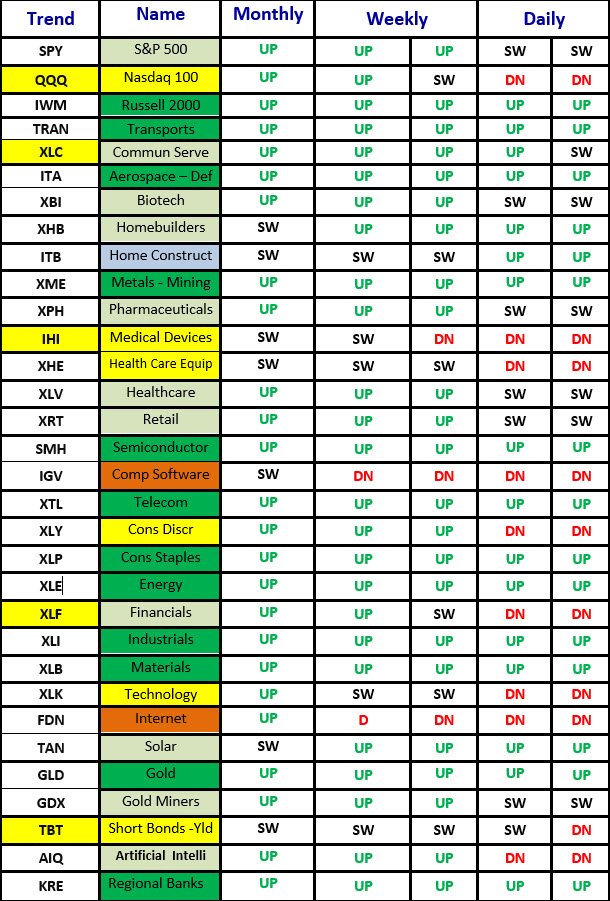
The Trend Matrix Continues to have mixed messages.
U.S. stocks posted their worst weekly performance of 2026 amid escalating AI disruption fears (the "SaaSpocalypse" extending beyond software), which overshadowed positive economic data and triggered a sharp sector rotation.
However, the damage to most ETFs were contained much better that many Individual stocks that were sold by institutions that are not taking any chances after the crushing seen in the software sector.
The selloff was broad — Transports and Russell 2000 were caught in the downdraft — but their uptrends remain intact for now.
Money rotated into bonds, and interest rates fell sharply, which helped XLE and XLRE.
Our internal sentiment gauges are approaching a bullish level but are not there yet.
Breadth remains near zero — still weak — but holding.
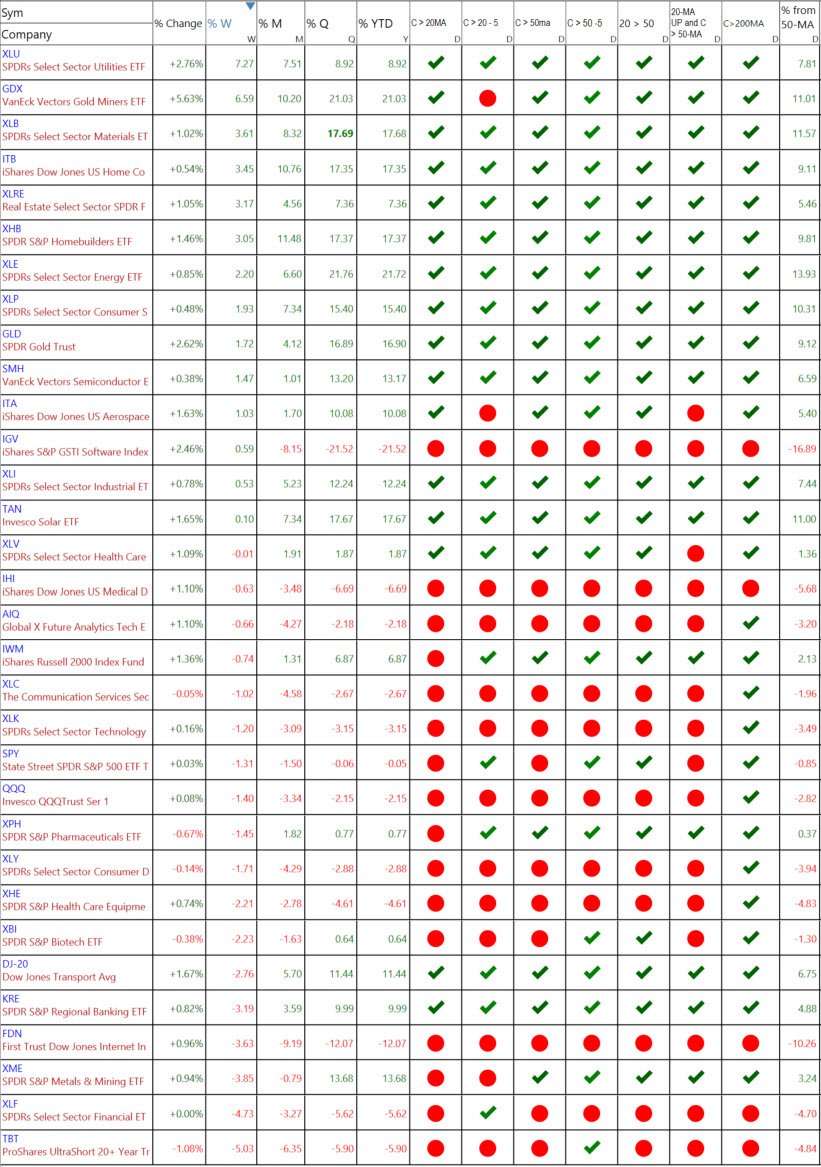
S&P Sector ETFs – Sorted by Weekly Percent Change

Last week’s percentage changes.
The percentage changes tell you which sectors were the strongest or weakest on Friday and for the week, month, quarter, and year.
There are seven columns after the percent changes in the sector listed above.
You can see the ETFs that are the strongest getting stronger or weakening.
- Close above or below the 20-MA.
- Close above or below the 20-MA 5 Days Ago. C>20 -5
- Close above or below the 50-MA.
- Close above or below the 50-MA 5 Days Ago. C>50 -5
- 20-MA above or below the 50-MA.
- 20-MA is pointed up, and the close is above the 50-MA
Other ETF Sectors – Sorted by Weekly Percent Change
See the Video Below
VIDEO REVIEW OF ETF SECTORS - Click lower right to open Full Screen.
NEW ETF TRADE IDEAS
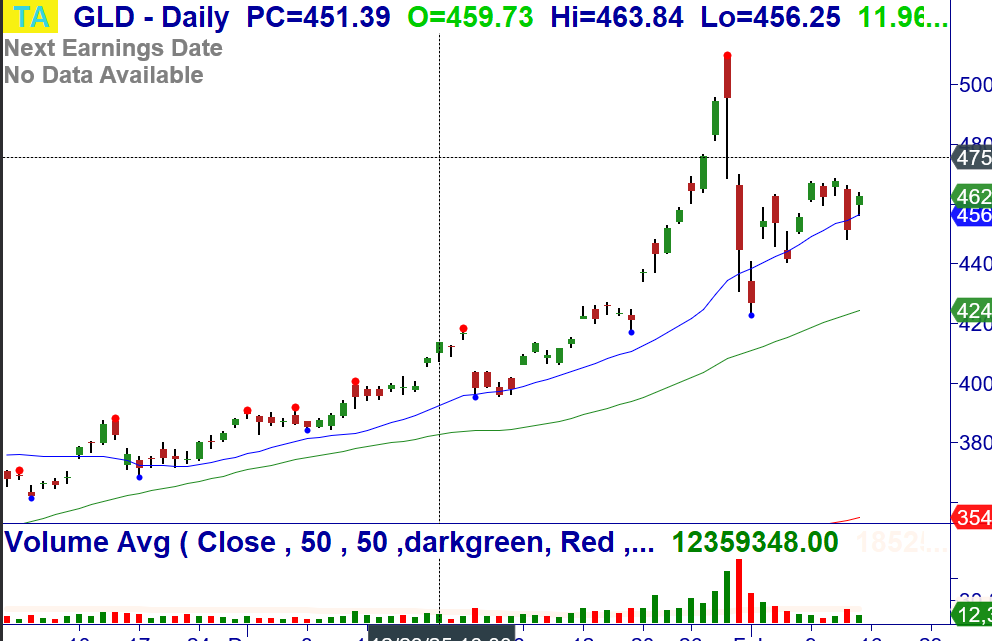
2/17: SPDR Gold Shares (GLD) – Over $468.61, consider buying the ETF. Breakout at the 20-MA, bullish weekly. Stop $440.34.
OPEN AND CLOSED ETF POSITIONS WITH TRADE UPDATES (NOTE: Also in Member's Area in Open/Closed Trade Sheet)
2/9: Pacer US Small Cap Cash Cows Index (CALF) – Consider buying a ½ lot of the ETF on a pullback between $46.40 – 46.60. +WRB Breakout to all-time highs at the 20-MA. Stop $44.54.
2/9: Global X FinTech ETF (FINX) – Bought a 1/2 lot of the ETF at $24.75. Climactic Buy Setup and +180 reversal on +Vol. 2/14: Buy a ½ lot over $24.00. Stop $22.09.
2/13: iShares Bitcoin Trust ETF (IBIT) – Bought a ½ lot of the ETF at $38.73. Climactic Buy Setup and +180 reversal on +Vol. 2/14: Buy ½ over $39.38. Stop $33.46.
2/13: iShares Expanded Tech-Software Sector ETF (IGV) – Bought a ½ lot of the ETF at $83.94. Climactic Buy Setup and +180 reversal on +Vol. 2/13: Bought ½ at $83.18. Stop $76.48.
2/9: iShares US Aerospace & Defense ETF (ITA) – Over $235.38, consider buying the ETF. Buy Setup and reversal at the 20-MA, bullish weekly/monthly. 2/13: Bought ½ at $237.04. Stop $221.20 (50-MA).
2/9: Invesco S&P 500 Eql Wght ETF (RSP) – Over $202.49, consider buying the ETF. +WRB Breakout to all-time highs at the 20-MA. Stop $196.24.
2/2: State Street Real Estate Select Sector SPDR ETF (XLRE) - Bought a 1/2 lot of the ETF at $41.53. Buy Setup and reversal at the 20/50/200-MA, bullish weekly/monthly. 2/9: Bought ½ at $41.91. 2/13: Sell 1/2 under $42.86. Move Stop $41.71.
1/28: State Street Utilities Select Sector SPDR ETF (XLU) – Bought a 1/2 lot of the ETF at $43.56. +WRB Breakout of a bottoming pattern at the 20/50-MA. 2/10: Bought ½ at $43.88. 2/13: Sold 1/3 at $45.86. Move Stop $42.54.
1/28: State Street Utilities Select Sector SPDR ETF (XLU) - Bought a 1/2 lot of the at $43.56. +WRB Breakout of a bottoming pattern at the 20/50-MA. Stop $41.73.
Master Trader and You Building Your Financial Future Together!
Happy trading! If you have any questions or comments, please e-mail Greg Capra at Greg@mastertrader.com or Dan Gibby at Dan@mastertrader.com
All the best,
Greg Capra Managing Director of Master Trader
Dan Gibby Chief Options Strategist
NOTE: Master Trader will show the opening and closing prices of all stock and options trades. We recommend that all traders and investors use proper share sizing for both position sizing and money management. However, we cannot recommend what that is for your particular trading style, risk tolerance, or account balance. We urge you to calculate your own share/position size based on your individual risk parameters, Trading Plan, and familiarity with the proposed trade strategy and associated risks. Advanced Management Strategies (AMS) covers in detail the foundation and advanced position and money management.
NOTE: Master Trader and its representatives may have existing positions in actual or other trade recommendations before or after those suggested herein. Additionally, we may manage them differently for internal purposes based on different risk parameters than noted herein. All trade ideas and content are for informational and educational purposes only. It is not, nor is it intended to be, trading or investment advice or a recommendation that any security, option, or investment strategy is suitable for any person. Trading securities can involve high risk and the loss of any funds. Significant gaps or volatility can increase these losses, particularly for short option strategies. Investment or trading information provided may not be appropriate for all investors, and is provided without respect to individual financial sophistication, financial situation, investing time horizon or risk tolerance. Supporting documentation for any claims (including claims made on behalf of options programs), comparison, statistics, or other technical data, if applicable, will be supplied upon request. Master Trader Consulting, Inc. is not a licensed financial advisor, registered investment advisor, or a registered broker-dealer. Options, futures, and futures options are not suitable for all investors.
