

Some of last week’s comments included the importance of key round-number levels on the S&P 500—7,000, 6,900, and 6,800—which also aligned with high open interest in options. Based on the price action at the time, a decisive close below 6,900 would likely lead to a test of 6,800.
We also noted that Bitcoin warranted close attention, as a daily close below $80,000 could act as a broader risk-off signal and potentially pressure equities.
Last week, those levels were hit.
Bitcoin collapsed toward 60,000, and the software index (IGV) plunged deeper into its bear market. The selling was not orderly. It was capitulatory—the type of climactic move where long institutions and traders hoping for a last-minute miracle finally throw in the towel. Those events tend to create a void of overhead resistance, but they also leave behind emotional damage that does not heal overnight.
The Early-Week Setup: Optimism Returns…Briefly
On Monday, the broader markets gapped lower, but buyers quickly stepped in, rallying prices back above the previous Friday’s high and closing near that level. From a short-term perspective, the S&P 500 looked poised to push above 7,000. The Dow Industrials and Dow Transports both closed near their highs, reinforcing the impression that institutional buyers were back in control.
Meanwhile, Bitcoin and software stocks continued to deteriorate—but at that moment, no one seemed to care. The prevailing mindset was simple: buyers had absorbed the selling, and the path of least resistance appeared higher.
Concerns about an AI bubble bursting? That narrative faded quickly. At least temporarily.
The Cracks Widen: When Leadership Breaks
That confidence did not last.
The strength holding the technology complex together—most notably in semiconductors—began to unravel. Semiconductor stocks, which had been the last line of defense for the bullish tech thesis, started to fail.
Anthropic released a new “legal plug-in” for its Claude AI model, capable of automating complex legal analysis and contract review.
While headlines framed it as an innovation, the market read it differently: AI was now directly threatening the subscription-based business models of software companies.
The question quickly became: How much more pressure can software companies absorb if AI begins to cannibalize their core revenue streams?
The answer came fast.
The Semiconductor ETF rolled over hard. Advanced Micro Devices (AMD) gapped lower by more than 10% and continued to fall. The NASDAQ 100 sliced through multiple support levels, fell below $600, and the S&P 500—exactly as outlined—pushed through 6,900 and down toward 6,800.
At that point, the message was no longer subtle.
Mini-Crash Dynamics: Fear, Bonds, and Rate Volatility
As equities sold off sharply, institutions moved aggressively into bonds—not as a long-term commitment, but as a temporary parking place during the turmoil. That surge in demand pushed yields sharply higher early in the week, with the 10-year Treasury yield peaking near 4.29% before reversing.
In the Green Room, I was asked whether this price action could turn into a “Black Friday”-type event. Based solely on the structure and velocity of the decline at that moment, that possibility could not be dismissed.
Overnight trading only reinforced the fear. Markets continued to slide, and Bitcoin pressed deeper toward 60,000. Sentiment was deteriorating rapidly, and the tone had shifted decisively from confidence to desperation.
The Turn: When Everyone Is Leaning the Same Way
Then something important happened.
As Bitcoin approached the 60,000 level, selling pressure began to dry up. A reversal started overnight and carried into the regular trading session. By the close, Bitcoin had rallied back above 70,000, and equities followed. WOW!
At 10:00 a.m. Eastern, the Michigan Consumer Sentiment survey was released. Sentiment jumped to its highest level since August, and short-term inflation expectations fell to 3.5%, the lowest reading in over a year.
The psychological shift was immediate and dramatic.
In the span of roughly 24 hours, markets went from traders metaphorically “jumping out of windows” to a renewed fear of missing out. Small-caps surged, the Russell 2000 closed sharply higher, and technology stocks rebounded aggressively.
Rotation, Not Rescue
It’s important to understand what last week’s rebound was—and what it was not.
This was not a clean, broad-based resurgence in leadership. It was a rotation under stress.
Capital flowed out of broken leadership groups and into:
- Industrials
- Transports
- Regional banks
- Select cyclicals
That rotation propelled the Dow to new highs above 50,000, even as other indices lagged and many former leaders remained damaged. This divergence is not unusual in a mature market phase, but it is meaningful.
Rotation can keep indices afloat. It can even push them to new highs. But it does not eliminate risk—it redistributes it.
What the Price Action Is Really Saying
Taken as a whole, last week’s market action was not random, and it was not purely news-driven noise.
It was a stress test.
- Key technical levels were tested and respected
- Speculative excess was flushed out violently
- Leadership fractured
- Rotation intensified
- Sentiment swung from extreme fear to renewed optimism in days
This is exactly the kind of environment where discipline matters more than conviction.
Markets like this do not reward prediction. They reward patience, selectivity, and a willingness to wait for confirmation rather than chase emotion.
Where That Leaves Us Now
The S&P 500 has identified 6,800 as an important reference level. The bounce from that area was expected. What happens after the bounce will matter far more. The S&P 500 did not reach an all-time high, and this week we will see whether it does.
Market internals remain neutral, indicating no confirmed bearish trend is in place. However, breadth has weakened, and leadership remains fractured. Those conditions argue for caution, not complacency.
Volatility has increased, correlations have shifted quickly, and headline sensitivity remains elevated. That combination tends to reduce the number of high-probability setups—especially for swing traders.
And that’s okay.
The Discipline This Market Demands
This is not a market that rewards:
- Chasing rebounds
- Assuming support guarantees upside
- Confusing volatility with opportunity
It does reward:
- Letting price confirm direction
- Respecting Major Support and Resistance
- Understanding rotation rather than fighting it
- And being willing to Sit On Hands (SOH) when conditions are not favorable
High-quality opportunities still exist—but they are fewer, more selective, and require more patience than most traders are comfortable with.
The Bottom Line
Last week delivered a powerful reminder: markets can move from complacency to panic—and back again—far faster than most participants expect.
Key levels mattered. Capitulation occurred. Rotation followed. And now, the market is trying to decide whether that was a reset or merely a pause.
We remain cautiously optimistic but disciplined.
As always, we will let price, structure, and confirmation guide our decisions—not fear, not headlines, and not the fear of missing out.
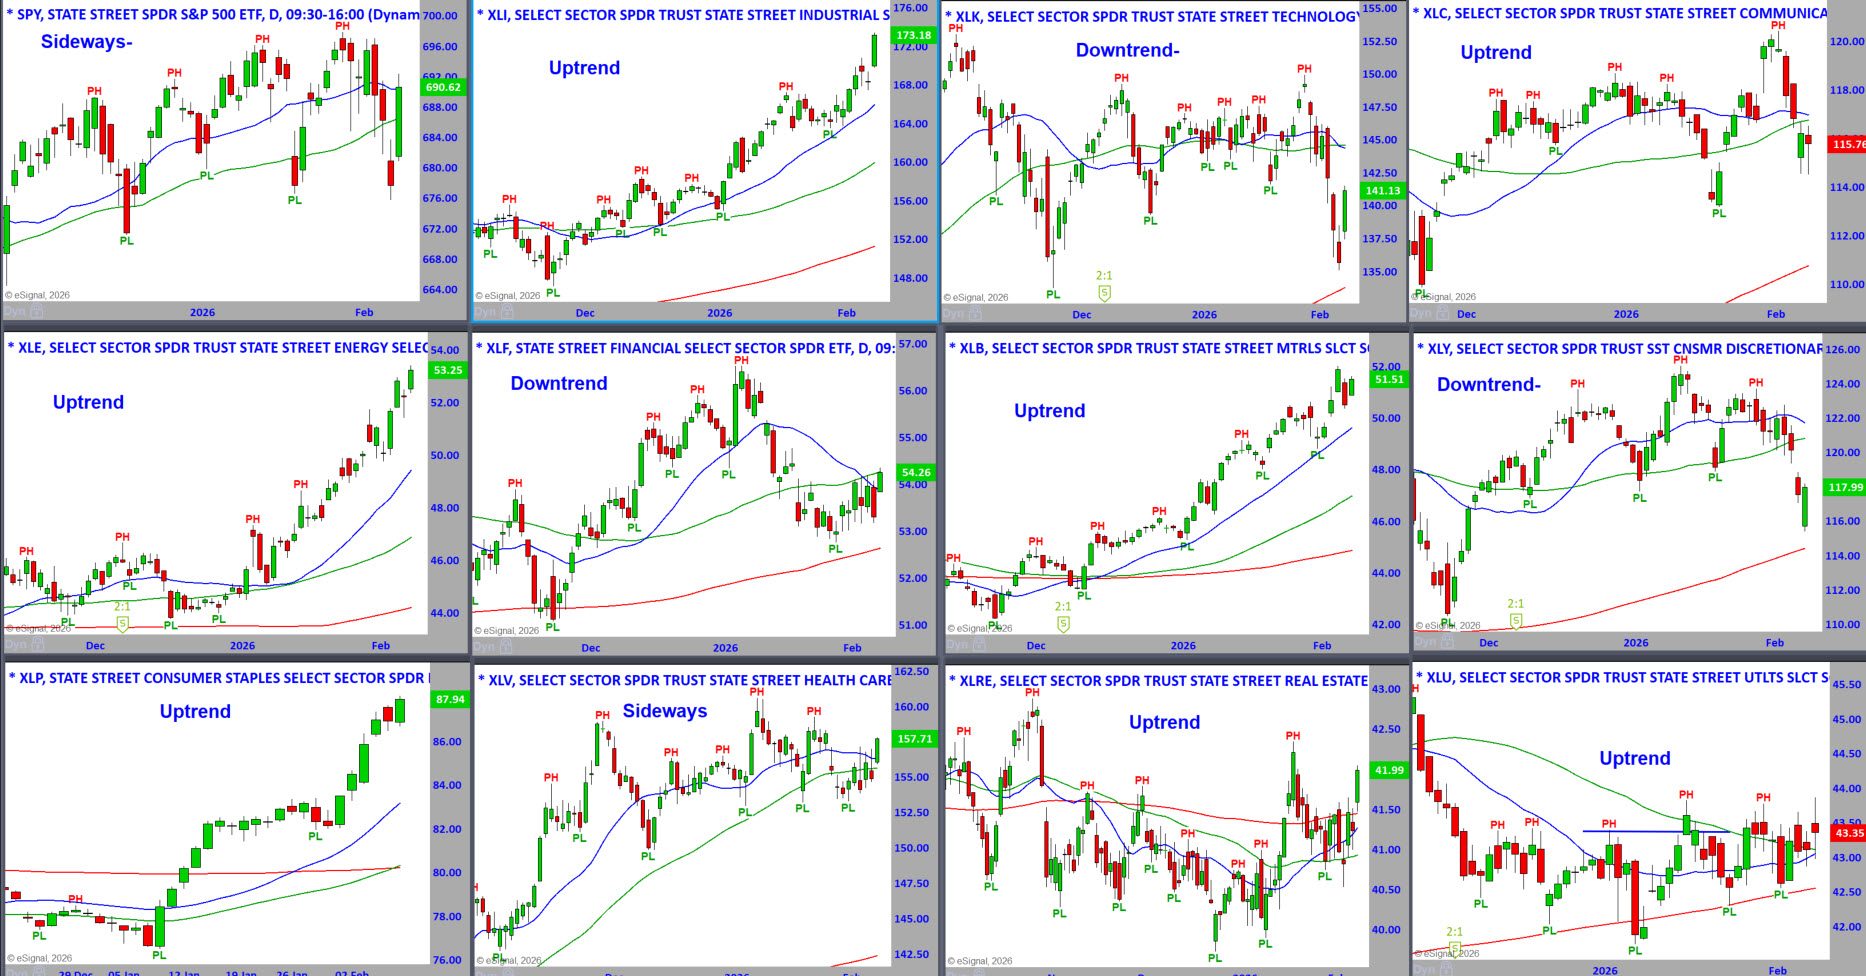
S&P Sector ETFs – Daily Charts - To See a Larger Image,
Right-Click and Press Open in a New Tab
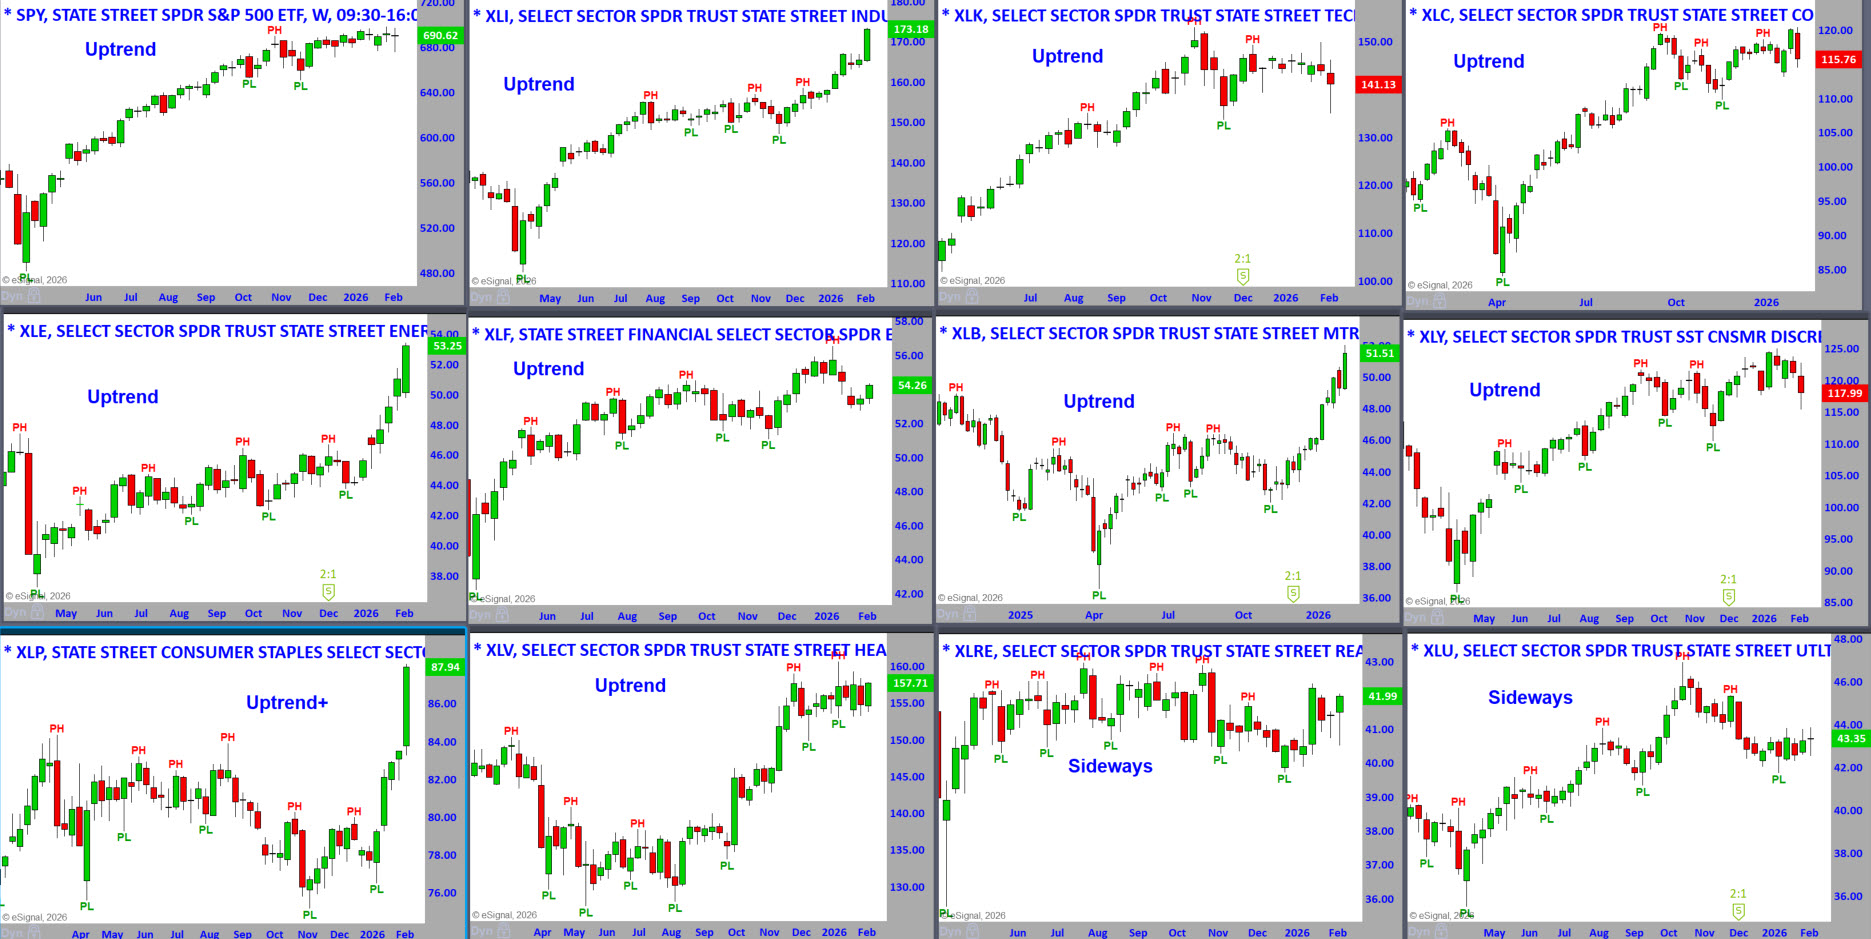
S&P Sector ETFs – Weekly Charts - To See a Larger Image,
Right-Click and Press Open in a New Tab
S&P Sector ETFs – Sorted by Weekly Percent Change This Week
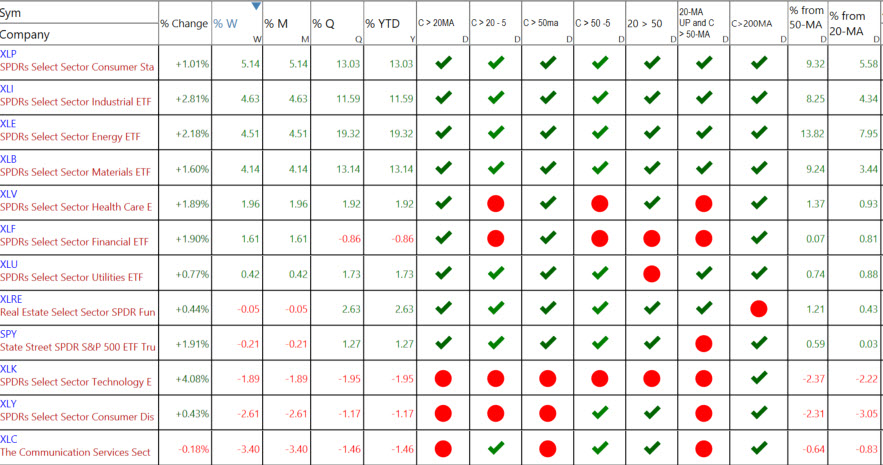
Last week’s percentage changes.
The percentage changes tell you which sectors were the strongest or weakest on Friday and for the week, month, quarter, and year.
There are seven columns after the percent changes in the sector listed above.
You can see the ETFs that are the strongest getting stronger or weakening.
- Close above or below the 20-MA.
- Close above or below the 20-MA 5 Days Ago. C>20 -5
- Close above or below the 50-MA.
- Close above or below the 50-MA 5 Days Ago. C>50 -5
- 20-MA above or below the 50-MA.
- 20-MA is pointed up, and the close is above the 50-MA
Where are the Markets Headed this Week?
Last week delivered one of the wildest reversals we’ve seen in some time, and it also highlighted one of the widest divergences in the market.
Technology—led by software—continues to unravel, while defensive Consumer Staples have surged from bear-market lows to bull-market highs.
At the same time, Dow Theory remains bullish, with both the Dow Industrials and Dow Transports at new all-time highs, even as the NASDAQ 100 broke its short-term uptrend last week.
If I had to draw a picture of this market, it would look like controlled chaos—driven as much by headlines and politics as by fundamentals, what I’ve often referred to as the Trump Effect.
Our internal market gauges remain neutral, but last week’s mini-crash pushed them close to bullish levels. I suspect software stocks are near their bear-market lows and will begin a basing process, not an immediate recovery.
Bitcoin appears to be in a similar position after last week’s capitulatory move.
That said, the sharp pullback and reversal mean we are not seeing many tight, low-risk patterns near support. Trades may still be available, but they will require wider stops and smaller position sizes, which materially changes the risk equation.
One important development was the breakout to new all-time highs in the Equal-Weighted S&P 500 (RSP), suggesting broader participation beneath the surface.
However, Technology, Financials, and Consumer Discretionary remain areas of concern, as all three are in downtrends.
Historically, there has never been a sustained bull market where these three economically critical, heavily weighted sectors were all weak at the same time.
When leadership fractures this way, markets typically transition into correction phases or extended choppy environments rather than clean, trending advances. For now, the evidence suggests rotation, not collapse.
Capital has shifting into defensive and cyclical areas while former leaders reset.
That process can support the market, but it also means selectivity, patience, and disciplined risk management are more important than ever.
Chasing strength has rarely been rewarded, except in the very short term.
DOW JONES
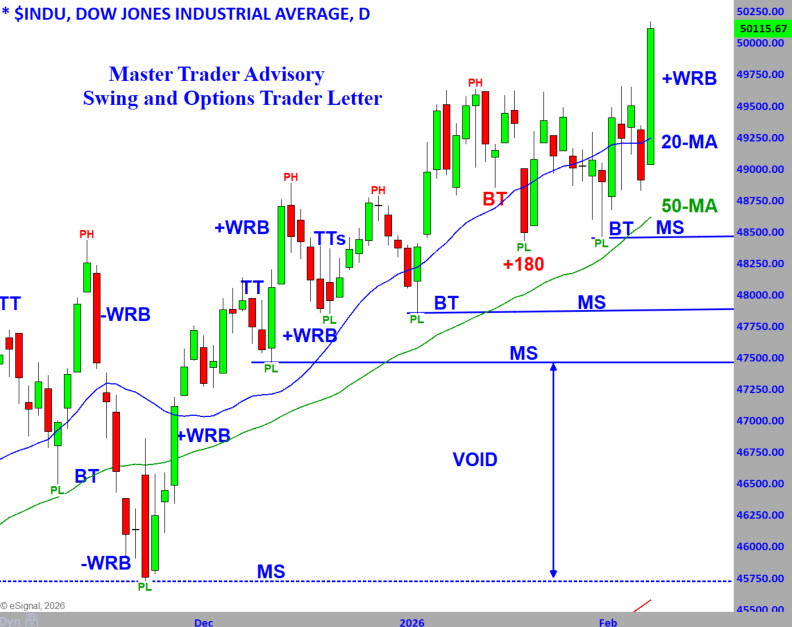
The chart above shows the Dow Jones Industrial Average through the lens of Master Trader Technical Strategies (MTS).
The Dow remains in a well-defined uptrend, characterized by higher highs, higher lows, and rising moving averages, with the 20-MA above the 50-MA. That structure alone keeps the intermediate-term bias pointed higher.
That said, the price action has been persistently erratic. Despite the whippy behavior, buyers have consistently stepped in on pullbacks. A good example was the +180 bullish reversal, followed by a successful retest that formed a Bottoming Tail (BT)—a classic sign of demand defending price.
From a bias standpoint, the chart supported higher prices.
From a trading-plan standpoint, it did not.
Under Master Trader Technical Strategies (MTS), erratic, overlapping price action does not qualify as a buy signal—even when the trend is up. Directional bias and executable trades are not the same thing.
You might reasonably ask: Why not buy the breakout above the highs?
Yes—you could have.
But let’s walk through what that trade actually required.
On Friday, the Dow opened roughly 124 points above Thursday’s close and held within its opening range. To decisively break out from the month-long trading range, price needed to travel roughly another 635 points, implying a total move of about 760 points from the prior consolidation. A logical stop would have had to be placed below Friday’s low, meaning risk expanded quickly.
What happened next was dramatic.
The Dow surged roughly 1,206 points on the day, forming a Wide Range Bar (+WRB)—a clear signal of institutional urgency and higher prices ahead.
So yes, the move was bullish.
But here’s the rub, and it matters.
My trading plan is designed to buy breakouts from tight consolidations, not from erratic, whippy ranges. History shows that sloppy price action tends to stay sloppy until it contracts. Chasing expansion after disorder is not part of the plan—even when it works.
That discipline means something important:
There is still no trade in the Dow based on my plan.
What now?
Now we wait.
We look for prices to tighten, digest the +WRB, and form a recognizable pattern that aligns with the plan. That process could take a day, several days, or longer—we don’t know yet, and we don’t need to know. Our job is not prediction; it’s preparation.
Until that happens, we stand aside and deploy capital in other instruments that do meet our criteria.
With Friday’s breakout and new high, we have now marked a higher level of Major Support (MS) near the Bottoming Tail and rising 50-MA. As long as price holds above that area, the uptrend remains intact. A decisive close below MS would be the first technical evidence that the trend is changing.
Until then, the Dow is bullish—but patience, not participation, is the correct position.
VIDEO REVIEW OF MARKETS, SECTORS, AND INTERNALS - Click lower right to open Full Screen. This IS the Advisory Update - Not ETF :)
NEW STOCK TRADING IDEAS Below
NOTE: Please see the document in RESOURCES entitled Master Trader Guidelines for Trading the Open and Gaps.
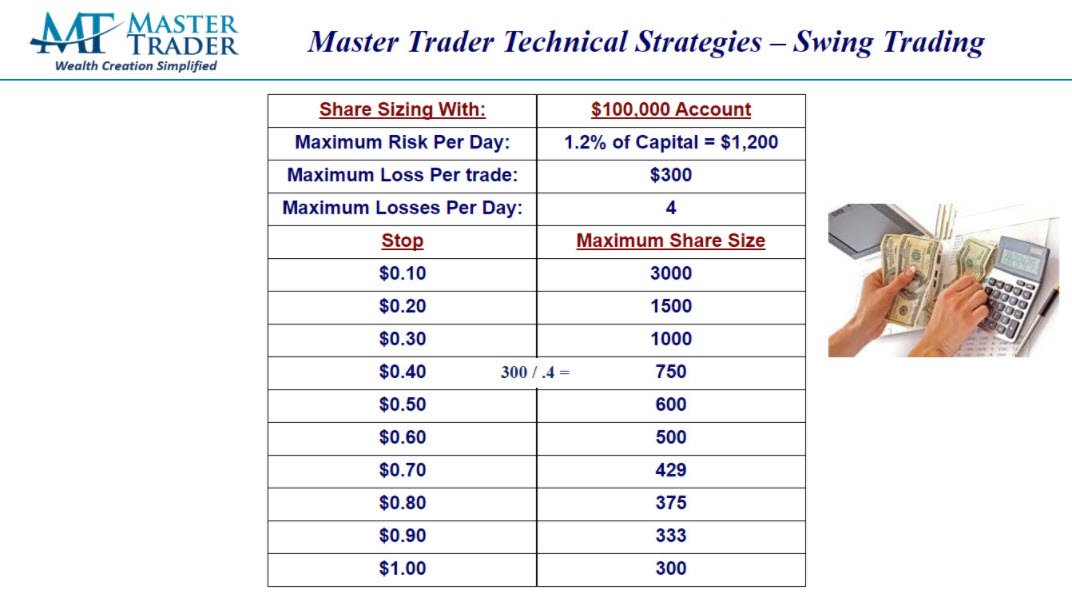
Note on Position Size Calculation in the Open Trades Sheet:
All trades are based on a hypothetical Max Loss of $300/trade. For Stocks, that is $300 / (Entry - Stop). Directional option trades use the same formula, then divided by 100, rounded down to the nearest whole number, with a minimum of one (1).
The “Master Trader Blended Method” for shorting options/spreads size starts with the stock position size, multiplying by 1.5, then divide by 100 because 1 contract represents 100 shares.
Please calculate position size according to your Max Loss per your Trading Plan.
Here's an example:
AMS Teaches You How to Maximize Profits on Every Trade. Click Here to Read More
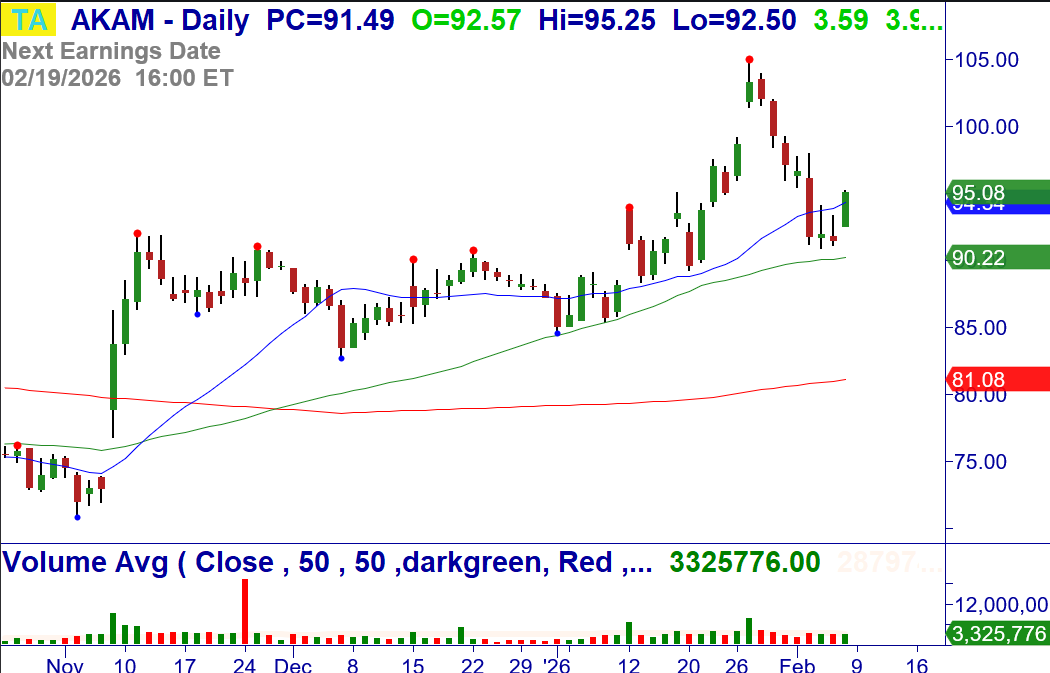
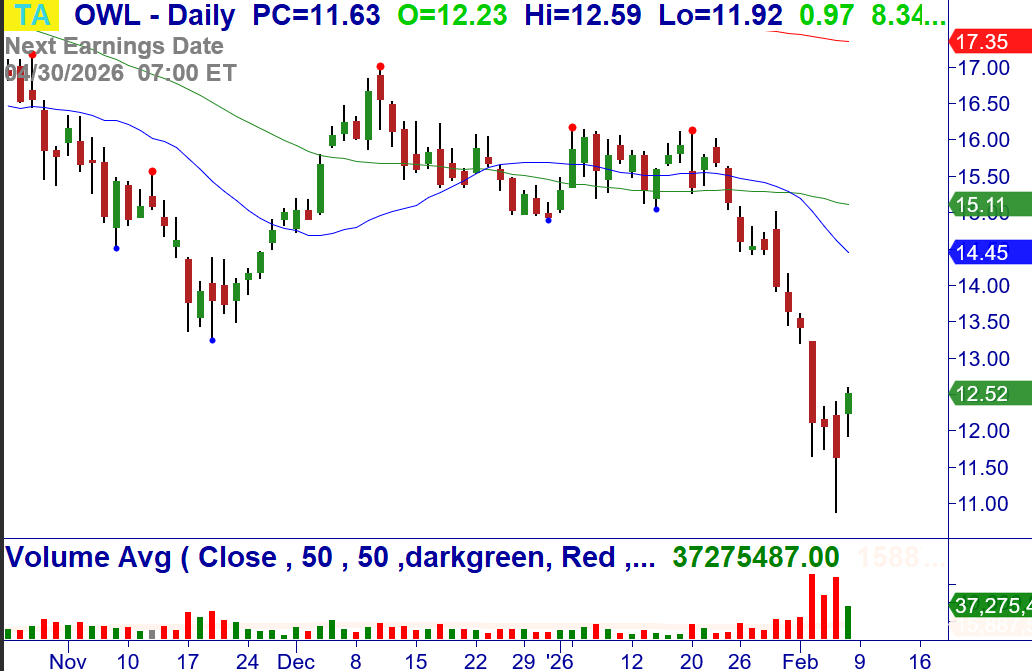
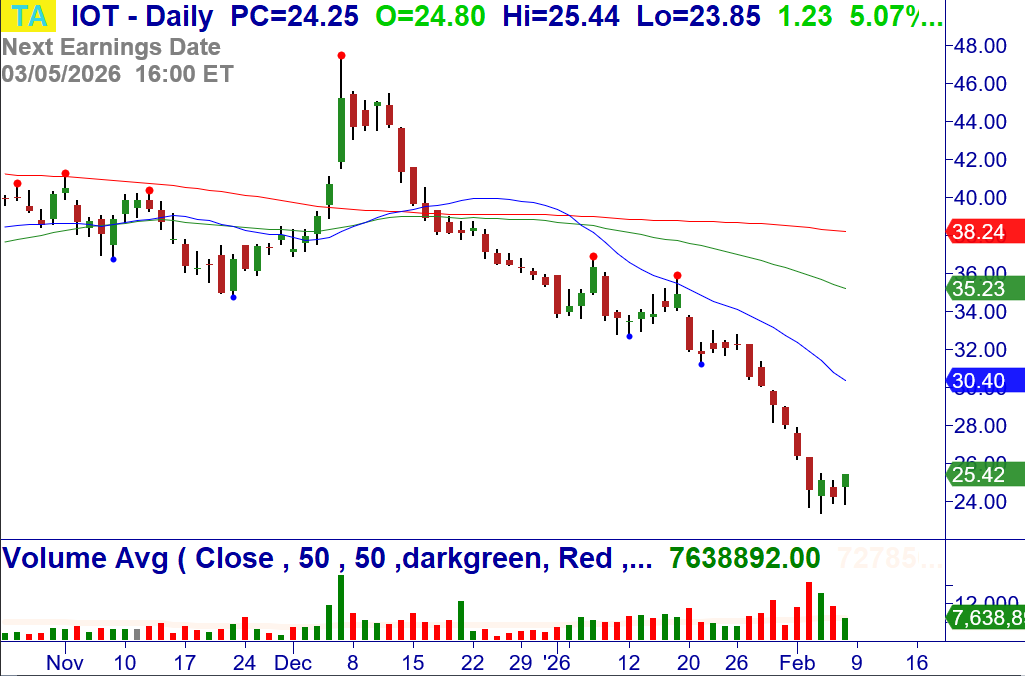
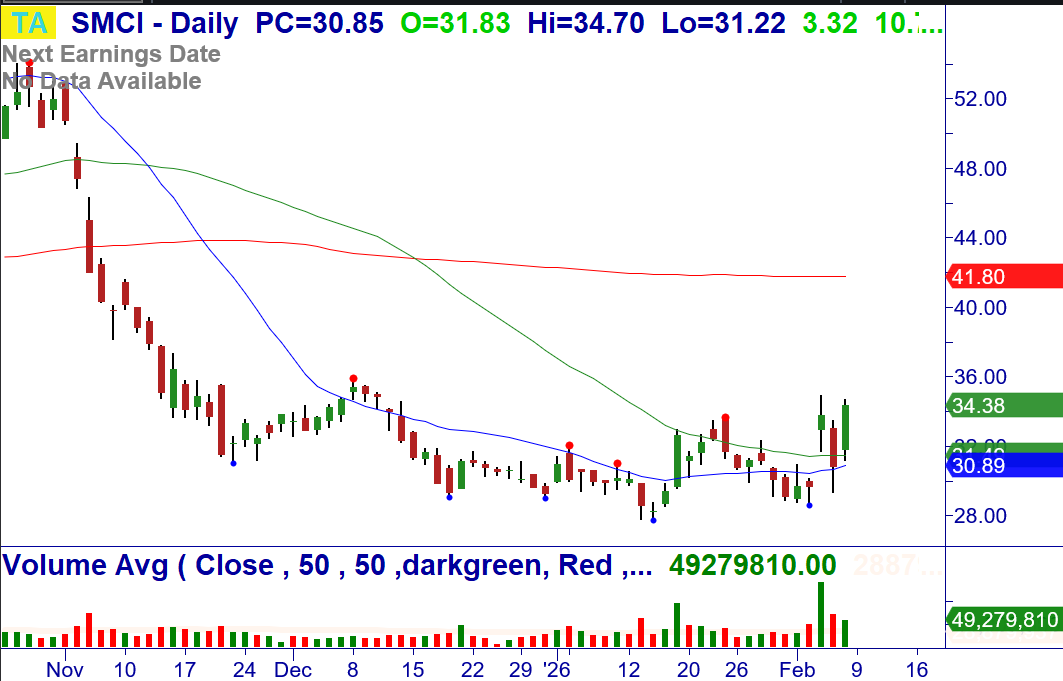
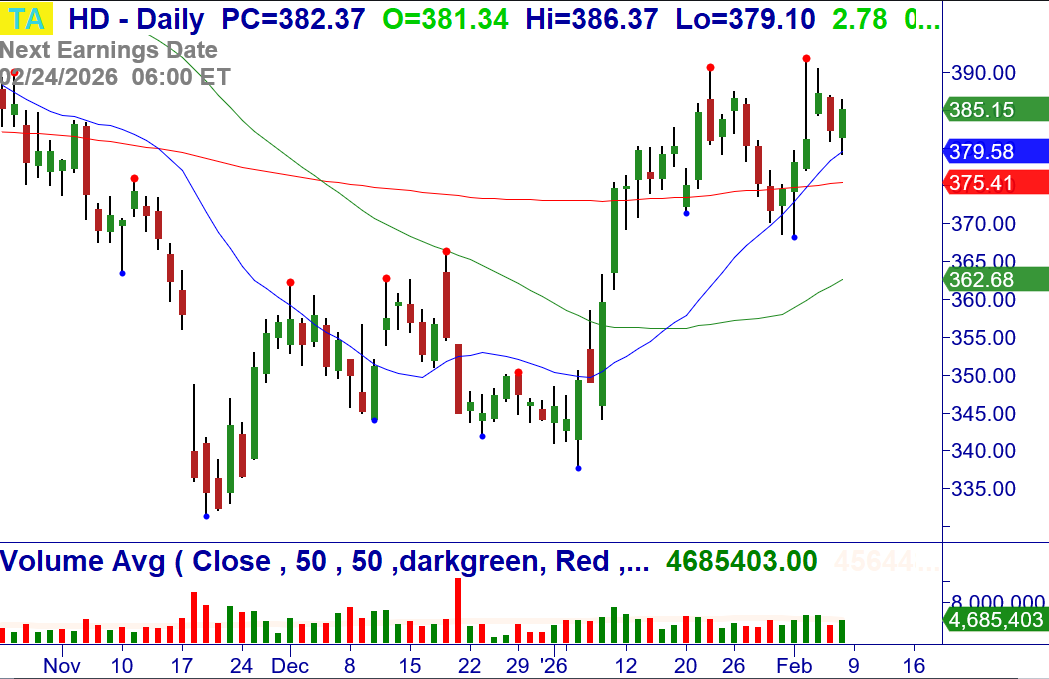
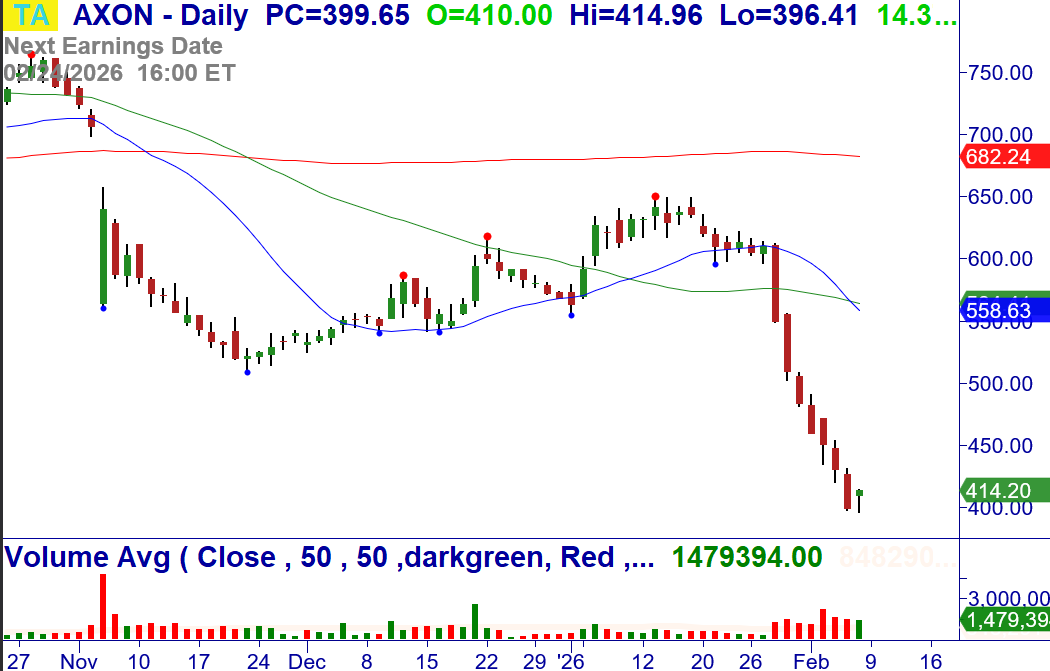
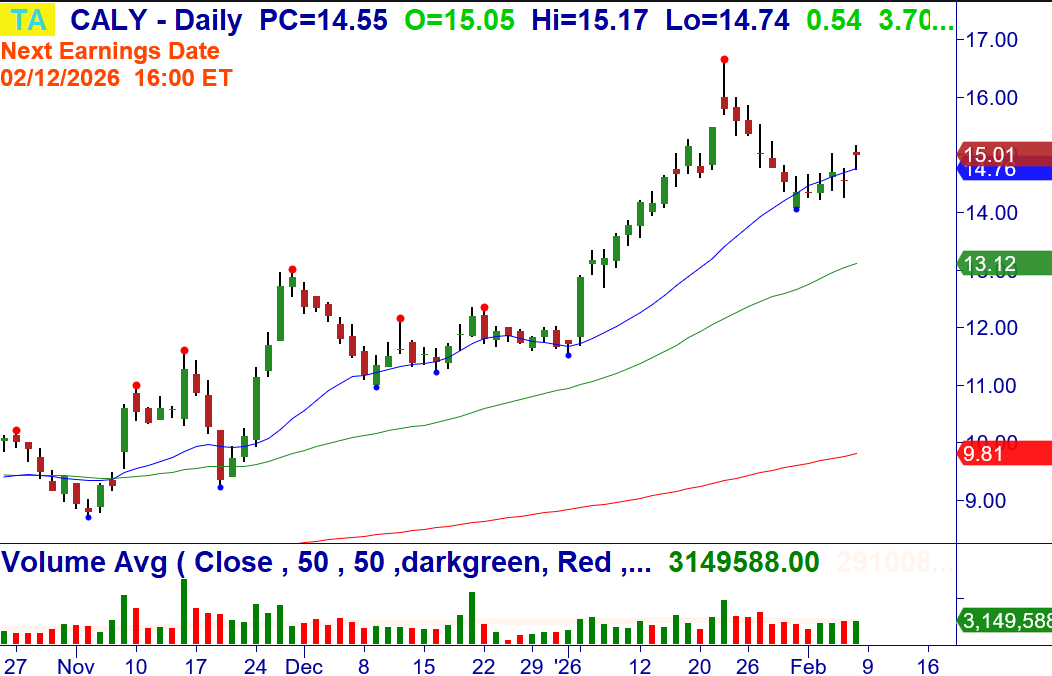
2/9: SMCI – Over $34.70, consider buying the stock. +180 Breakout of a bottoming pattern at the 20/50-MA. Stop $29.88.
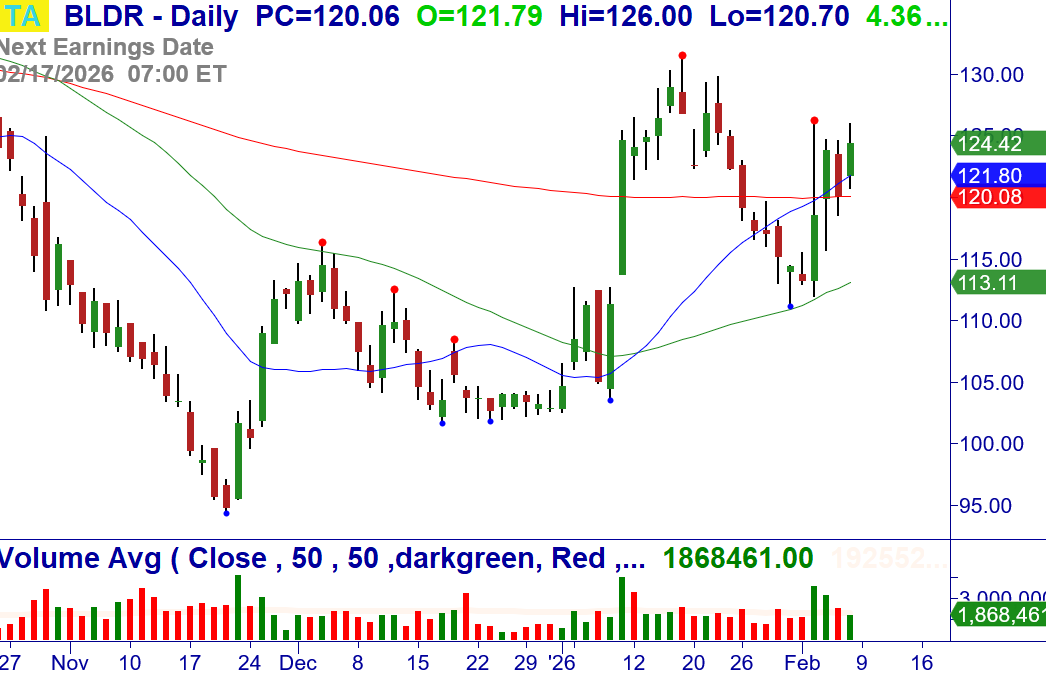
2/9: BLDR – Over $126.00, consider buying the stock. Bear Sandwich +180 Breakout at the 20/200-MA. Stop $119.28.
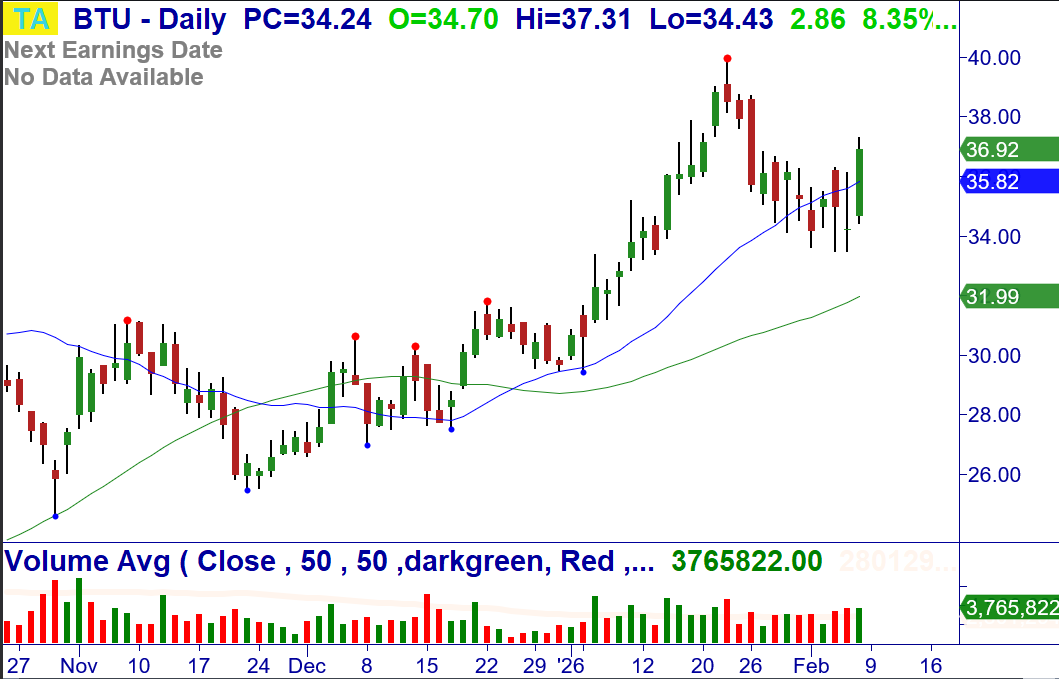
2/9: BTU – Over $37.31, consider buying the stock. +WRB Breakout at the 20-MA. Stop $34.38.
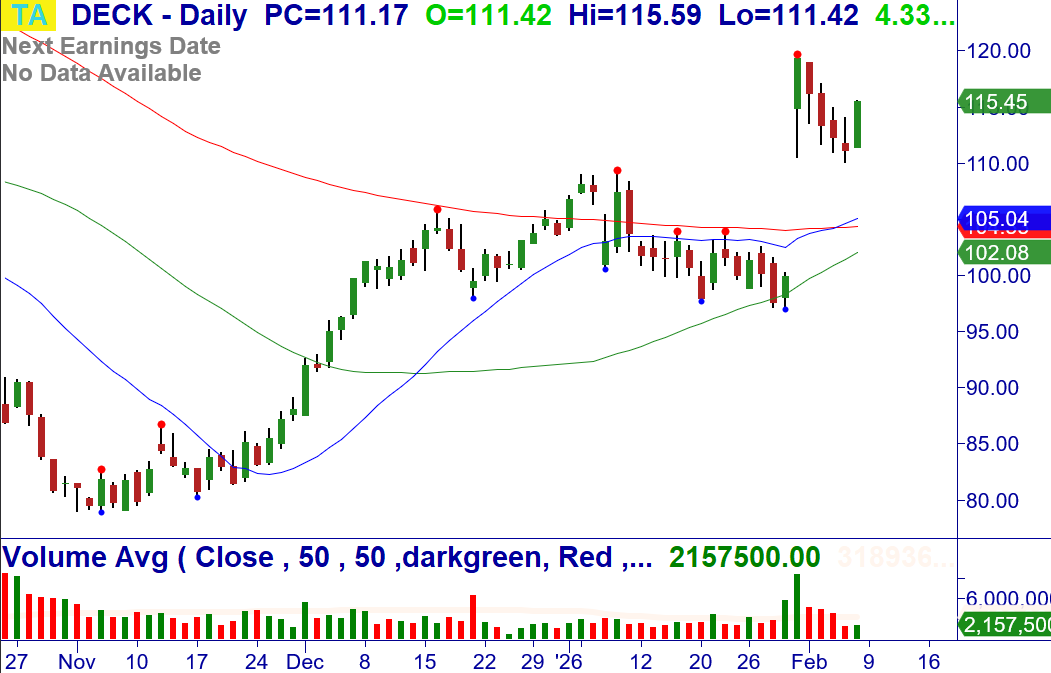
2/9: DECK – Over $115.59, consider buying the stock. Buy Setup and reversal after Pro Gap Breakout. Stop $108.88.
Money Management for Trading and Investing
Proper money management for investing and Trading starts with position-sizing based on the amount of money you are willing to risk on a signal trade.
CLICK HERE to review these Master Trader Guidelines and Basic Money Management and Position Sizing Table.
NEW OPTIONS TRADING IDEAS
Directional Options Strategies and Debit Spreads for Swing Trading (See the Weekly Options Trader letter, which sells options/spreads for weekly Income that primarily expire in 10 days or less, CLICK HERE)
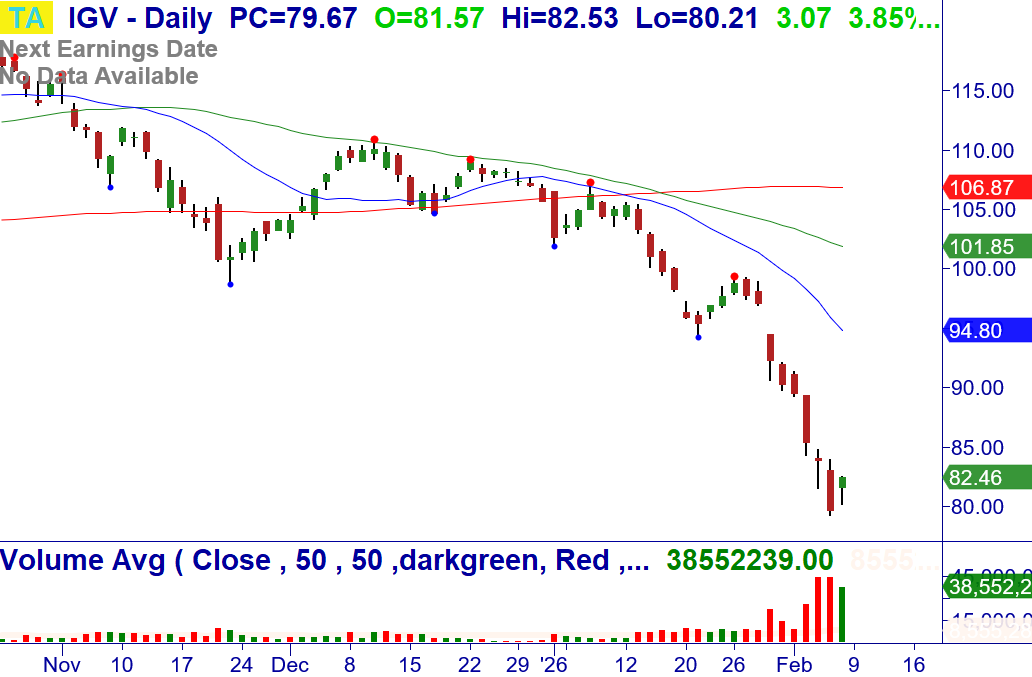
2/9: IGV – Over $83.93, consider shorting Feb (2/20) $78 puts credit spread for a limit of $.80/share (closed at $.97/share). Climactic Buy Setup and +180 reversal on +Vol. Stop – None, will roll or take an assignment.
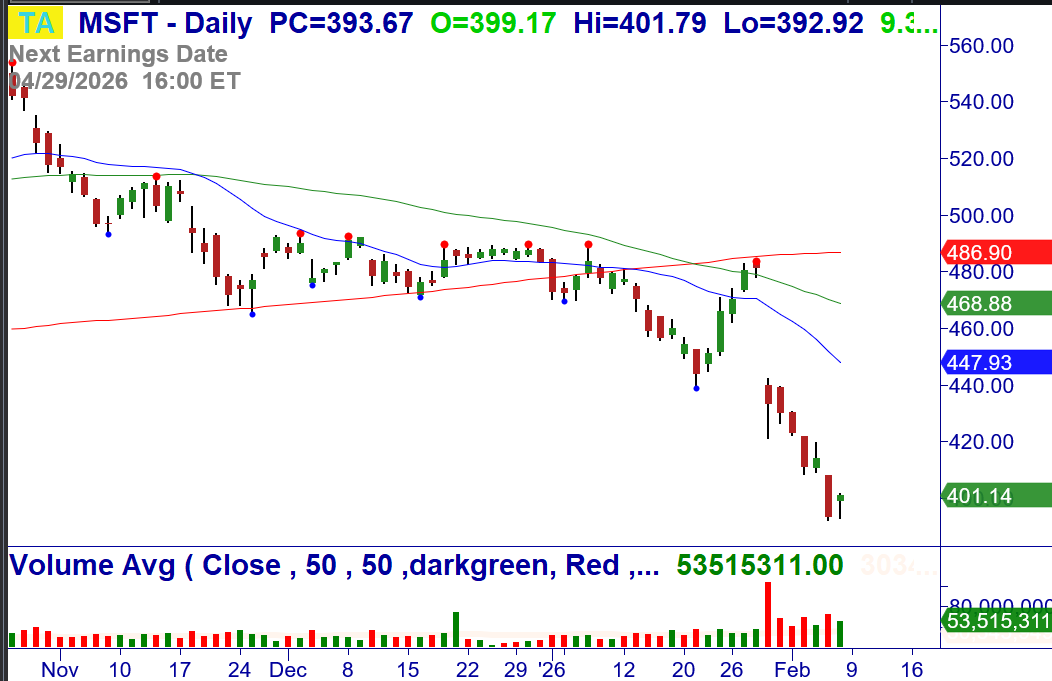
2/9: MSFT – Climactic Buy Setup and +180 reversal, long call watch.
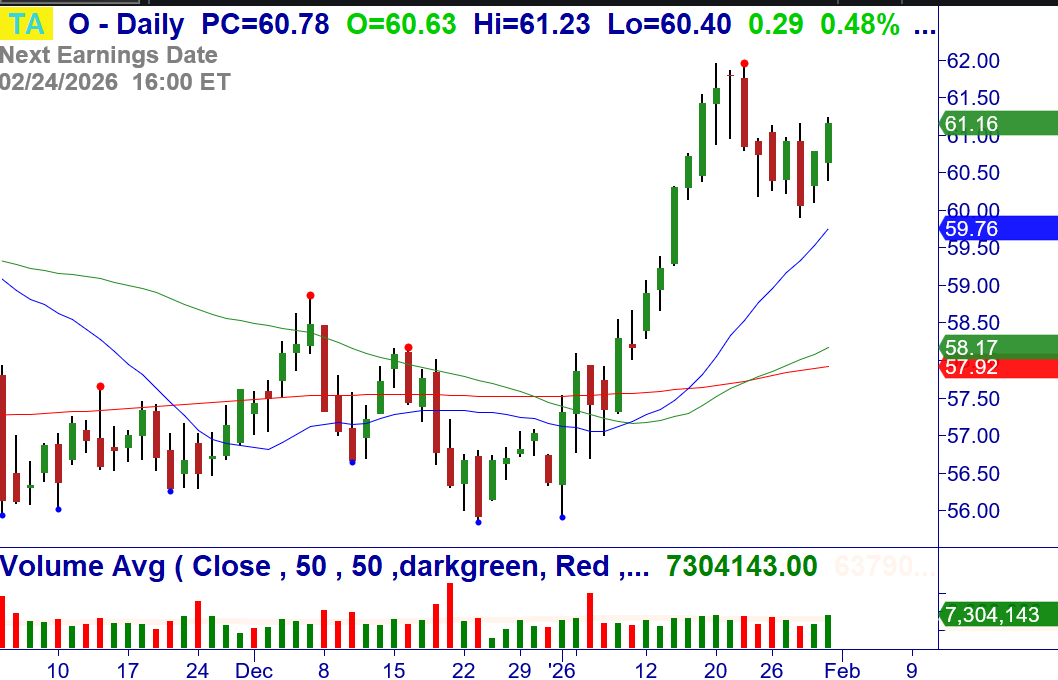
2/2: O – Over $61.23, consider buying Feb (2/20) $60 calls for a limit of $1.75/share (closed at $1.73/share). Bull Flag Breakout at the 20-MA. Stop $59.88.
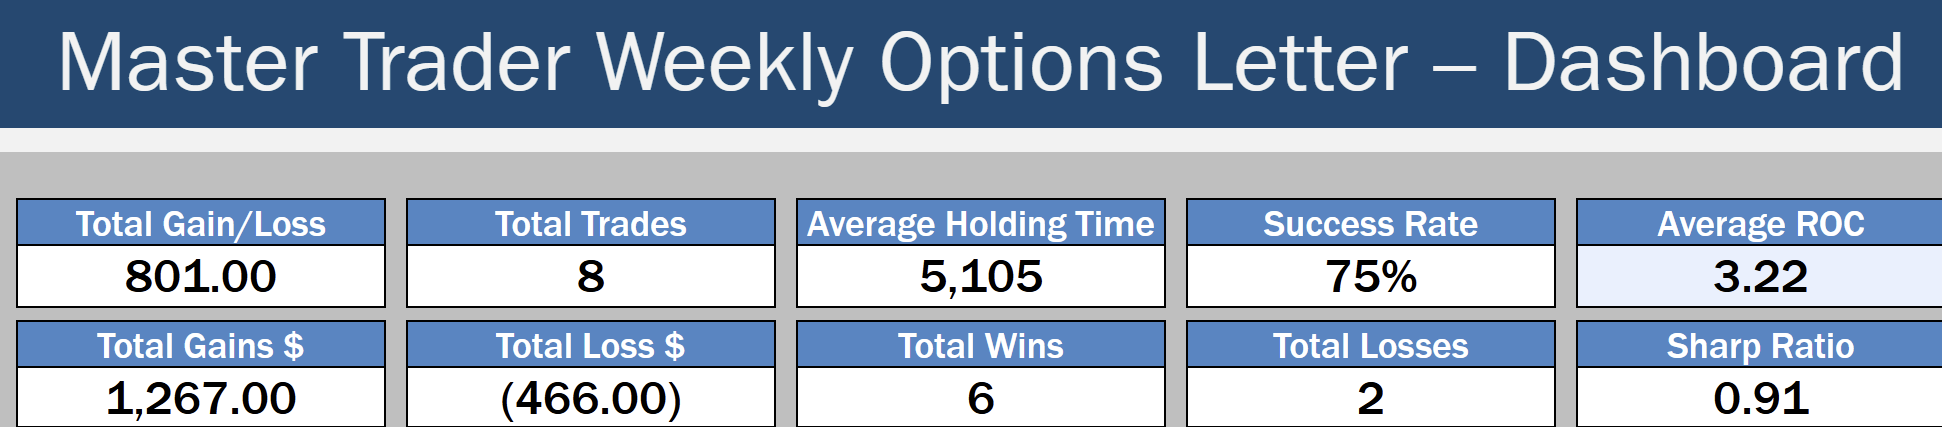
The Master Trader approach to selling credit spreads around technical turning points.
Read about the Weekly Options Trader letter, which sells options/spreads for weekly Income that primarily expire in 10 days or less, around Master Trader technical turning points, CLICK HERE
By selling spreads on stocks and ETFs where MTS indicates price is unlikely to go, we become the “smart money,” getting paid to take calculated, well-defined risk.
Check out the blog article with more information and monthly results, CLICK HERE
Professional consistency, short-duration trades, and risk-controlled income — that’s what defines the Master Trader approach.
Because your success is vital to you – and us.
Before selling options or credit spreads, we urge you to review the valuable and detailed information that we have provided for you in your Member’s Area Resources.
A quick simplified approach to calculating contract size is to simply base your contract size based on the number of shares permitted in your Trading Plan as if you were trading the stock or ETF. Simple Share Sizing = $ Risk / Stop Loss
The amount of money that you are willing to risk – divided by – the stop loss amount. For example, $100 / .20 = 500 shares. Credit Spread example, if your Trading Plan allowed you to trade 543 shares of AAPL based on the stop loss, then simply round down to the nearest hundred and short an equivalent number of contracts of the option. Since 1 contract represents 100 shares of the underlying, this would be five (5) contracts.
Master Trader and You Building Your Financial Future Together!
Good trading!
If you have any questions or comments, please e-mail Greg Capra at Greg@mastertrader.com or Dan Gibby at Dan@mastertrader.com
All the best,
Greg Capra Managing Director of Master Trader
Dan Gibby Chief Options Strategist
NOTE: Master Trader will show the opening and closing prices of all stock and options trades. We recommend that all traders and investors use proper share sizing for positions and money management. However, we cannot recommend what that is for your particular trading style, risk tolerance, or account balance. We urge you to calculate your own share/position size based on your individualized risk parameters, Trading Plan, and familiarity with the proposed trade strategy and risk. Advanced Management Strategies (AMS) covers in detail foundation and advanced position and money management.
NOTE: Master Trader and its representatives may have existing positions in actual or other trade recommendations before or after suggested herein. Additionally, we may manage them differently for internal purposes based on different risk parameters than noted herein. All trade ideas and content are for informational and educational purposes only. It is not, nor is it intended to be, trading or investment advice or a recommendation that any security, option, or investment strategy is suitable for any person. Trading securities can involve high risk and the loss of any funds. Significant gaps or volatility can increase these losses, particularly for short option strategies. Investment or trading information provided may not be appropriate for all investors, and is provided without respect to individual financial sophistication, financial situation, investing time horizon or risk tolerance. Supporting documentation for any claims (including claims made on behalf of options programs), comparison, statistics, or other technical data, if applicable, will be supplied upon request. Master Trader Consulting, Inc. is not a licensed financial advisor, registered investment advisor, or a registered broker-dealer. Options, futures, and futures options are not suitable for all investors.

