

Some of last week’s comments included:
Most indices and sectors, the last two weeks have been persistently choppy and uneven, creating an extremely selective trading environment. This is not a market rewarding broad exposure.
Despite a sharp drop in USD/JPY late last week, U.S. equities largely brushed it off. That doesn’t mean it’s irrelevant—it means it’s something to monitor, not predict. Time will tell whether it becomes a meaningful driver.
The market continues to test traders’ patience—and discipline.
Over the last two weeks, most indices and sectors have displayed persistently choppy, uneven price action. This is not a market rewarding broad exposure or passive participation. Instead, it is demanding selectivity, timing, and risk control.
Leadership has narrowed, rotations have been abrupt, and reactions to news have been exaggerated in both directions.
That environment persisted last week.
Despite a sharp drop in USD/JPY that continued last week, a move that historically would have raised concern about global risk appetite, U.S. equities largely shrugged it off again. The Dollar rebounded later in the week from an extended technical move lower. President Trump's new pick for Fed chairman may have influenced the extended moves and retracement in that. Currency dislocations often matter later than traders expect, not immediately when headlines hit.
A News-Driven, Bipolar Tape
It was another volatile, news-driven week.
Markets started strong and rallied into Wednesday, aided by selective earnings reports that lifted pockets of the technology sector. Traders were also positioned ahead of the Fed chairman’s commentary, hoping for confirmation that rate cuts are still on the table.
That optimism faded quickly.
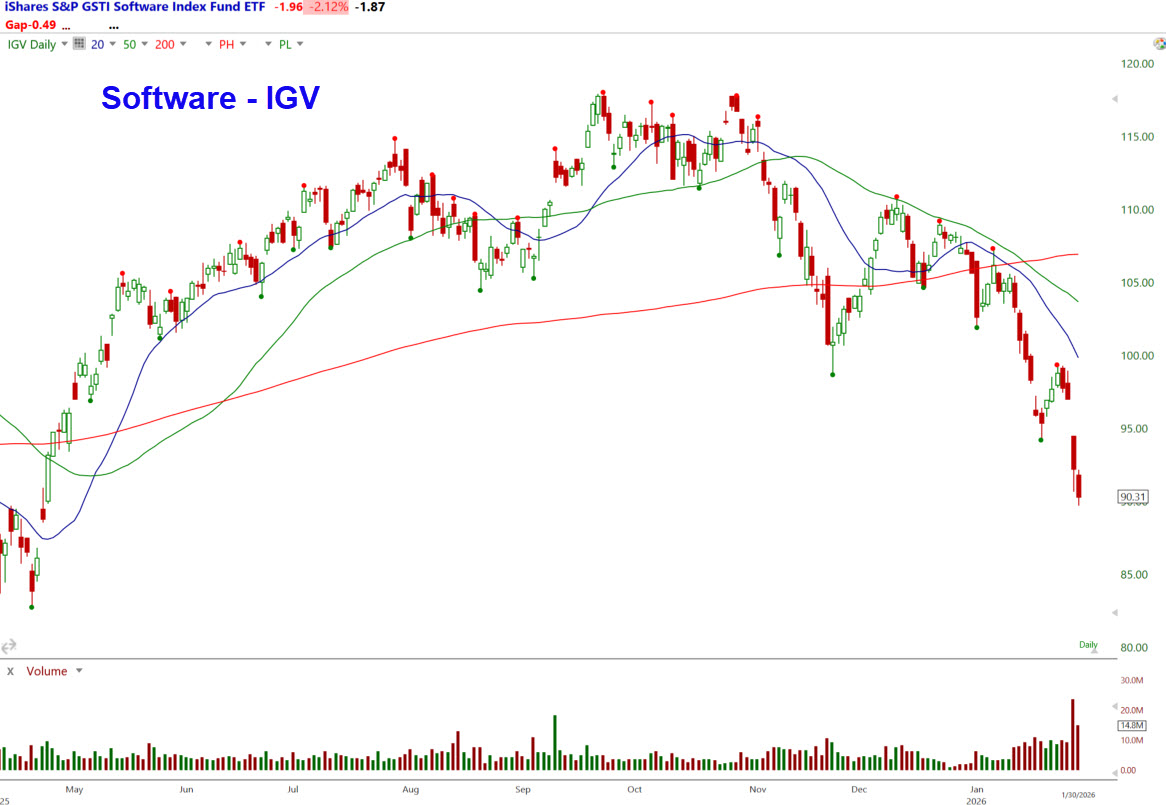
Later in the week, Microsoft’s earnings and guidance triggered a sharp drop. The stock gapped lower by nearly 10%, and the damage didn’t stay contained! Software ETFs such as IGV and XSW were dragged into bear-market territory (IGV is more than 20% below its October high), with no meaningful bottoming action evident. That type of price behavior implies further downside risk rather than immediate stabilization.
On the other side of the ledger, META gapped sharply higher on strong results, breaking its downtrend. This perfectly illustrates the current environment: earnings are creating extreme dispersion, not broad-based participation.
Meanwhile, UnitedHealth Group (UNH) weighed heavily on the Dow after a White House proposal to keep Medicare rates flat rather than implementing the anticipated 5% increase. UNH dropped nearly 20% on weak guidance, reminding traders—again—that single-stock risk remains elevated. That news on Medicare rates had a broad-based effect on the healthcare
Software ETF - IGV
Inflation: Still Sticky, Still a Headwind
Inflation data set the tone early in the week.
Hotter-than-expected readings reinforced the narrative that the Federal Reserve may need to keep rates higher for longer. As expected, there was no rate cut. The PCE price index—the Fed’s preferred inflation gauge—came in at 2.8% year-over-year, underscoring the reality of sticky inflation.
Businesses are increasingly passing on higher costs to consumers, complicating the “imminent cuts” narrative. The bond market and equities may want easier policy, but the Fed remains hesitant. Someone will blink—we just don’t know who yet.
In addition, amid concerns about sticky inflation and the risk of further deterioration, the price of crude oil has risen by over 10% since the takeover of Venezuela. Also mentioned in last week’s letter was the rising agricultural stocks and materials.
Markets need liquidity like a junkie needs drugs to stay happy. It will be a while before Trump’s new Fed chairman is approved, and Powell does not favor a cut, and the data is confirming his view, so the market has to accept that the next cut isn’t coming anytime soon.
So the markets need another reason to push higher. Most of the big earnings are out, and while overall they were good, the markets are about the same.
Index Structure: Levels Matter More Than Headlines
The NASDAQ 100 briefly broke above trading-range resistance that had been in place since December, then reached the October high and fell back to roughly where it closed the prior week. Structurally, it remains in the middle of a wide trading range that has existed since October 2025.
From a technical perspective, last week’s breakout attempt, followed by a retracement to the rising 20- and 50-day moving averages, is normal. Based on the advance from the January 20, 2026, low to last week’s high, buyers should want to step in here if the bulls intend to defend the trend. How price reacts in this zone will tell us far more than any commentary.
The S&P 500 also pushed to a new all-time high before retracing sharply on Thursday. Friday traded entirely within Thursday’s range, and on a closing basis, the index is effectively unchanged from its October 29, 2025, level.
That alone is telling.
The 6,900 area has become pivotal. A close below 6,900, and more importantly, below last week’s low, raises the probability of a test of 6,800, which represents Major Support—defined by the low preceding a higher high.
The Russell 2000 has formed what appears to be an upside shakeout and is now pulling back toward minor support within its broader uptrend. This is constructive behavior, not a breakdown—yet.
The Dow Jones Transportation Average and the Dow Industrials have both been correcting sideways from new all-time highs. According to Dow Theory, confirmation from both indices at new highs supports the conclusion that the primary trend remains bullish, even if the short-term path is messy.
Not Everything Is Bullish
Despite indices near record levels, the picture is not rosy everywhere.
Metals experienced a violent reversal. Precious and industrial metals reversed dramatically from extended uptrends, wiping out trillions in value.
After extended uptrends, precious and industrial metals were hit with extreme profit-taking. Gold plunged from near 5,600 to roughly 4,700 before stabilizing. Silver collapsed nearly 40% from Thursday’s high to Friday’s low—one of the worst drops on record. Copper fell approximately 12%, while palladium, platinum, and steel also declined.
Regardless of the narrative attached to the move—whether it was Fed speculation or political commentary—the price action itself was textbook: an overextended trend meeting panic liquidation. When markets reach that point, the bullish reasoning is over. It becomes a “sell at any price” event.
Crypto: Support Failed
Bitcoin and Ethereum both broke below two-month support levels. Sideways consolidation since mid-October resolved lower last week, signaling buyer exhaustion. Unless these moves prove to be breakdown failures—and quickly—the path of least resistance points to lower prices, potentially through a waterfall-type decline. As we finalize this report, /BTC is trading at 77,500, a big drop from Friday's price at 4 ET.
This breakdown aligns with the broader theme: speculative excess is being repriced.
January Is Over—Now What?
With January behind us, it’s worth revisiting the so-called “January Effect,” where small-caps and underperformers often rally early in the year. The Russell 2000 gained over 5% for the month, outperforming large caps. However, last week’s pullback suggests profit-taking amid broader caution.
Historically, a positive January has been associated with strong annual returns. But markets don’t move on statistics alone. They move on liquidity, expectations, and behavior.
And then there’s the wildcard: the “Trump Effect.” 😊
Volatility Persists—So Does Risk
Looking ahead, economic data next week—particularly inflation-related reports—could easily act as a catalyst for another short-term swing. If the S&P 500 decisively breaches 6,900, the odds increase for a move toward 6,800.
Internal market gauges remain neutral, which is important. They are not signaling risk-off, but they are not providing a strong tailwind either. Breadth remains below the zero line, confirming that most stocks are underperforming, even as indices hold up.
That divergence is both a warning and an opportunity. If money rotates into laggards, breadth can improve without indices collapsing. If it doesn’t, leadership deterioration becomes more dangerous.
Bottom Line
Institutions are acting like a herd—hesitating, reacting to headlines, and rotating capital aggressively. That behavior has created longer periods of indecision, punctuated by sharp moves in both directions.
Being complacent in this environment invites a financial spanking.
Our edge remains in respecting structure, identifying rotation, managing risk, and being willing to sit on our hands when probabilities are not aligned.
This is not about catching every move. It’s about staying aligned with the Techno-Fundamentals—and surviving long enough to capitalize when clarity returns.
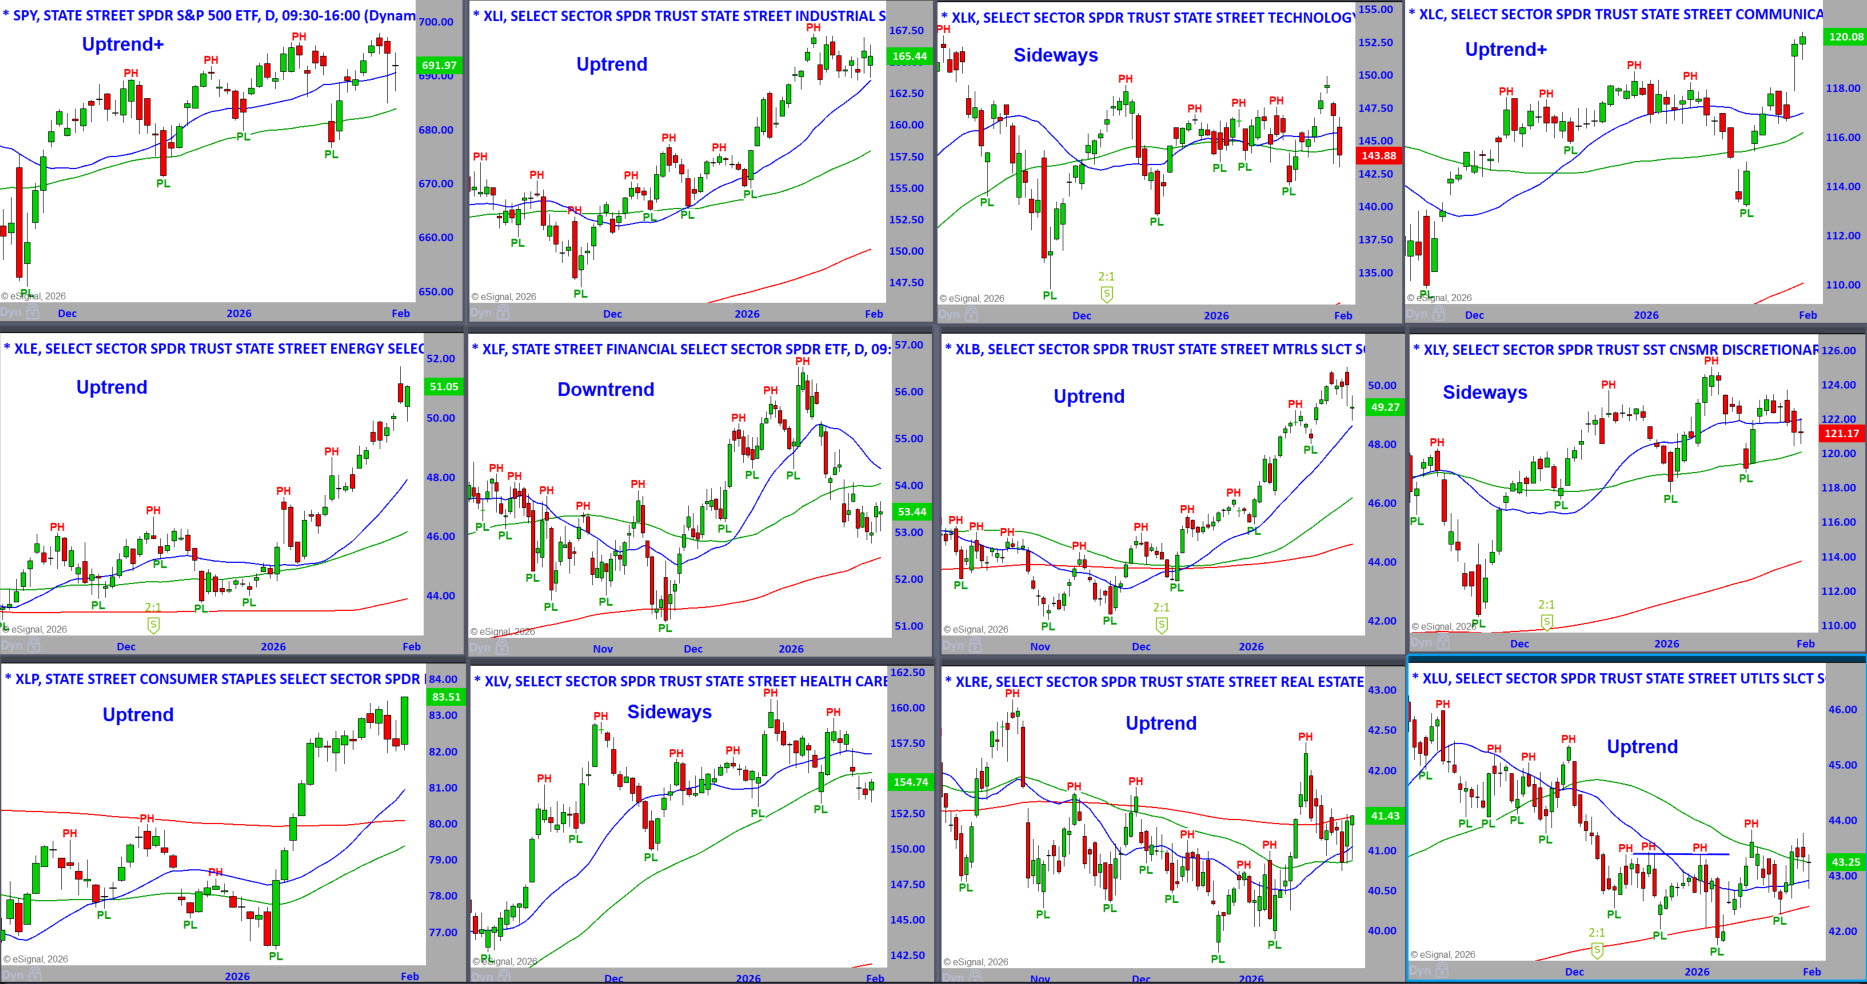
S&P Sector ETFs – Daily Charts - To See a Larger Image,
Right-Click and Press Open in a New Tab
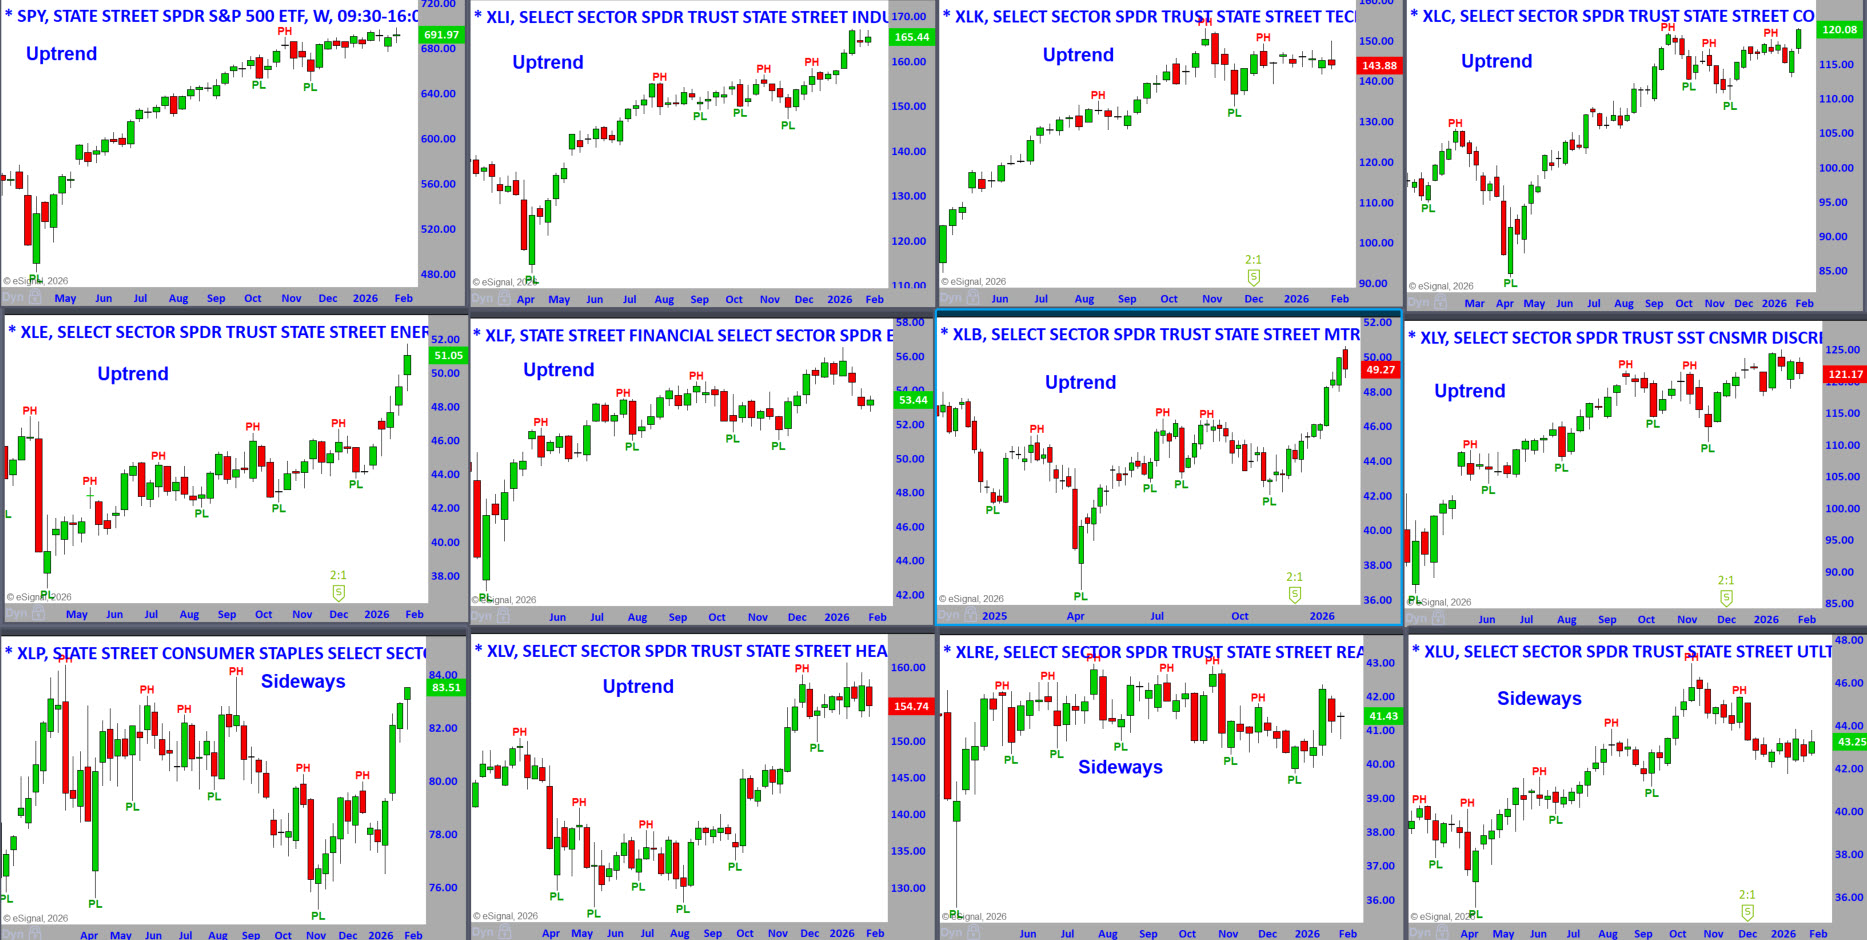
S&P Sector ETFs – Weekly Charts - To See a Larger Image,
Right-Click and Press Open in a New Tab
S&P Sector ETFs – Sorted by Weekly Percent Change This Week
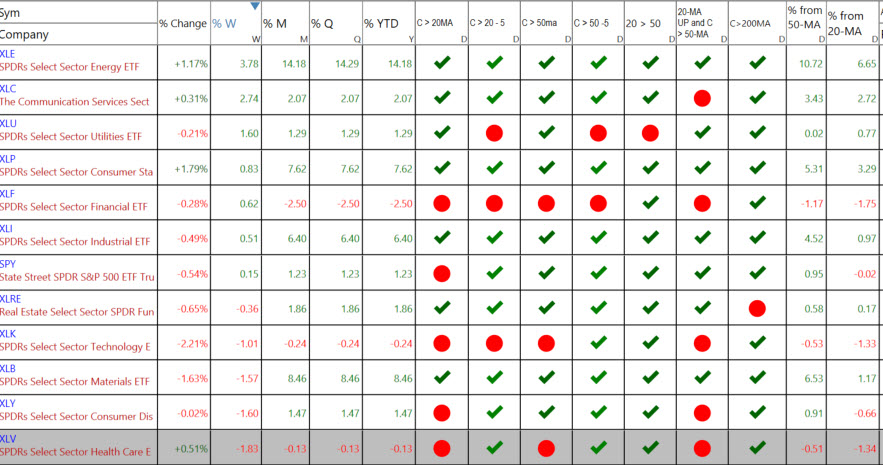
Last week’s percentage changes.
The percentage changes tell you which sectors were the strongest or weakest on Friday and for the week, month, quarter, and year.
There are seven columns after the percent changes in the sector listed above.
You can see the ETFs that are the strongest getting stronger or weakening.
- Close above or below the 20-MA.
- Close above or below the 20-MA 5 Days Ago. C>20 -5
- Close above or below the 50-MA.
- Close above or below the 50-MA 5 Days Ago. C>50 -5
- 20-MA above or below the 50-MA.
- 20-MA is pointed up, and the close is above the 50-MA
Where are the Markets Headed this Week?
Two weeks ago, the S&P 500 broke below Major Support (MS), shifting the trend from Up to Sideways. Last week, the index reversed sharply and pushed toward a new all-time high near 7000, restoring the trend back to up. However, that strength was followed by a sharp pullback on Thursday and Friday.
While a decline of roughly 1,000 points may sound dramatic, it represented approximately a 50% retracement of the prior advance. Importantly, that prior low now defines major support near 6800. Taken together over the last two weeks, the market illustrates just how volatile and news-driven it remains.
Historically, a 50% retracement following a breakout to new highs is an area where buyers often step in.
Master Trader Tip: Identifying where buyers may appear is only the first step. The more important step is waiting for confirmation via a price pattern before acting.
Key round-number levels on the S&P 500—7000, 6900, and 6800—also align with high open interest in options. Based on last week’s price action, a decisive close below 6900 would likely lead to a test of 6800.
At this point, unless the index forms a clear, constructive price pattern at support, which currently appears unlikely to be a “tame” setup, we are viewing this potential scenario primarily as an observation tool to help define probable market direction, not as an actionable trade.
Market internals remain neutral, but breadth has begun to weaken, and sentiment has shifted toward a bearish extreme, reflected by elevated call activity relative to puts. This divergence is worth monitoring closely.
Economic data will be influential this week. Should upcoming reports confirm last week’s higher inflation readings, markets are more likely to respond negatively rather than positively.
Volatility in Gold, Silver, and other metals is also likely not finished. While prices stabilize intraday, meaningful buying interest typically emerges only after volatility subsides. For now, the bias remains lower.
Bitcoin bears watching as well. A daily close below $80,000 could act as a broader risk-off signal, potentially pressuring equities. These markets remain highly speculative, and weakness here often precedes reduced risk appetite elsewhere.
Earnings season continues with several notable reports:
- Monday: Palantir (PLTR), Disney (DIS)
- Tuesday: Advanced Micro Devices (AMD)
- Wednesday: Alphabet (GOOGL), Qualcomm (QCOM)
- Thursday: Amazon (AMZN)
- Friday: Philip Morris (PM), which continues to show relative strength
As always, this environment favors discipline, patience, and selectivity over prediction. Volatility creates opportunity—but only for those willing to wait for confirmation.
DOW JONES
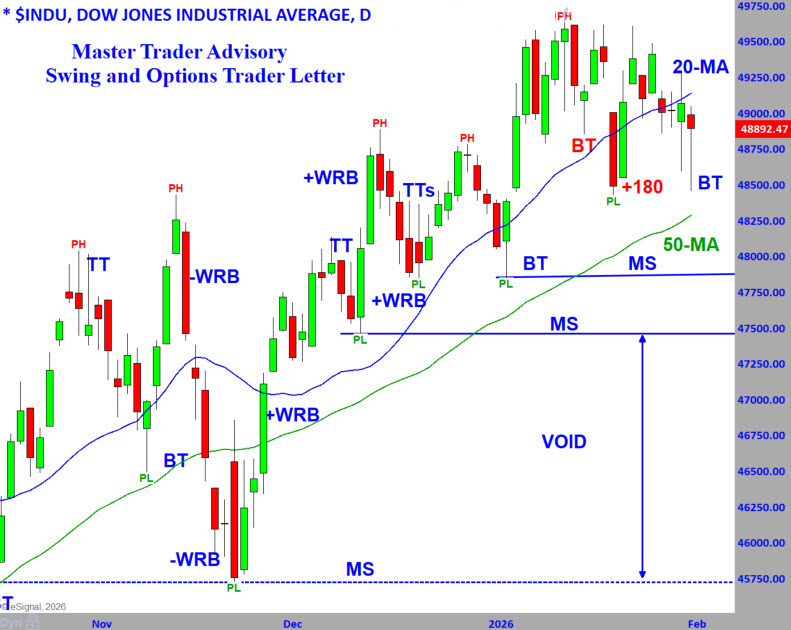
The chart above shows the Dow Jones Industrial Average through the lens of Master Trader Technical Strategies (MTS).
The Dow remains in an uptrend, but price action continues to whip back and forth, reflecting an increasingly erratic consolidation phase. Both the 20-day and 50-day moving averages are still rising, and prices are holding above Major Support (MS) just beneath the 50-MA—a constructive backdrop, but not a clean one.
Several candles deserve attention. I’ve highlighted the Bottoming Tails (BT) and the bullish two-bar reversal (+180) in red. These reactions failed to push prices to new all-time highs. While that alone is not bearish, it is a subtle departure from the stronger bullish follow-through seen earlier in the trend.
This is where Bar-by-Bar analysis matters. Individual candles—and small candle groups—must be evaluated in the context of trend, support, resistance, and reaction quality. Sometimes the message is obvious; other times, it’s nuanced. This chart leans toward the latter.
On Friday, price pulled back into the prior Pivot Low (PL) and the +180 level from the prior advance, forming another Bottoming Tail (BT). BTs tell us buyers stepped in during the bar, but context matters. There is significant overhead congestion, and this BT formed below the 20-day moving average, reducing its reliability.
The takeaway: this is an informational chart, not an aggressive opportunity chart. When you see price action like this—choppy, overlapping candles and mixed signals—the higher-probability decision is often to stand aside and look for cleaner, tighter patterns elsewhere.
Discipline isn’t just knowing when to trade—it’s knowing when not to.
If you’re not yet comfortable interpreting candlesticks bar-by-bar in real time, this type of analysis is exactly what we teach in the Bar-by-Bar course for Swing and Day traders.
VIDEO REVIEW OF MARKETS, SECTORS AND INTERNALS - Click lower right to open Full Screen.
NEW STOCK TRADING IDEAS Below
NOTE: Please see the document in RESOURCES entitled Master Trader Guidelines for Trading the Open and Gaps.
Note on Position Size Calculation in the Open Trades Sheet:
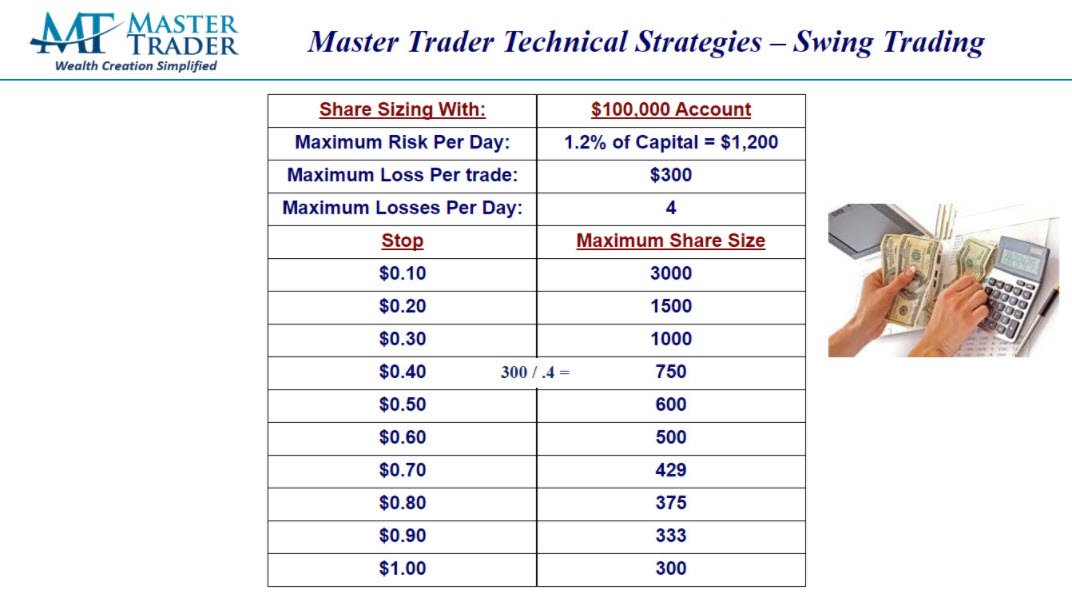
All trades are based on a hypothetical Max Loss of $300/trade. For Stocks, that is $300 / (Entry - Stop). Directional option trades use the same formula, then divided by 100, rounded down to the nearest whole number, with a minimum of one (1).
The “Master Trader Blended Method” for shorting options/spreads size starts with the stock position size, multiplying by 1.5, then divide by 100 because 1 contract represents 100 shares.
Please calculate position size according to your Max Loss per your Trading Plan.
Here's an example:
AMS Teaches You How to Maximize Profits on Every Trade. Click Here to Read More
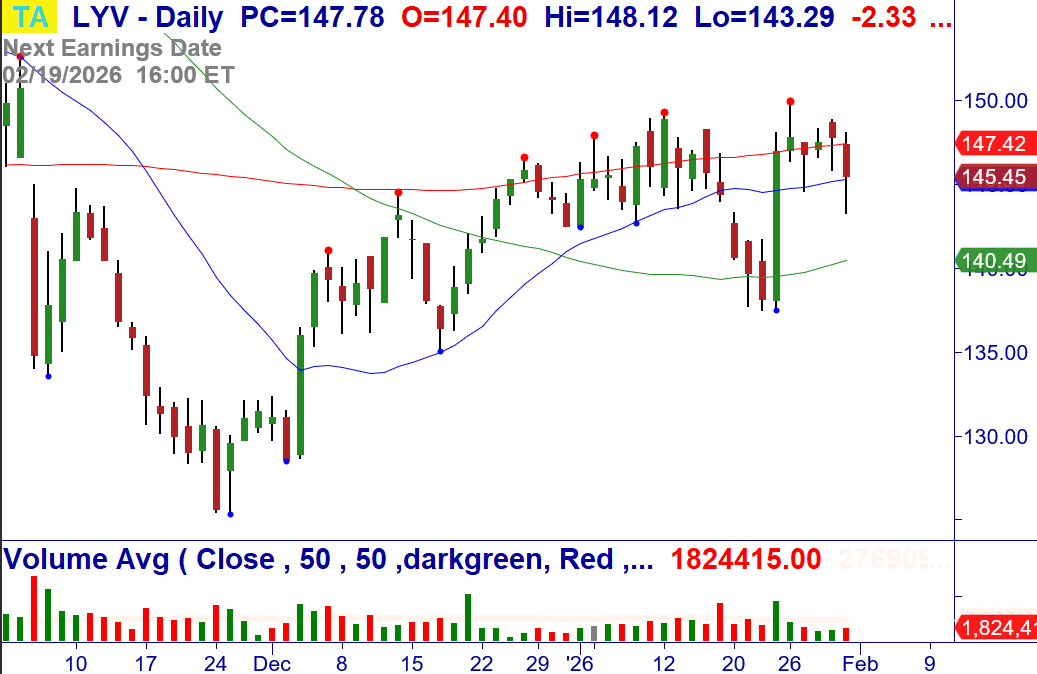
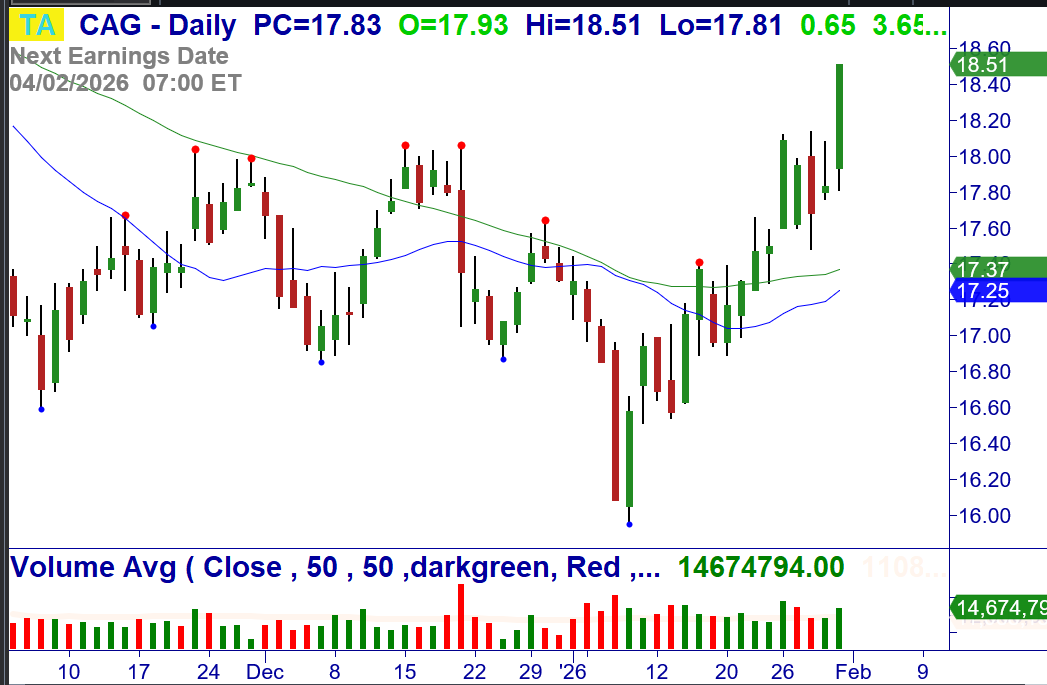
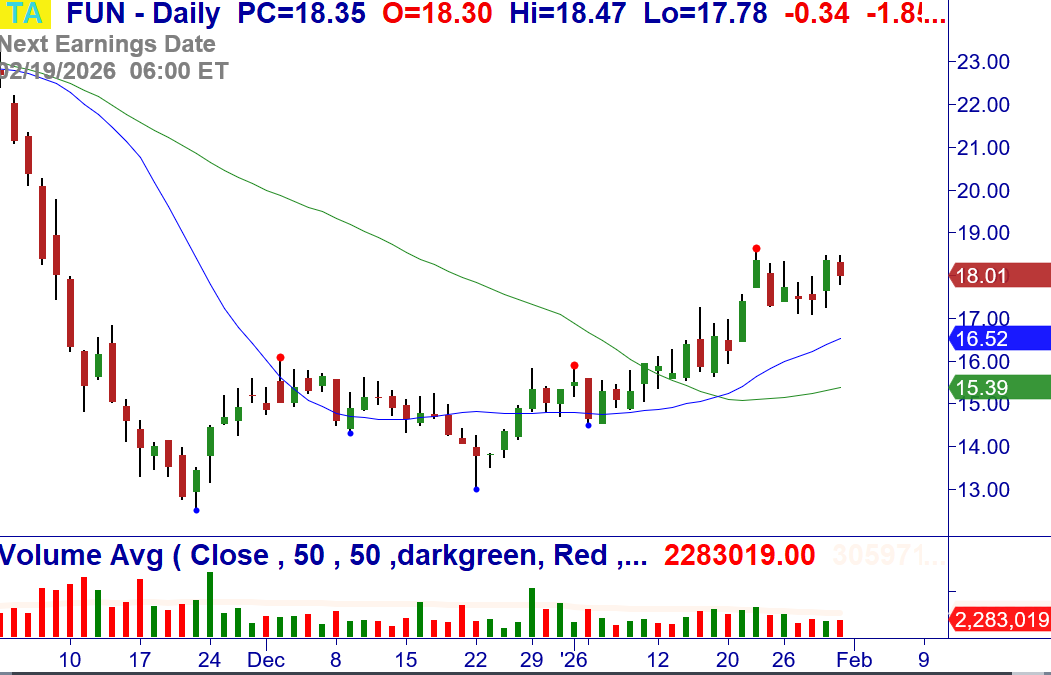
2/2: FUN – Over $18.47, consider buying the stock. +123 Breakout from a bottoming pattern. Stop $17.08.
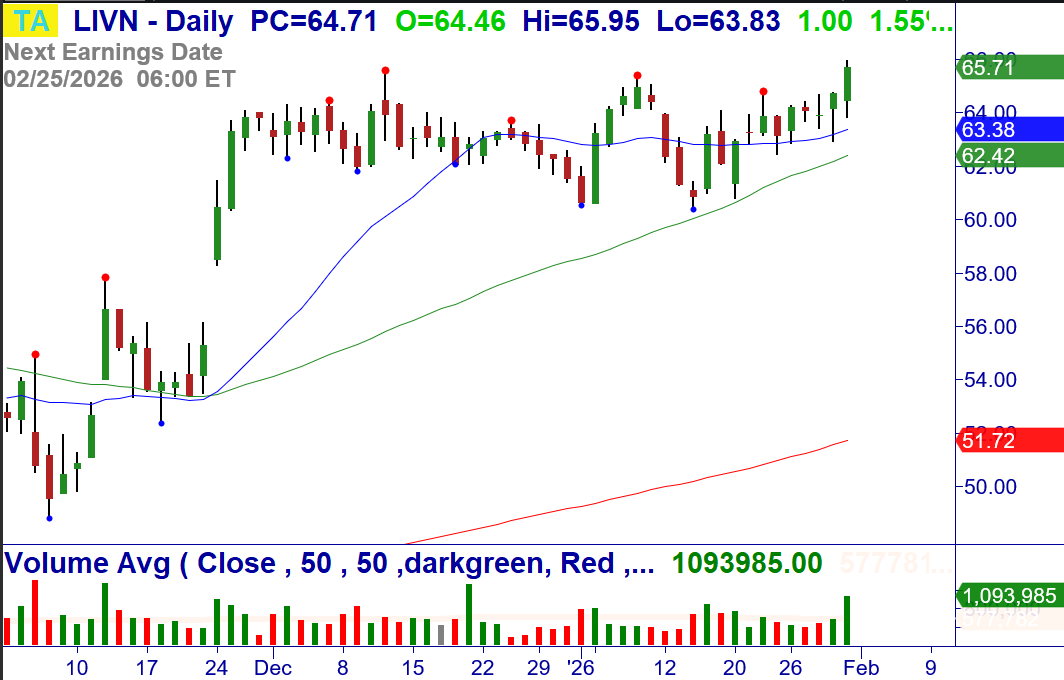
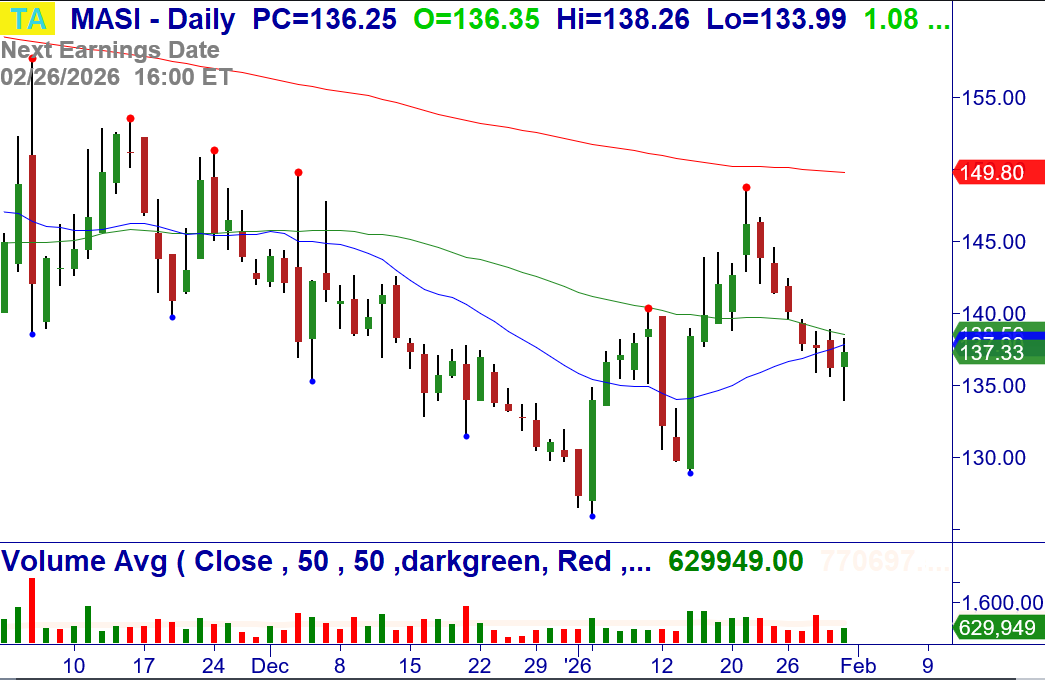
2/2: MASI – Over $138.94, consider buying the stock. Buy Setup and reversal at the 20/50-MA. Stop $133.98.
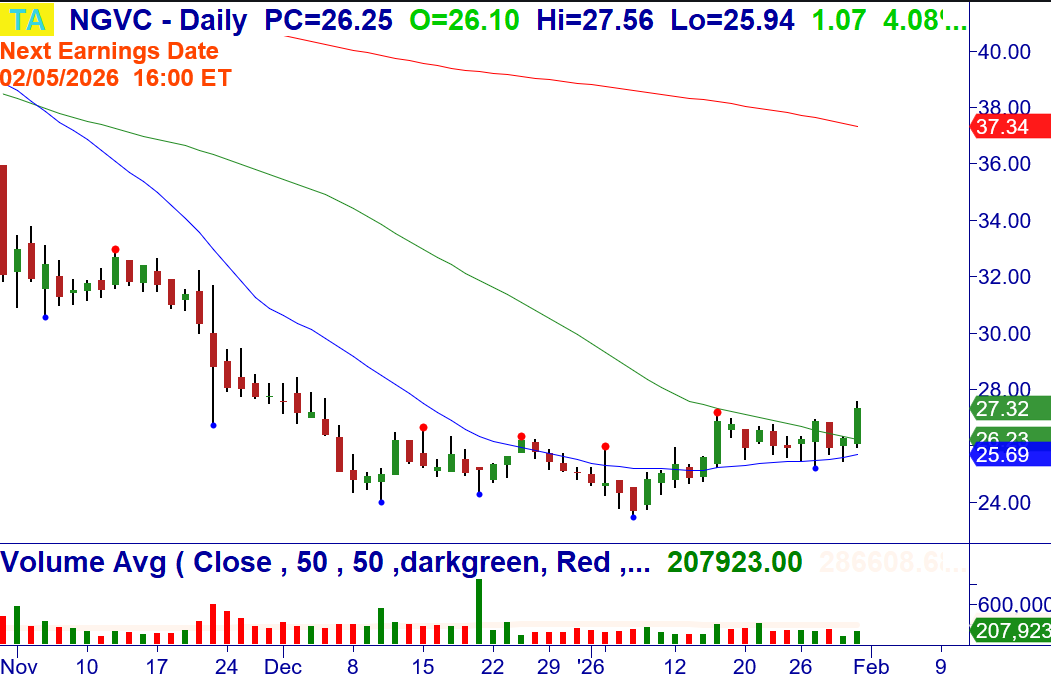
2/2: NGVC – Over $27.56, consider buying the stock. +WRB Breakout of a bottoming pattern at the 20/50-MA. Earnings 2/5. Stop $25.93.
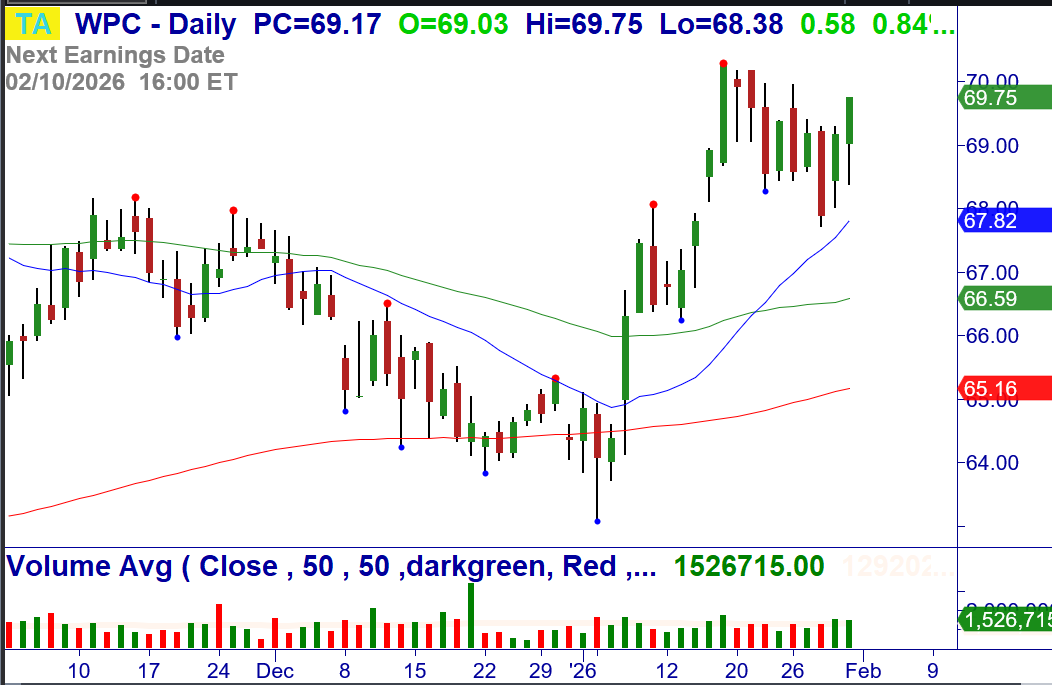
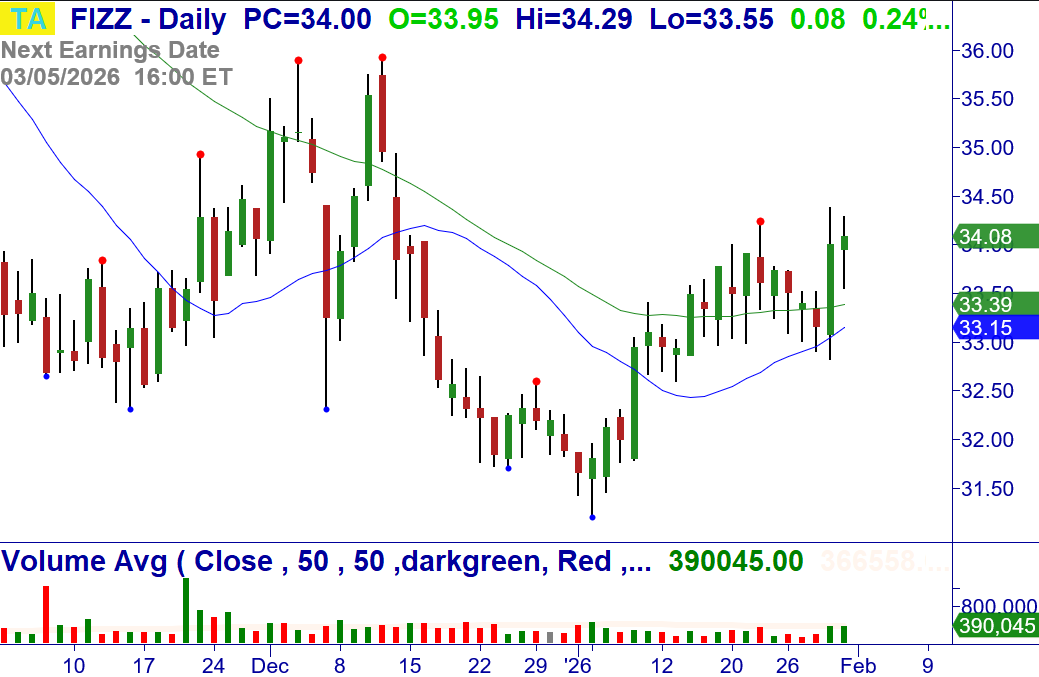
2/2: WPC – Over $69.75, consider buying the stock. Bull Flag Breakout at the 20-MA. Stop $68.18.
Money Management for Trading and Investing
Proper money management for investing and Trading starts with position-sizing based on the amount of money you are willing to risk on a signal trade.
CLICK HERE to review these Master Trader Guidelines and Basic Money Management and Position Sizing Table.
NEW OPTIONS TRADING IDEAS
Directional Options Strategies and Debit Spreads for Swing Trading (See the Weekly Options Trader letter, which sells options/spreads for weekly Income that primarily expire in 10 days or less, CLICK HERE)
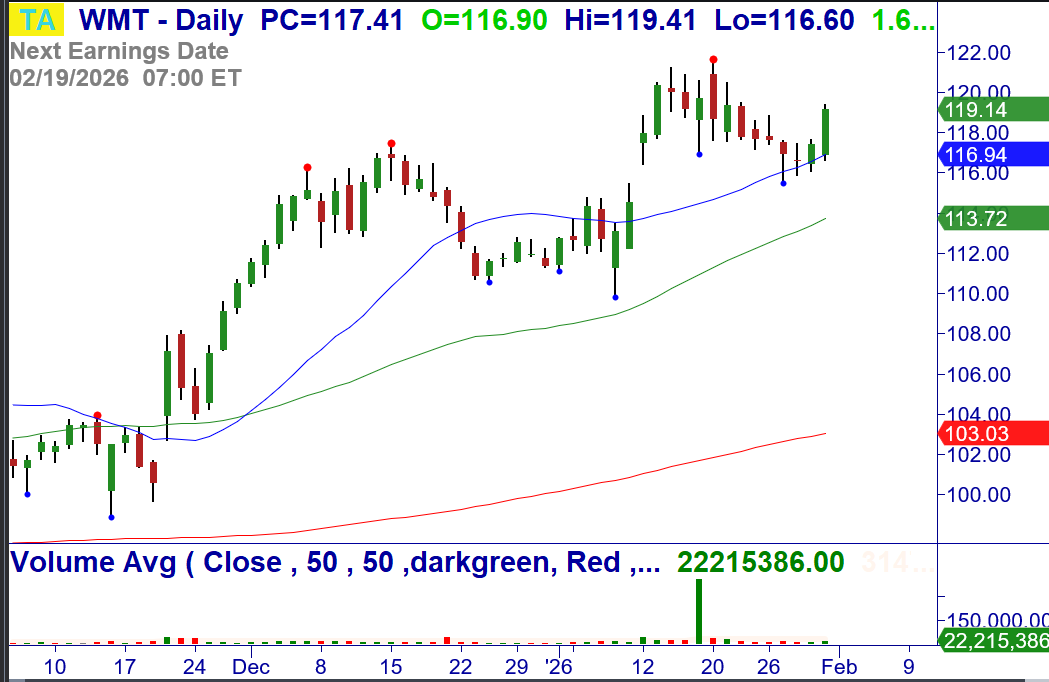
2/2: WMT – Over $119.41, consider buying Feb (2/6) $117 calls for a limit of $2.90/share (closed at $2.88/share). Buy Setup and reversal at the 20-MA. Stop $116.06.
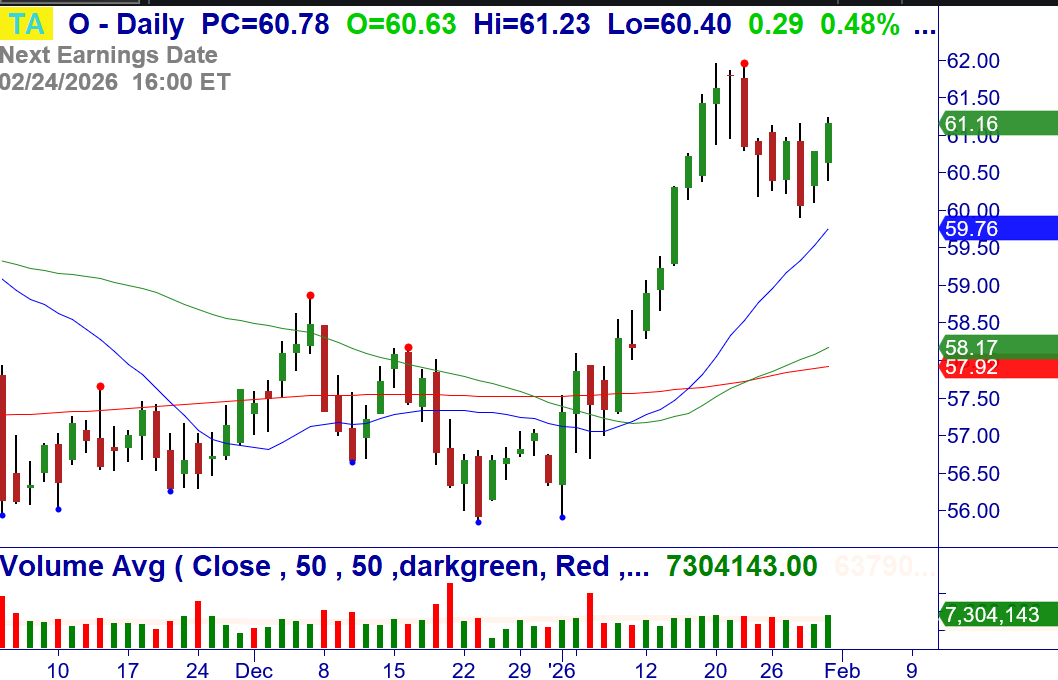
2/2: O – Over $61.23, consider buying Feb (2/20) $60 calls for a limit of $1.75/share (closed at $1.73/share). Bull Flag Breakout at the 20-MA. Stop $59.88.
The Master Trader approach to selling credit spreads around technical turning points.
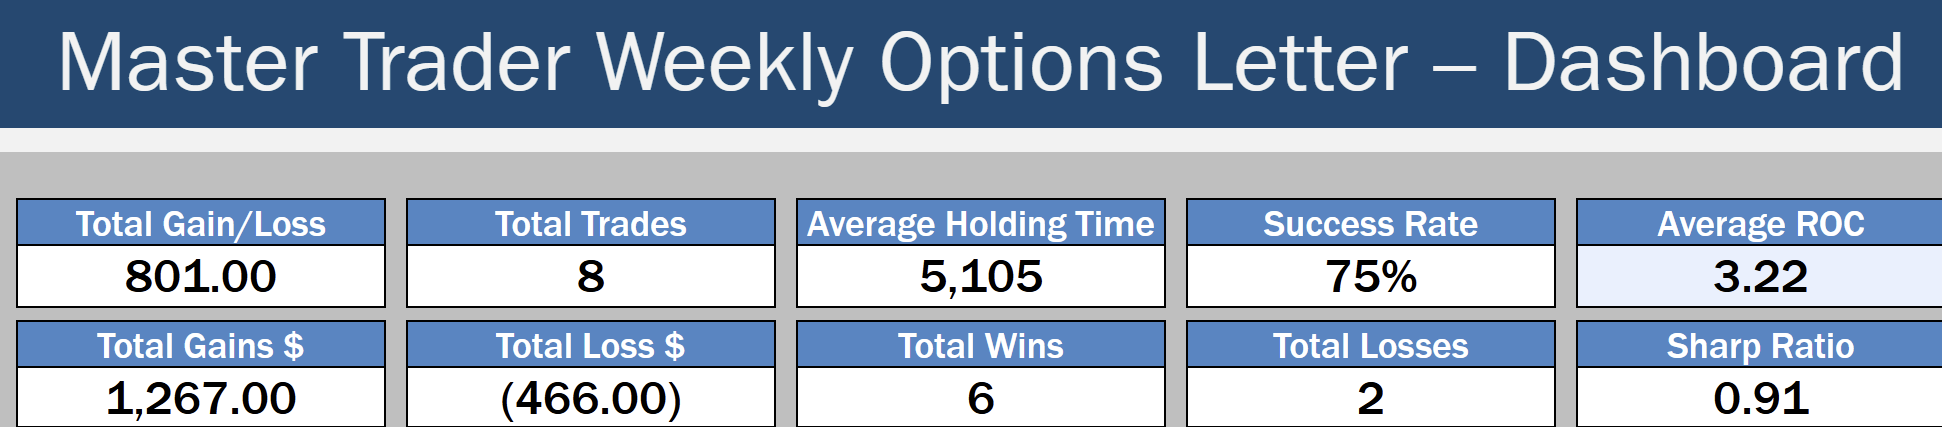
Read about the Weekly Options Trader letter, which sells options/spreads for weekly Income that primarily expire in 10 days or less, around Master Trader technical turning points, CLICK HERE
By selling spreads on stocks and ETFs where MTS indicates price is unlikely to go, we become the “smart money,” getting paid to take calculated, well-defined risk.
Check out the blog article with more information and monthly results, CLICK HERE
Professional consistency, short-duration trades, and risk-controlled income — that’s what defines the Master Trader approach.
Because your success is vital to you – and us.
Before selling options or credit spreads, we urge you to review the valuable and detailed information that we have provided for you in your Member’s Area Resources.
A quick simplified approach to calculating contract size is to simply base your contract size based on the number of shares permitted in your Trading Plan as if you were trading the stock or ETF. Simple Share Sizing = $ Risk / Stop Loss
The amount of money that you are willing to risk – divided by – the stop loss amount. For example, $100 / .20 = 500 shares. Credit Spread example, if your Trading Plan allowed you to trade 543 shares of AAPL based on the stop loss, then simply round down to the nearest hundred and short an equivalent number of contracts of the option. Since 1 contract represents 100 shares of the underlying, this would be five (5) contracts.
Master Trader and You Building Your Financial Future Together!
Good trading!
If you have any questions or comments, please e-mail Greg Capra at Greg@mastertrader.com or Dan Gibby at Dan@mastertrader.com
All the best,
Greg Capra Managing Director of Master Trader
Dan Gibby Chief Options Strategist
NOTE: Master Trader will show the opening and closing prices of all stock and options trades. We recommend that all traders and investors use proper share sizing for positions and money management. However, we cannot recommend what that is for your particular trading style, risk tolerance, or account balance. We urge you to calculate your own share/position size based on your individualized risk parameters, Trading Plan, and familiarity with the proposed trade strategy and risk. Advanced Management Strategies (AMS) covers in detail foundation and advanced position and money management.
NOTE: Master Trader and its representatives may have existing positions in actual or other trade recommendations before or after suggested herein. Additionally, we may manage them differently for internal purposes based on different risk parameters than noted herein. All trade ideas and content are for informational and educational purposes only. It is not, nor is it intended to be, trading or investment advice or a recommendation that any security, option, or investment strategy is suitable for any person. Trading securities can involve high risk and the loss of any funds. Significant gaps or volatility can increase these losses, particularly for short option strategies. Investment or trading information provided may not be appropriate for all investors, and is provided without respect to individual financial sophistication, financial situation, investing time horizon or risk tolerance. Supporting documentation for any claims (including claims made on behalf of options programs), comparison, statistics, or other technical data, if applicable, will be supplied upon request. Master Trader Consulting, Inc. is not a licensed financial advisor, registered investment advisor, or a registered broker-dealer. Options, futures, and futures options are not suitable for all investors.

