
There Is Nothing New in Technical Analysis—Only New Ways to Complicate It
Every few years, technical analysis is supposedly “reinvented.”
A new indicator.
A new cloud.
A new strategy.
A new algorithm that claims to finally solve support, resistance, and trend.
Yet price still does the same thing it has always done.
It moves because of supply and demand.
Despite this, the technical analysis industry thrives on complexity. Endless indicators promise to calculate support and resistance, define trends, or predict reversals—often by using derivatives of price instead of price itself.
A popular example is the Ichimoku Cloud, marketed as an all-in-one solution that tells you trend, support, resistance, and momentum at a glance. Indicator salesman always have a new one or an “Optimized” latest-greatest one.
It sounds sophisticated.
It’s also unnecessary.
Because none of this is new.
Let's look at a few foundational concepts.
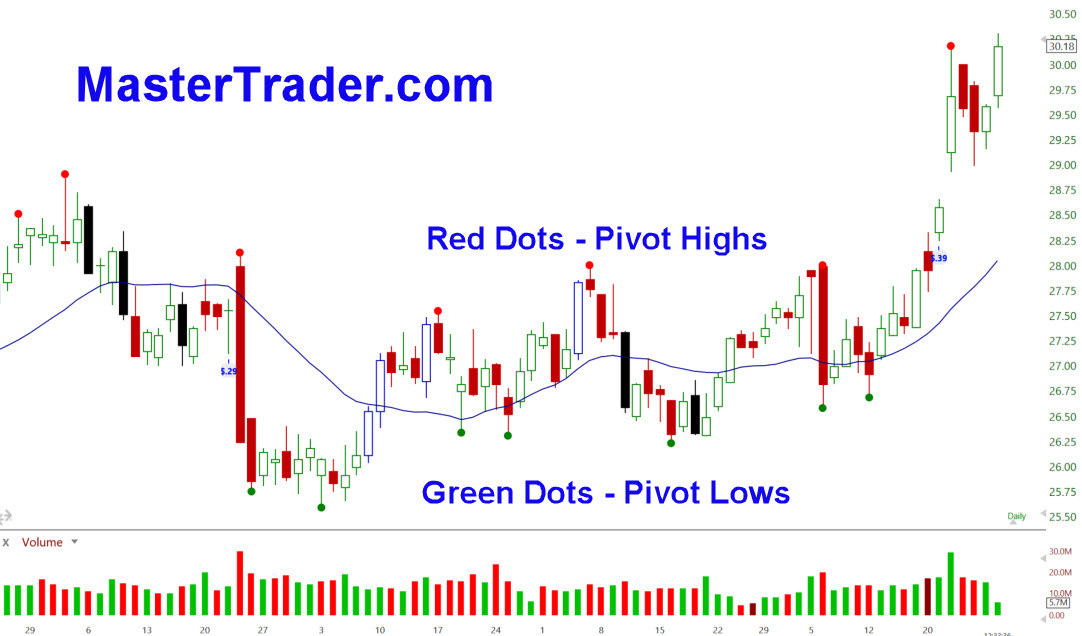
Pivot Lows, 3 Higher low bars adjacent to the Pivot.
Support and Resistance Are Created from Supply and Demand
Support and resistance are not created from mathematical constructs.
They are not created with diagonal lines.
They are not created from indicators.
They are areas where buyers or sellers previously took control.
In Master Trader Technical Strategies, we define these areas in the simplest, most objective, repeatable way possible—through pivots, also called swings.
- A pivot low is a bar with three higher-low bars to the left and three to the right
- A pivot high is a bar with three lower-high bars to the left and three to the right
That’s it.
Those pivots represent demand (buyers stepping in) or supply (sellers taking control). And here’s the key truth most traders miss:
If buyers created a pivot low once, the odds are high they will show interest there again.
This isn’t a prediction.
It’s probability-based on observable behavior.
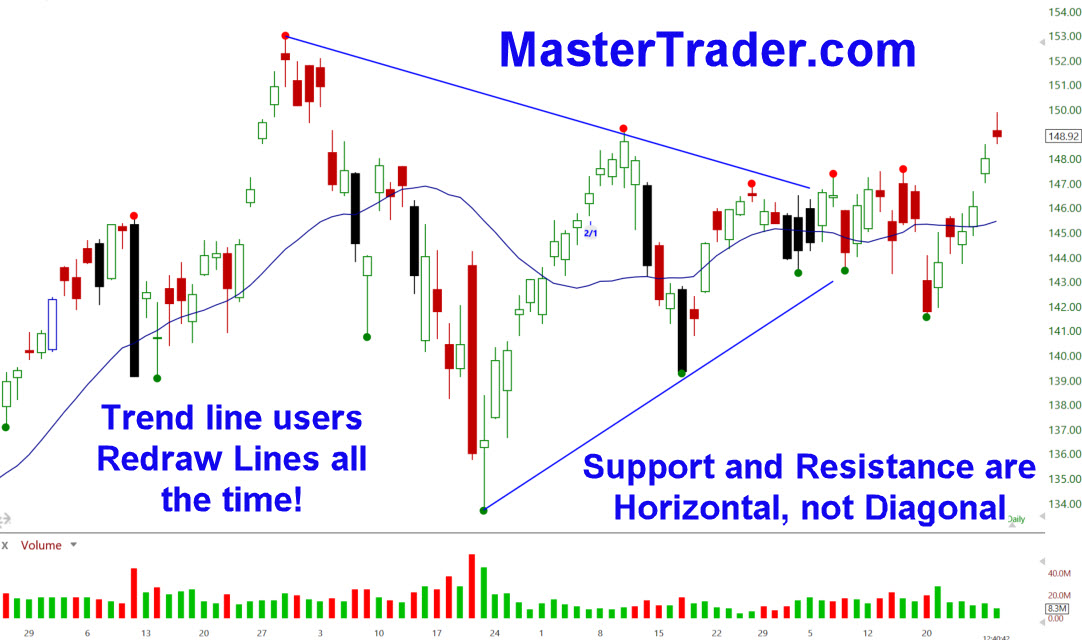
Trendlines Don’t Define Trends—Price Does
Trendline traders love connecting dots.
Some connect pivot lows.
Others connect random swing bars.
Some project those diagonal lines into the future and call them “dynamic support.”
This is where technical analysis crosses from logic into mythology.
Trendlines do not define trends.
They do not define trend breaks.
And projecting diagonal lines forward to define where support or resistance might be is, frankly, absurd.
Support and resistance are horizontal because supply and demand are horizontal.
Trends are defined by price structure:
- Higher highs and higher lows
- Lower highs and lower lows
- Or the loss of that structure
A diagonal line does none of that work for you. It only creates the illusion of precision.
If you can “Look to the Left” on your chart, you can locate support and resistance.
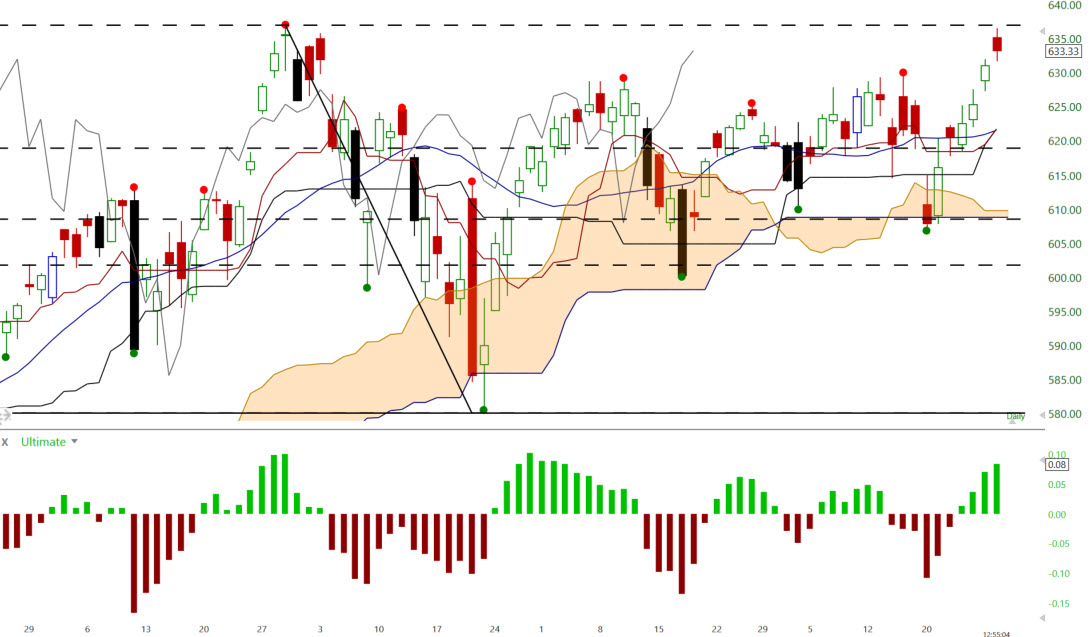
Questioning the Esoteric
Questioning the Esoteric
When I started studying technical analysis in the late 1980s, I believed the mythology.
Trendlines.
Fibonacci.
Indicator stacking.
Like many traders, I assumed complexity meant accuracy.
But after watching these tools fail repeatedly—especially in real-time decision-making, I started questioning their validity.
During that period, I read a 1993 book that stuck with me: Winner Take All by William Gallacher. He openly mocked technical analysis and dismissed it entirely.
I didn’t agree with him, but his skepticism reinforced something important:
The more esoteric the technical analysis becomes, the less reliable it is.
That realization pushed me back to the basics and led me to realize that much of technical analysis is a self-fulfilling prophecy.
I put it like this,
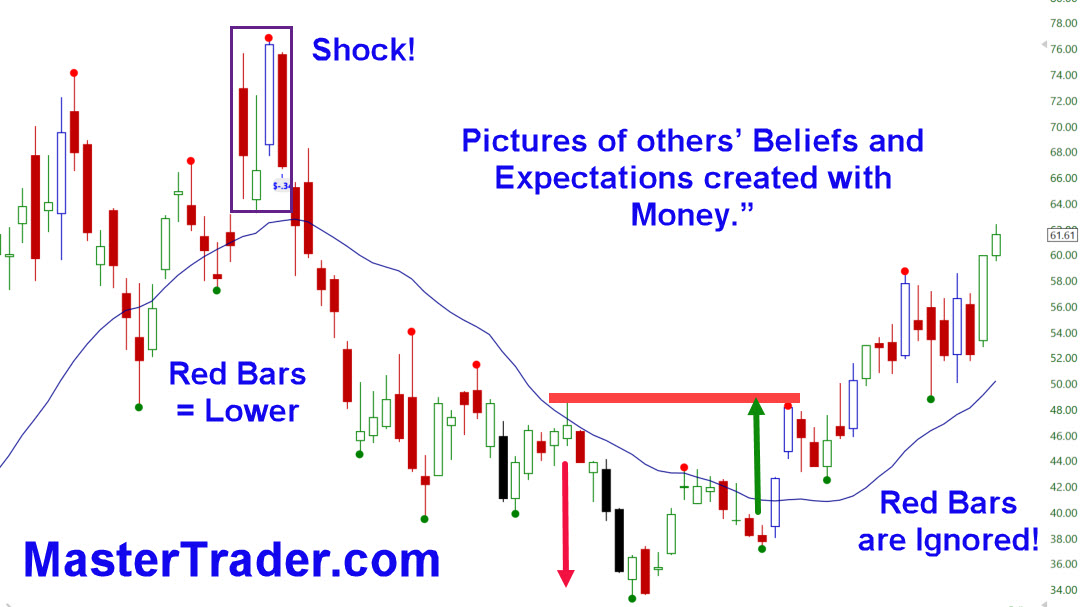
“Technical Analysis: Pictures of others’ Beliefs and Expectations created with Money.”
Complexity Is a Phase—Simplicity Is Mastery
Most traders start by chasing complexity.
It feels safer.
It feels more advanced.
It feels like it should work better.
But mastery moves in the opposite direction.
The longer you do this, the more you realize:
There is nothing new in technical analysis once you understand the foundations.
Buyers buy where buyers bought before.
Sellers sell where sellers sold before.
How you define those areas can be simple—or unnecessarily complicated. The market doesn’t reward complexity. It rewards clarity, discipline, and consistency.
Reading the Reaction to the Level
Once support or resistance is identified, the real work begins.
The question is, how does price behave there?
- Does price accelerate away from demand?
- Does it stall and go sideways?
- Does it fail immediately?
- Are candles showing urgency or hesitation?
These reactions tell you far more than any indicator ever will.
That’s why bar-by-bar analysis matters.
That’s why candlestick context matters.
That’s why price is king.
The Master Trader Thought Process
Master Trader Technical Strategies are not a collection of indicators.
They are a structured thought process:
- Price is king—everything else is secondary
- Candlestick and bar-by-bar analysis
- Trend structure
- Multiple-timeframe alignment
- Support and resistance from pivots
- Relative strength and weakness
- Volume and moving averages as confirmation
- Broader market bias
- Market internals and inter-market analysis
- Position sizing and money management
- Trader psychology

This is how trading plans are built.
Not from clouds, curves, or colored overlays—but from understanding what price is doing and why.
Technical analysis doesn’t need reinvention.
When you strip away the noise, the gimmicks, and the salesmanship, what remains is simple, repeatable, and effective.
Price moves because of supply and demand.
And it always has.
Greg Capra
Why Master Trader Education - Read Here
