

The Master Trader top-down method of stock market analysis is a comprehensive approach that starts with a Techno-Fundamental perspective and narrows to individual stocks.
Master Trader uses a Top-Down method to educate students through courses and letter memberships. The video below shows you the Scanning Process and some current Wide Range Bars.
First, let's review the method.
The first step in the top-down analysis is to evaluate the Techno-Fundamental factors that can impact the stock market for investing and swing trading.
Those factors include analyzing the trend of short and long-term interest rates and their levels, yield curves, internal market gauges of breadth and sentiment, the trend and price of commodities, currencies, and the price and trend of precious and industrial metals.
By assessing the state of the economy using Master Trader Techno-Fundamentals (you don't have to be an economist), self-directed investors and traders gain insights into the general market's health or the lack thereof and adjust their strategy.
The next level of analysis involves examining specific industries and sectors. Different sectors perform differently at various stages of the economic cycle.
For example, sectors like technology, consumer discretionary, and industrials might thrive during an economic expansion, while defensive sectors like utilities and consumer staples could be relatively stable. When interest rates fall, home builders and construction suppliers may do well, and vice versa.
Investors can narrow their focus by identifying sectors with favorable growth prospects or those positioned to benefit from certain trends.
Once a promising sector or sectors are identified, the final step involves selecting individual stocks within those sectors.
By combining Techno-Fundamentals and technical analysis, investors and traders can identify sectors and stocks with strong potential to outperform and others that will underperform.

The Advisory Swing and Options Letter shows you how to use Techno-Fundamentals, how to scan sectors, stocks and provides trade ideas. New trades with the technical setup and management updates are sent intra-day by text message to subscribers until the trade is closed. The Video is from the letter.
Big Candlesticks Equal Big Buying or Selling
The most powerful candlestick signal is the Wide Range Bar or WRB. The WRB forms bullish ones - +WRB and bearish ones -WRB.
We scan for WRBs every day and in different time frames.
For Swing Trading, we would scan daily and weekly WRBs. For day trading, 60-Minute and 15-Minute WRBs.
A WRB forms when the range expansions are significantly larger than the candles preceding the WRB.
We also want the bar to open near one end and close near the other end.
Realize that one candle is not a trading strategy. We need to define the trend. Is there support or resistance nearby, or is there a VOID?
Also, did the WRB ignite a new move from a consolidation, or have prices been moving in one direction for a while, and then the WRB signaling the move has exhausted itself?
Watch the video below to see how to use a Top-Down Approach to finding WRBs.
Big Candlesticks Equal Big Buying or Selling
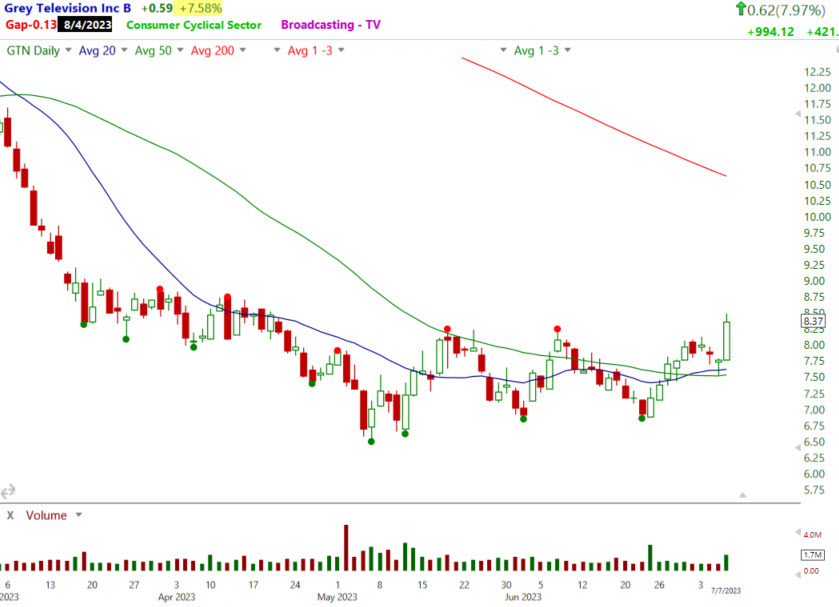
Bullish Wide Range Bar +WRB

Bearish Wide Range Bar +WRB
Master Trader and You Building Your Financial Future Together!
Happy trading! If you have any questions or comments, please e-mail Greg Capra at Greg@mastertrader.com or Dan Gibby at Dan@mastertrader.com