

The broader markets closed the week relatively unchanged (small losses) on lighter volume on the last trading week of the year.
Last week we said, “There was no Santa Claus Rally; however, with bullish internals and bullish close, will we get a year-end rally?”
The answer was no. It was unfortunately a choppy up-and-down week, leaving us with a long bias over the week’s high and a bearish bias under Wednesday’s low.
The media was quick to announce that stocks had their worse year since the 2008 financial meltdown.
The Dow held up the best, down 8.8%. The tech-heavy Nasdaq was the worse, down 33% as rising yields hurt stocks’ profitability more. The FANG+ Index was down 40%.
Some of the themes for 2022 causing the selloff include:
- Rising interest rates and tightening monetary policy as the Fed continues to fight 40-year high inflation.
- Correction from the post-Coronavirus stellar bull market created by loose Fed monetary policy. Note that Master Trader warned of the market top in January 2022 using its techno-fundamental approach, which proved to be spot on.
- Russia’s invasion of Ukraine, which also caused oil to top $130/barrel and energy stocks to rally with generous yearly gains.
- Bitcoin crashed over 60% with many stocks in the sector filing for bankruptcy and ongoing stories of fraud.
- IPOs were down. Many SPACs went belly up.
- Inverted yield curves hurting bank profits and signaling a recession in 2023.
- Rising company layoffs in response to a slowing economy.
- The housing sector peaking as the rising yields hurt affordability.
- Rising tensions with China; China’s ongoing Coronavirus battle; and China’s threats against Taiwan.
- The Elon Musk drama continued as he bought TWTR, partially causing TSLA shares to crash.
- There was no Red Wave in the mid-term elections; ongoing political partisanship; Biden’s border crisis, green agenda, etc.
So where do we go from here? As mentioned above, in the short term, we have a long bias over last week’s highs and a bearish bias under Wednesday’s low.
According to Dow Jones Market Data, since 1929, the SPY has risen 75% of the time in the first week of the new year. And with a positive close for the week, they say the year closes with an 11.9% gain.
Thereafter, the future market direction will depend on the fundamentals; namely, earnings and the severity of a recession.
If rates continue higher as the Fed fights inflation, unemployment rises and a deep recession occurs, then we expect new lows in 2023.
We previously mentioned levels in the SPX between 3000 – 3400 as a potential bottom area. Our approach will know when to strike.
In December, most sectors attempted to move higher and failed dramatically. A breakdown under significant support followed that failure.
For most sectors, the last two weeks of the year have been erratic in relatively narrow ranges. These patterns suggest lower prices.
However, many short-term extended lower patterns could bounce if they clear the top of the trading ranges.
There aren’t any significant shock bars within these patterns. They attempted to move lower and higher, but there were no significant Range Expansion bars within these sideways movements.
In other words, we would not refer to the current patterns as “no-brainers.”
As already mentioned, sentiment is extremely bearish, supporting the potential for a bounce.
If the market internals were not supporting a short-term move up, I would not consider a long position. I would wait for the next failed attempt to move higher to provide a shorting entry.
We need to see prices get out of the current range. Short-term, the downside should be limited, and the upside more likely.
The current technical patterns do not support a significant move higher, but a limited upside is more likely. Be nimble.
Good trading! Happy New Year!
NEW TRADING IDEAS
Be sure to log into your Member’s Area to get connected to text messaging through Telegram — it’s critical to receive timely updates to new trades and trade adjustments! NOTE: New trade ideas included in these emails are not sent in Telegram when they trigger — only subsequent needed adjustments. Alerts for Targets and Stops triggered are also not sent; it is your responsibility to set alerts and manage them in accordance with posted instructions if desired.
NOTE: Please see the document in RESOURCES entitled Master Trader Guidelines for Trading the Open and Gaps.

Log into Member’s Area and click the RESOURCES tab, or click HERE
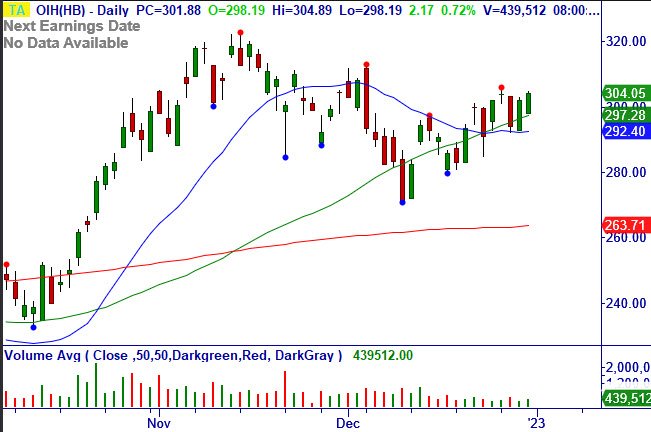
1/3: OIH – Over $304.89, consider shorting Jan (1/6) $290/280 bull put credit spread for a limit of $1.00/share (closed at $1.20/share). +180 Breakout at the 50-MA, bullish sector. Stop $291.88.
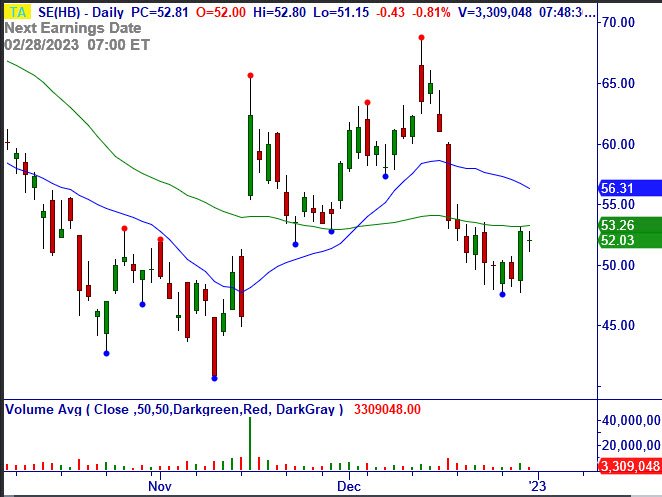
1/3: SE – Over $53.16, consider shorting Jan (1/6) $49/45 bull put credit spread for a limit of $.40/share (closed at $.49/share). +123 Continuation at the 50-MA. Stop $48.98.
1/3: NFLX – Over $295.50, consider shorting Jan (1/6) $280/270 bull put credit spread for a limit of $1.00/share (closed at $1.15/share). Bullish retest at the 50-MA after Breakdown Failure. Stop $280.88.

1/3: AMD – Over $65.18, consider shorting Jan (1/6) $62/57 bull put credit spread for a limit of $.50/share (closed at $.57/share). Breakout from a bottoming pattern on support. Stop $61.95.

1/3: MSTR – Over $142.09, consider shorting Jan (1/6) $125 puts for a limit of $1.25 (closed at $1.47/share). Climactic Buy Setup and reversal. Stop $130.

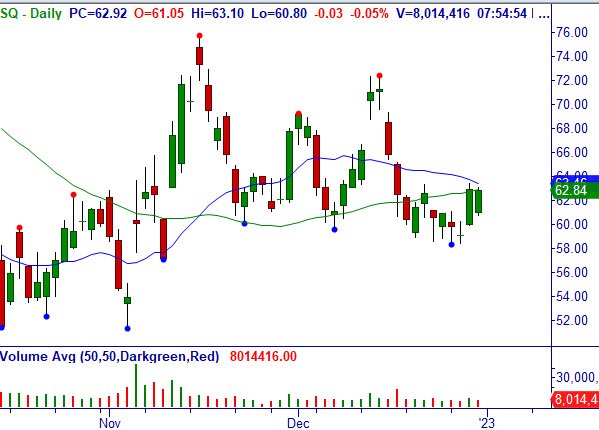
1/3: SQ – Over $63.47, consider shorting Jan (1/6) $60/55 bull put credit spread for a limit of $.65/share (closed at $.82/share). Breakout from a bullish turn at the 50-MA. Stop $59.98.
1/3: CAT – Over $241.61, consider shorting Jan (1/6) $235/225 bull put credit spread for mid-point (closed at $1.35/share). Buy Setup on support. Stop $236.48.

1/3: AXP – Over $147.93, consider shorting Jan (1/6) $144/139 bull put credit spread for a limit of $.55/share (closed at $.65/share). Breakout. Stop $143.98.

1/3: AMBA – Over $82.32, consider shorting Jan (1/6) $77/72 bull put credit spread for a limit of $.50/share (closed at $.60/share). Breakout at the 20-MA after Breakdown Failure. Stop $76.98.

1/3: MAR – Over $149.05, consider shorting Jan (1/6) $145/140 bull put credit spread for a limit of $.50/share (closed at $.62/share). Climactic Buy Setup and reversal. Stop $145.28.

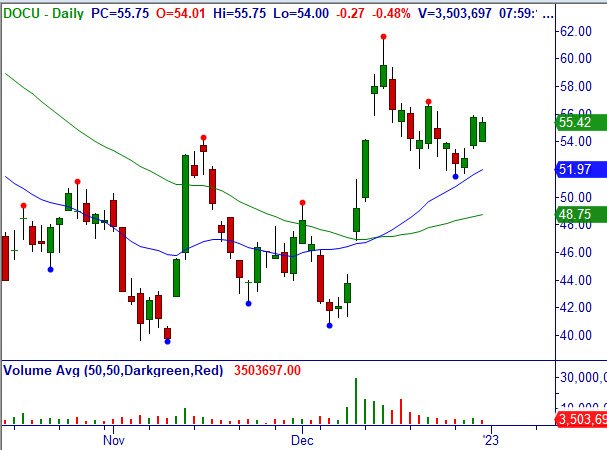
1/3: DOCU – Over $55.87, consider shorting Jan (1/6) $53/48 bull put credit spread for a limit of $.60/share (closed at $.73/share). +Gap from Buy Setup at the 20-MA and inside bar. Stop $53.18.
1/3: SIG – Over $68.80, consider shorting Jan (1/6) $65/63 bull put credit spread for a limit of $.35/share (closed at $.45/share). Breakout at the 20-MA. Stop $65.27.

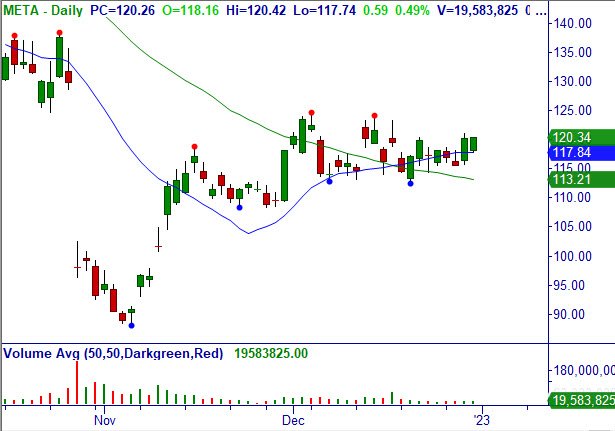
1/3: META – Over $121.03, consider shorting Jan (1/6) $115/110 bull put credit spread for a limit of $.50/share (closed at $.60/share). Breakout at the 20-MA. Stop $115.48.
1/3: SPY – Over $384.35, consider shorting Jan (1/6) $376/366 bull put credit spread for a limit of $.90/share (closed at $1.34/share). Breakout from a bottoming pattern on support. Stop $376.38.

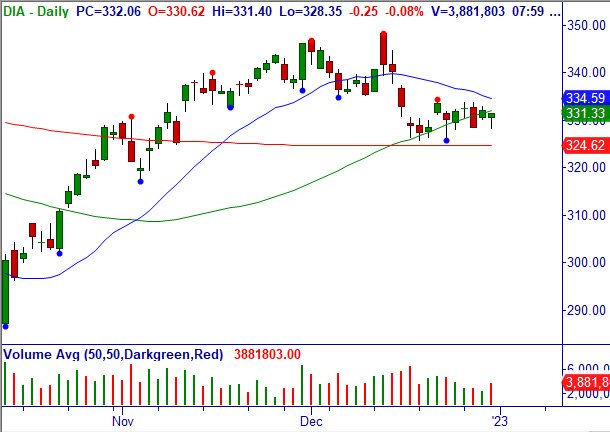
1/3: DIA – Over $333.74, consider shorting Jan (1/6) $328/318 bull put credit spread for a limit of $1.00/share (closed at $1.51/share). Breakout at the 20/50-MA daily, Buy Setup weekly. Stop $327.98.
This Chart of the Week teaches how to trade Master Trader’s Bullish 1-2-3 Continuation (+123) Setups with an MTS Price Pattern, entry methodology, and management.
Based on the market action last week, there are many great Setups. The video will discuss the best ones to trade stocks and options this week, as well as discuss others we will monitor for possible entry.
Click Here – to learn how to find, trade, and manage Income Options Credit Spreads like these that put you on the Master Trader Income Path.
VIDEO ON OPEN TRADES AND ADJUSTMENTS (NOTE: Also in Member’s Area in Open/Closed Trade Sheet)
[s3mm type=”video” s3bucket=”mastertrader2″ s3region=”us-east-1″ files=”dans-video/weekly_221231.mp4″ source=”cloudfront” /]
Options Strategies Definitions Videos Here
Please read the information on Money Management below Learn how Master Trader Technical Strategies – MTS and MTS with Options Strategies can make consistent money.
Please read the valuable information in the RESOURCES tab after you log into your Member’s Area:
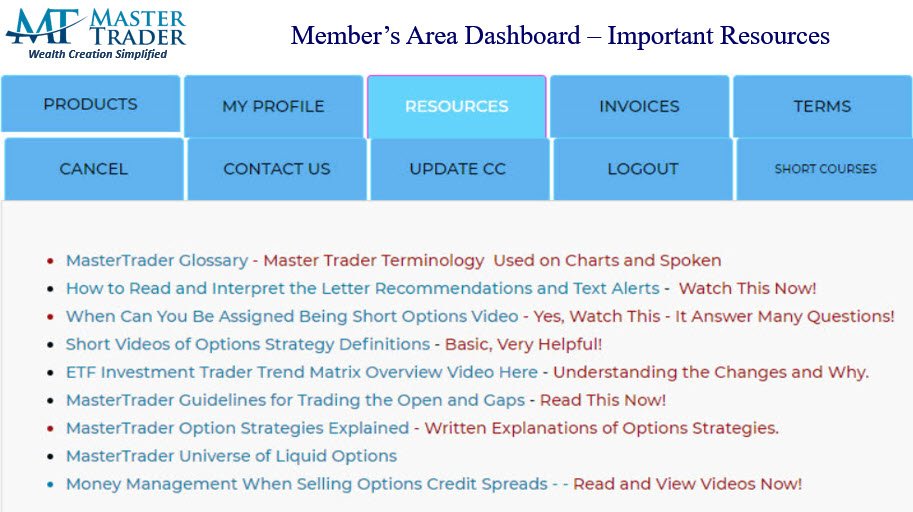
Because your success is vital to you – and us. Before selling options or credit spreads, we urge you to review the valuable and detailed information that we have provided for you in your Member’s Area.
If You’re in a Rush to Start A quick simplified approach to calculating contract size is to simply base your contract size based on the number of shares permitted in your Trading Plan as if you were trading the stock or ETF. Simple Share Sizing = $ Risk / Stop Loss The amount of money that you are willing to risk – divided by – the stop loss amount. For example, $100 / .20 = 500 shares. Credit Spread example, if your Trading Plan allowed you to trade 543 shares of AAPL based on the stop loss, then simply round down to the nearest hundred and short an equivalent number of contracts of the option. Since 1 contract represents 100 shares of the underlying, this would be five (5) contracts.
Click Here – to Access the Options Credit Spread Program that puts you on the Master Trader Income Path.
Click Here to Learn The Master Trader Swing Trading Strategies to profits over a few days to weeks. To invest in ETFs for weeks to months to generate wealth with compelling patterns using MTS, see Master Trader ETF Investment Trader.
Click HERE Master Trader Weekly Lessons for Investors and Traders will build your investing and trading knowledge and confidence to profit in all markets! Each lesson can change your financial future — only $11.97/month!
Master Trader and You Building Your Financial Future Together!
Happy trading! If you have any questions or comments, please e-mail Greg Capra at Greg@mastertrader.com or Dan Gibby at Dan@mastertrader.com
All the best,
Greg Capra Managing Director of Master Trader
Dan Gibby Chief Options Strategist
NOTE: Master Trader will show opening and closing prices of all stock and options trades. We recommend that all traders and investors use proper share sizing for positions and money management. However, we cannot recommend what that is for your particular trading style, risk tolerance, or account balance. We urge you to calculate your own share/position size based on your individualized risk parameters, Trading Plan, and familiarity with the proposed trade strategy and risk. Advanced Management Strategies (AMS) covers in detail foundational and advanced position and money management.
NOTE: Master Trader and its representatives may have existing positions in actual or other trade recommendations before or after suggested herein. Additionally, we may manage them differently for internal purposes based on different risk parameters than noted herein. All trade ideas and content are for informational and educational purposes only. It is not, nor is it intended to be, trading or investment advice or a recommendation that any security, option or investment strategy is suitable for any person. Trading securities can involve high risk and the loss of any funds. Significant gaps or volatility can increase these losses, particularly for short option strategies. Investment or trading information provided may not be appropriate for all investors, and is provided without respect to individual financial sophistication, financial situation, investing time horizon or risk tolerance. Supporting documentation for any claims (including claims made on behalf of options programs), comparison, statistics, or other technical data, if applicable, will be supplied upon request. Master Trader Consulting, Inc. is not a licensed financial advisor, registered investment advisor, or a registered broker-dealer. Options, futures and futures options are not suitable for all investors.