

How to Buy Bullish Reversal Patterns on Support
At Master Trader, we trade compelling setups using our objective approach on anything that moves, and which applies to any time frame.
Master Trader teaches many price patterns for trading stocks and options.
Using Bar-by-Bar Analysis, you will know what any price pattern signals — even one that can tell you to do nothing.
The Structure of the price pattern will speak to us about the relationship between buyers (demand) and sellers (supply) and the likelihood of reversals and trend continuation.
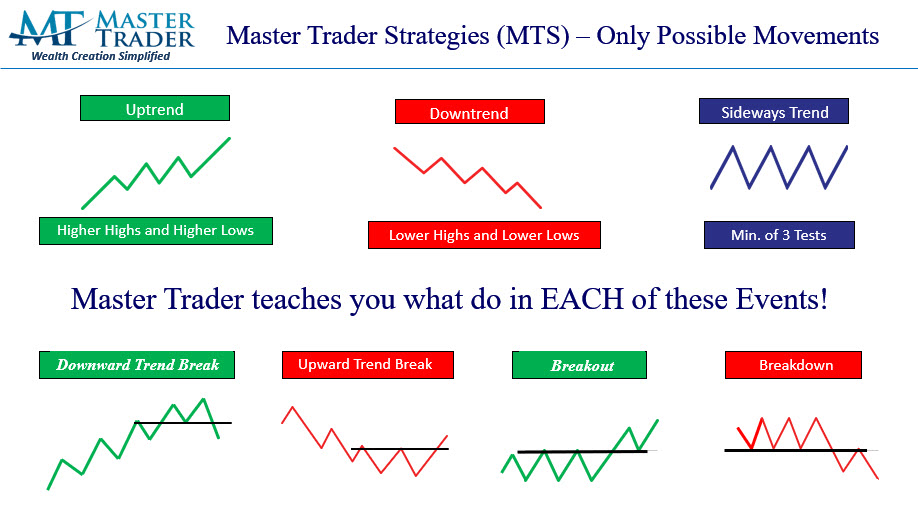
Only Possible Movements
Stocks trend up, down, or sideways. Trading trending markets is easier since there is agreement of the predominant bullish or bearish bias.
Trading ranges occur during consolidations, which is normal. Then they eventually continue their prior trend or reverse.
But you will lose many profitable opportunities if you are sidelined during consolidations.
These are the pictures of the only possible stock market moves (up, down, and sideways trends, plus the “transitional phases”) (explained more in the VIDEO).
This Video will show you how to trade high probability Setups in rangebound markets while the majority are getting
bounced around.
Below is a daily chart of Grayscale Bitcoin Trust (BTC) (GBTC) - VIDEO:
Click on chart to watch video!
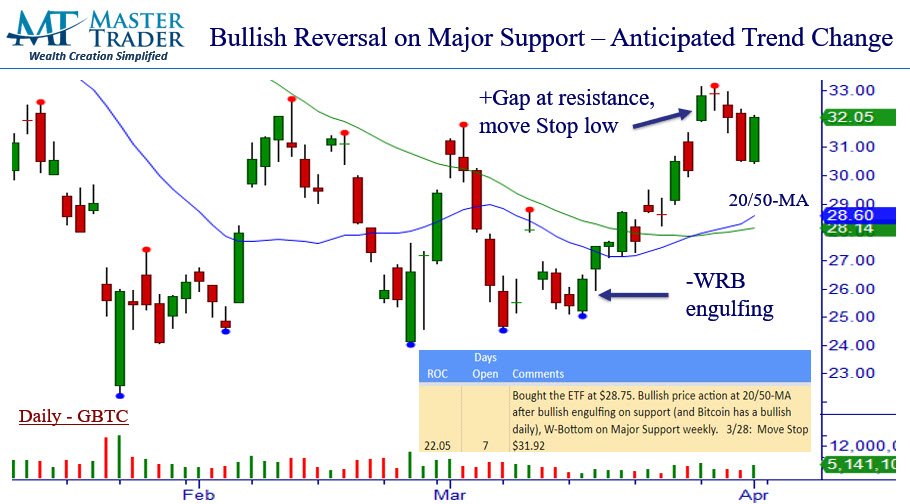
Every trade is given the date, symbol, stock or option directional or income strategy, technical setup, and protective stop loss.
Subsequent trade management is given real-time in Telegram text alerts and summarized in an Open and Closed Trade Spreadsheet for subscribers.
The VIDEO explains in detail the Setup on Multiple Time Frames (MTF), including sector confirmation, and how we managed it for a 22% return on capital (ROC) in seven days.
The analysis is explained in nightly letter videos for subscribers.
Learn to objectively read the chart messages of anything that moves with our Swing Trading Course to profit in the Markets!!