
 We trust you have been enjoying these complimentary copies of Master Trader’s new trading advisory, ETF Investment Trader.
It is designed specifically for those wanting to profit from longer-term trades with a focused group of diverse products to take advantage of numerous trading opportunities.
Thank you for all of the positive comments received regarding our first few issues. Here is one, which we love receiving since it demonstrates the value of our education in helping investors and traders make money in the markets:
“Greg and Dan, I have subscribed to numerous online trading services over the past 10 years and I can honestly say Master Trader is by far the best. My only regret is that it took this long to find you. I have two sons (24 and 26 yrs old). I think the best advice I could give them that could potentially have a huge impact on their lives is to have them subscribe to your service. Have a Great Father’s Day and Thank You! Jon.”
Master Trader’s “techno-fundamental” approach to the markets will allow you to profit with our selection of the best ETFs to invest or trade now! Our two long bullish entries in S&P broad market index ETFs triggered last week with the overall bullish market environment.
Dow Jones Industrial Average
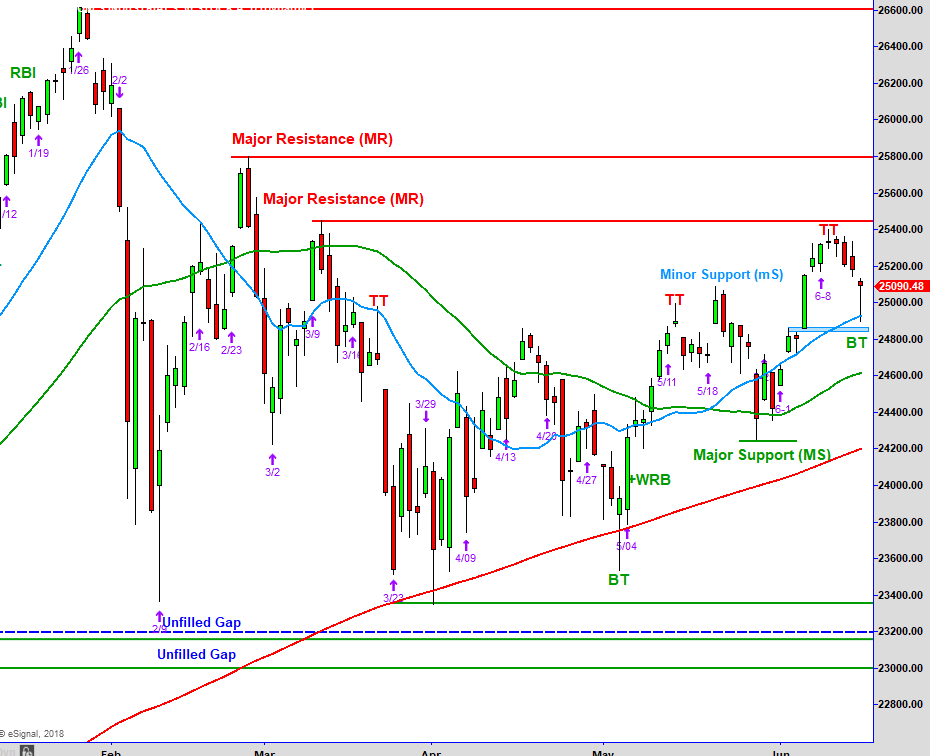
Above is the chart of the Dow Jones Industrial Average that we review each week.
The Dow started off last Monday moving right up into the Major Resistance (MR) reference point that we have had marked off for months.
Friday’s gap down and selling ended at the rising 20-MA (blue line) and, by the end of the day, the Dow formed a Bottoming Tail (BT).
A Bottoming Tail (BT) within an uptrend is a good reversal signal and this BT is also a Range Expansion (RE) bar. This signals that there was a lot of fear during the formation, which turned into greed.
In other words, after prices having pulled back throughout the week and reaching a reference point of price support — and the rising moving average, buyers believed that was a good point to step in.
But that being said, this was a relatively sharp angle that it dropped at, which was followed by a Range Expansion candle. A move higher with that scenario historically doesn’t resume until there has been a contraction in range and a decrease in volatility.
While the daily gyrations are not a concern to us from an intermediate-term point of view, we do want to make you aware of our shorter-term analysis and help educate.
.
ETF Market Overview Video
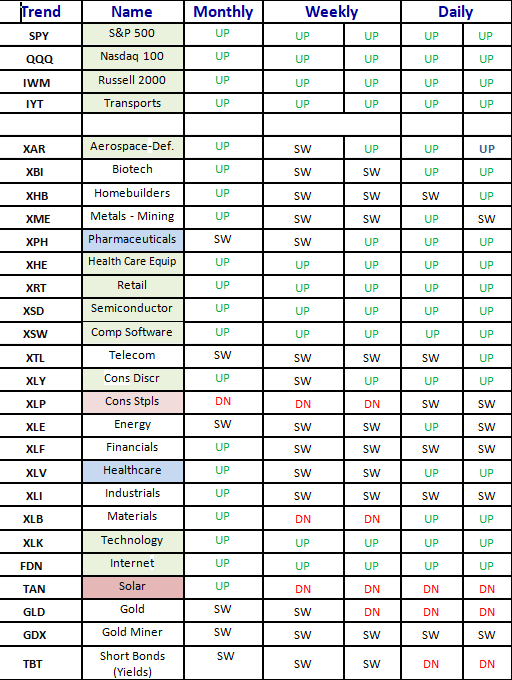
ETF Trend Matrix
NEW ETF TRADE IDEAS
Below is a weekly chart of iShares US Home Construction ETF (ITB).
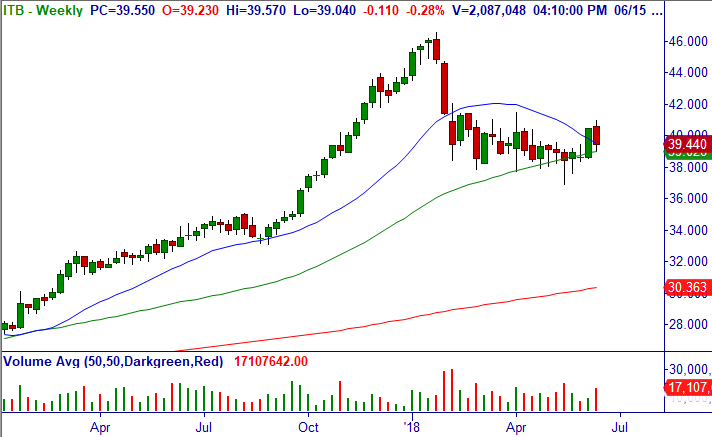
6/18: ITB – Trade: Consider buying a half-lot of ITB around closing price of $39.44.
Also, to lower cost basis if assigned, consider selling for the other half lot the Jul (7/20) $39 put options (33 DTE) for a credit of $.75/share.
Note: There is also nothing wrong with using a combination of ETF and options trades such as just buying the half lot, or just selling the naked put alone.
Based on an intermediate-term bias of this sector to move higher, but bottoming, we are willing to take assignment of the ETF if it pulls back below $39.
Buy selling the Put, our cost is $.75 cents a share below $39.00
Technical Setup: Pull back to support on daily after +WRB Breakout from consolidation on the weekly chart at the r50-MA.
Option Strategy:
Short Naked Puts (SP). Similar to bull put spread except not buying the lower strike put. We sell the put strike price below support where the pattern suggests that the stock will not close under at expiry. In exchange for the premium received, the put seller has the obligation to buy the underlying stock at the strike price on or before expiry.
The Max Gain is the Premium received, which is realized if the stock closes above the short put strike at expiration. The return on capital (ROC) is the credit received divided by the margin required to hold the position. The break-even is the short strike price less credit received (i.e., also your cost basis if assigned the stock).
Considered a mildly bullish strategy since we are not buying calls or stock and just calling a short-term bottom in the pattern. Trade has positive theta (meaning you make money on time decay) making it a high probability trade since we time entry with the technical pattern.
For a further discussion on the option strategy, please see our video at https://mastertrader.com/option-strategies-series-definitions/
Stop: $38.38.
OPEN ETF POSITIONS WITH TRADE UPDATES
6/11: IYT – Trade: Bought IYT and sold Jul (7/20) $200 call options for a debit of $195.85/share.
Original Technical Setup: Breakout daily and weekly with price void above, with multiple bullish Bottoming Tails (BT) on the weekly chart.
Option Strategy: Covered Call (CC). Used to reduce cost basis on IYT. For further discussion on the strategy, please see our video at https://mastertrader.com/option-strategies-series-definitions/
Trade Update: After breaking out and consolidating, last week IYT closed with a Bullish Engulfing Bar, possibly setting up a higher low above the r20-MA. Looks great on all time frames.
Adjusted Stop Loss: $192.97 (which is under weekly BT bar).
6/4: SPY – Trade: Bought SPY at $275.01.
Original Technical Setup: Bullish consolidation at the high end of a Bullish Wide Range Bar (+WRB), followed by a Bullish Breakdown Failure (+BDF) reversal.
Trade Update: Because the broader markets got overbought and some of our market internals (i.e., sentiment indicators) suggested a short-term top, we sold Jul (7/20 expiration) $282 call options for $1.10/share, reducing cost basis to $273.91.
This is what we refer to as “legging into a covered call.” We do this after momentum slows to increase our total returns and lower our cost basis by the premium received. For further discussion on the strategy, please see our video at https://mastertrader.com/option-strategies-series-definitions/
Last Friday, SPY gapped down under the stalled consolidation but closed with a Bottoming Tail above the r20-MA. Weekly and monthly charts are still in bullish uptrends so fine.
Adjusted Stop Loss: Maintain $274.17.
6/4: XLG – Trade: Bought the ETF at $195.01.
Original Technical Setup: Bullish consolidation at the high end of a Bullish +WRB, follow by a Bullish Breakdown Failure (+BDF) reversal.
Trade Update: Last Friday, XLG gapped down under the stalled consolidation but closed with a Bottoming Tail above the r20-MA. Weekly and monthly charts are still in bullish uptrends so fine.
Adjusted Stop Loss: $189.98. Update: Acting well, no changes needed.
For product and subscription information to this incredible service, please see ETF Investment Trader, Click HERE.
Master Trader and You Building Your Financial Future Together
Happy trading! If you have any questions or comments, please e-mail Greg Capra at Greg@mastertrader.com or Dan Gibby at Dan@mastertrader.com
All the best,
Greg Capra
Managing Director of Master Trader
Trading the Pristine Method — Origin and End
Dan Gibby
Chief Options Strategist
Follow Greg on Twitter, YouTube, and StockTwits to get real-time updates and education:
Twitter: @GregCapra
Stocktwits: Greg_Capra
youtube.com/c/mastertrader (please subscribe to receive all the timely stock market updates)
NOTE: Master Trader will show opening and closing prices of all stock and options trades. We recommend that all traders and investors use proper share sizing for positions and money management. However, we cannot recommend what that is for your particular trading style, risk tolerance, or account balance.
We urge you to calculate your own share/position size based on your individualized risk parameters, Trading Plan, and familiarity with the proposed trade strategy and risk. Advanced Management Strategies (AMS) covers in detail foundational and advanced position and money management.
NOTE: Master Trader and its representatives may have existing positions in actual or other trade recommendations before or after suggested herein. Additionally, we may manage them differently for internal purposes based on different risk parameters than noted herein.
All trade ideas and content are for informational and educational purposes only. It is not, nor is it intended to be, trading or investment advice or a recommendation that any security, option or investment strategy is suitable for any person. Trading securities can involve high risk and the loss of any funds. Investment or trading information provided may not be appropriate for all investors, and is provided without respect to individual financial sophistication, financial situation, investing time horizon or risk tolerance. Supporting documentation for any claims (including claims made on behalf of options programs), comparison, statistics, or other technical data, if applicable, will be supplied upon request. Master Trader Consulting, Inc. is not a licensed financial advisor, registered investment advisor, or a registered broker-dealer. Options, futures and futures options are not suitable for all investors. Prior to trading securities products, please read the Characteristics and Risks of Standardize Options and the Risk Disclosure for Futures and Options found here: CLICK HERE.
