
 The broader markets and sectors were mixed last week. Internet stocks continue to lead the way higher, and energy stocks that were showing relative strength in April and part of May were the leaders on the downside.
By the middle of last week, we knew that the odds had increased dramatically to see some corrective action. This market bias was based on options traders increasing their bullish bets to a historic extreme. That rarely fails to produce some corrective action in the broader markets.
As I explained in the Green Room, the corrective action expected did not mean the end of the current bullish uptrend. However, the odds of continuing that uptrend without at least a minor pullback or sideways move was low.
You can access a 3-day trial of the room here. Advisory subscribers do get a significant discount to the room.
With the help primarily from the Internet Sector, the NASDAQ was able to put in a respectable gain of just over 1%. The Dow and the S&P 500 measured by their ETF’s were down 1% and .38%, respectively.
The Transportation Sector ETF symbol IYT did well with a 1.25% gain on the week. With the Transports starting to perform well and “bring up the rear,” it supports a continued bullish bias for the broader markets.
Crude oil futures fell sharply on Friday — down almost 4%, which helped the Transportation Index recover from its opening gap down and end the day with a Bullish Wide Range Bar (+WRB).
However, with the wrong-way option traders’ sentiment still at a bullish extreme, it suggests that some choppy price action is likely before seeing further upside.
All of the broader markets gapped lower on Friday on the news of trade wars between the US and China. And while the gap lower was relatively significant percentage-wise, the majority of losses were erased by the end of the day.
Those of you that have taken Master Trader Technical Strategies (MTS) should have been on the lookout for the turn that occurred exactly at the 10:30 ET reversal.
Reversal periods do not indicate the end of a trend; however, many intraday uptrends and downtrends have stalled or reversed at that reversal period.
Dow Jones Industrial Average
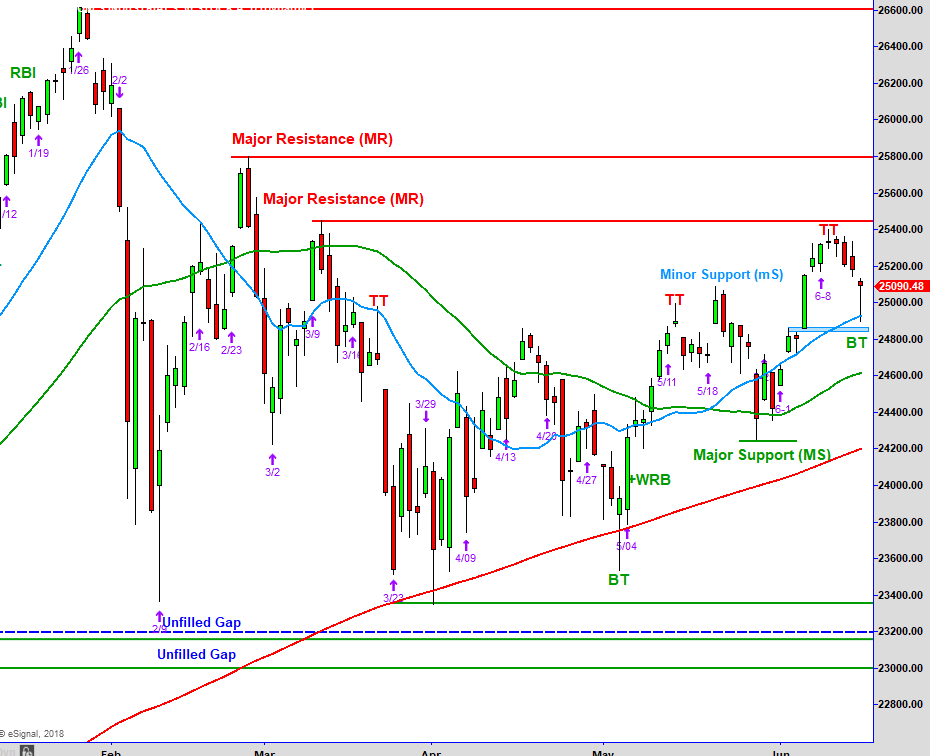
Above is the chart of the Dow Jones Industrial Average that we review each week. The Dow started off last Monday moving right up into the Major Resistance (MR) reference point that we have had marked off for months.
Considering that the prior week moved almost straight up into it, it was a high likelihood that prices would stall there and possibly pull back. As already mentioned, the “wrong way option traders” went “all in” mid-week with their bullish bets.
Why would they do this at the worst possible time being right at MR? First, most would not even know that MR is there. Then, based on the markets having moved up as they did, it “seemed obvious” to them that the only direction was up, and a sure bet.
Monday closed with a Topping Tail (TT) and the pullback began in the Dow and, to a lesser extent, in some other indices. Friday’s gap down and selling ended at the rising 20-MA (blue line) and, by the end of the day, the Dow formed a Bottoming Tail (BT).
A Bottoming Tail within an uptrend is a good reversal signal and this BT is also a Range Expansion (RE) bar. This signals that there was a lot of fear during the formation, which turned into greed.
In other words, after prices having pulled back throughout the week and reaching a reference point of price support — and rising moving average, buyers believed that was a good point to step in.
But that being said, this was a relatively sharp angle that it dropped at, which was followed by a Range Expansion candle. A move higher with that scenario historically doesn’t resume until there has been a contraction in range and a decrease in volatility. This view is also supported by sentiment still at a bearish extreme.
Realize that directional option strategies lose money because of time decay. So a bearish extreme in sentiment does not have to result in a large price correction lower to work off that extreme. Just the fact that the broader markets do not advance in a timely manner relative to expiration, options traders lose money.
Directional option strategies produce large gains relative to options spreads strategies; however, if you’re not right on the direction and timing of it, you lose.
If you would like to learn to master trading credit spreads for income, check out Dan’s course on doing exactly that. Mastering Advanced Credit Spreads.
If you have not subscribed to our new Facebook Live show, Go to this page on Facebook and press the Send Message button. Dan and I discuss various topics on the market, trading concepts and tradable instruments Wednesday’s @12 ET.
Market Overview Video
NEW STOCK TRADE IDEAS
Below is a daily chart of Texas Instruments Incorporated (TXN).
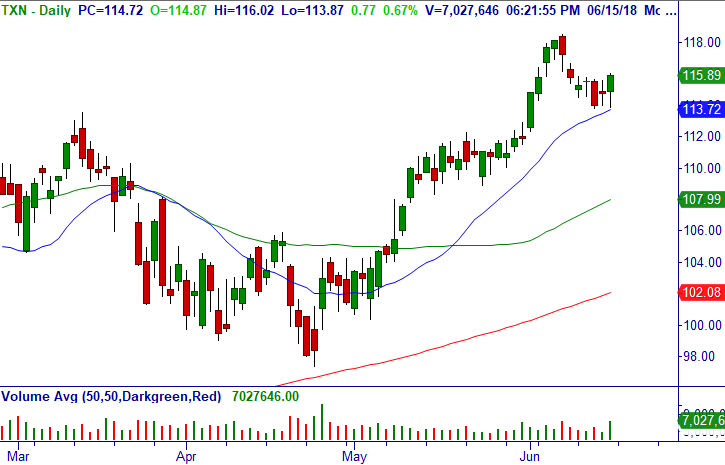
Trade: Over $116.02, consider buying stock.
Technical Setup: Master Trader Buy Setup with Bottoming Tail after Breakdown Failure on r20-MA daily, bullish weekly and monthly.
Stop Loss: $113.86.
Below is a daily chart of CSX Corporation (CSX).
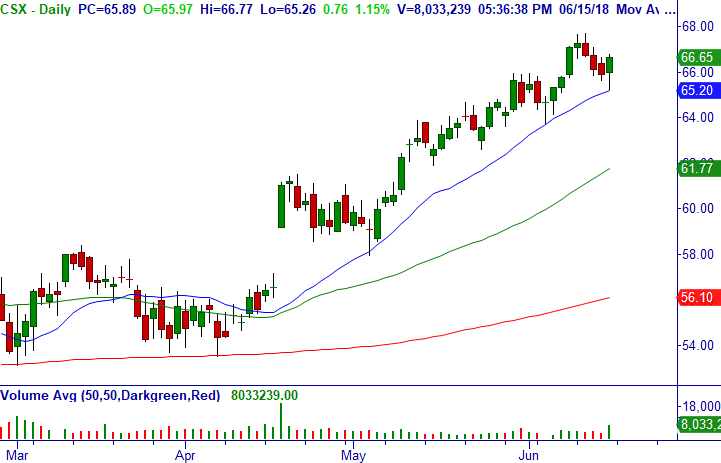
Trade: Over $66.77, consider buying stock.
Technical Setup: Master Trader Buy Setup with Bottoming Tail on Minor Support and r20-MA daily.
Stop Loss: $65.25.
Below is a daily chart of Lands’ End, Inc. (LE).
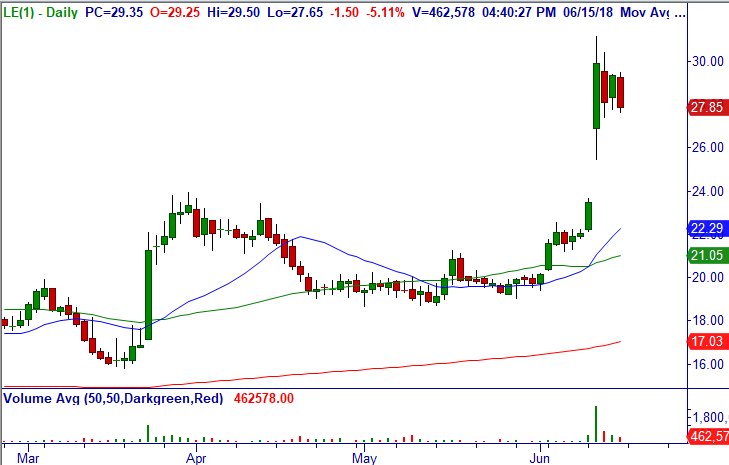
Trade: Over $29.50, consider buying stock.
Technical Setup: Bullish consolidation after Pro Gap +WRB Breakout daily, bullish weekly and monthly breakout.
Stop Loss: $27.38.
Below is a weekly chart of Craft Brew Alliance, Inc. (BREW).
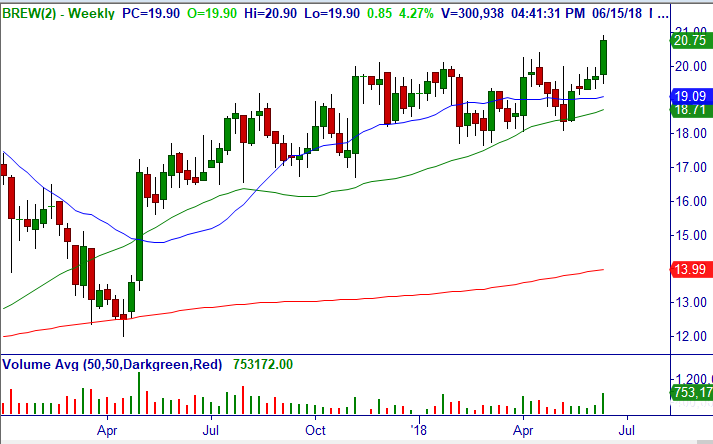
Trade: Over $20.80, consider buying stock.
Technical Setup: Bullish +WRB Breakout from multi-month consolidation daily, weekly and monthly.
Stop Loss: $19.89.
NEW OPTION TRADE IDEAS
Below is a daily chart of SPDRÂ S&P Oil & Gas Explor & Prodtn ETF (XOP).
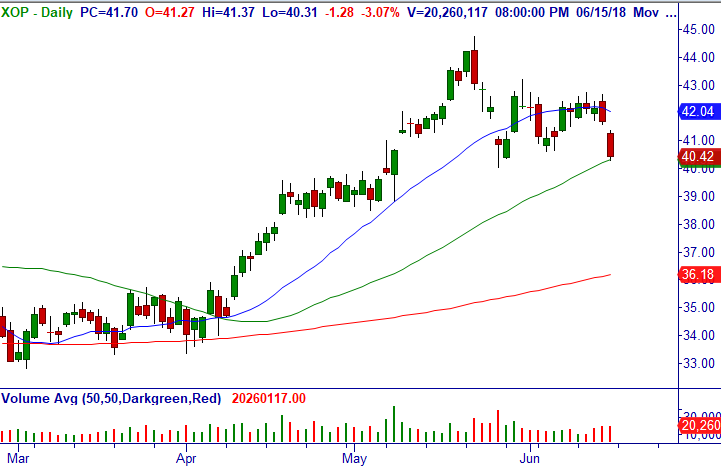
Trade: Provided it opens below $40.80, under 5-Min. low consider shorting Jul (7/20) $43/47 bear call credit spread (33 DTE) around closing mid-point of $.42/share.
Technical Setup: Breakdown below d20-MA daily, relative weakness.
Option Strategy: Bear Call Credit Spread (BCCS).
Stop Loss: $42.71.
Below is a daily chart of WPX Energy, Inc. (WPX).
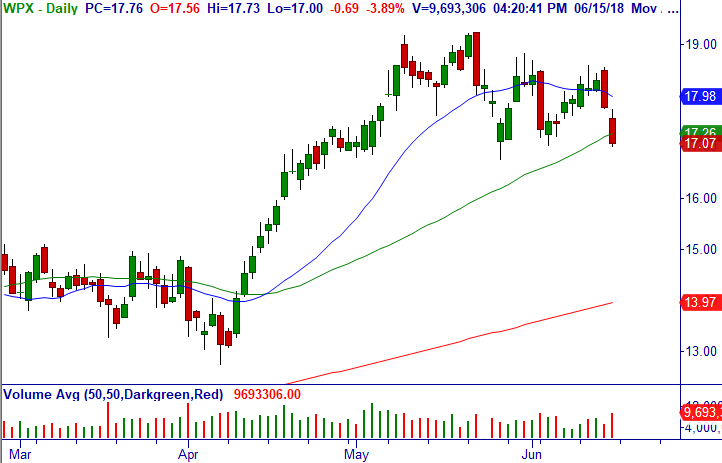
Trade: Provided it opens below $17.30, under 5-Min. low consider shorting Jul (7/20) $19/21 bear call credit spread (33 DTE) around closing mid-point of $.25/share.
Technical Setup: Breakdown from Sell Setup at Major Resistance below d20-MA daily, weak sector.
Option Strategy: Bear Call Credit Spread (BCCS).
Stop Loss: $18.56.
VIDEO REVIEW OF RECENTLY CLOSED AND OPEN TRADES
Thank you for being a loyal subscriber and feel to email us with any questions or comments on anything.
Access Trading Credit Spreads Course here, it’s the best $97 dollars spent to get up to speed fast.
Master Trader and You Building Your Financial Future Together
Happy trading! If you have any questions or comments, please e-mail Greg Capra at Greg@mastertrader.com or Dan Gibby at Dan@mastertrader.com
All the best,
Greg Capra
Managing Director of Master Trader
Trading the Pristine Method — Origin and End
Dan Gibby
Chief Options Strategist
Follow Greg on Twitter, YouTube, and StockTwits to get real-time updates and education:
Twitter: @GregCapra
Stocktwits: Greg_Capra
youtube.com/c/mastertrader (please subscribe to receive all the timely stock market updates)
NOTE: Master Trader will show opening and closing prices of all stock and options trades. We recommend that all traders and investors use proper share sizing for positions and money management. However, we cannot recommend what that is for your particular trading style, risk tolerance, or account balance.
We urge you to calculate your own share/position size based on your individualized risk parameters, Trading Plan, and familiarity with the proposed trade strategy and risk. Advanced Management Strategies (AMS) covers in detail foundational and advanced position and money management.
NOTE: Master Trader and its representatives may have existing positions in actual or other trade recommendations before or after suggested herein. Additionally, we may manage them differently for internal purposes based on different risk parameters than noted herein.
All trade ideas and content are for informational and educational purposes only. It is not, nor is it intended to be, trading or investment advice or a recommendation that any security, option or investment strategy is suitable for any person. Trading securities can involve high risk and the loss of any funds. Investment or trading information provided may not be appropriate for all investors, and is provided without respect to individual financial sophistication, financial situation, investing time horizon or risk tolerance. Supporting documentation for any claims (including claims made on behalf of options programs), comparison, statistics, or other technical data, if applicable, will be supplied upon request. Master Trader Consulting, Inc. is not a licensed financial advisor, registered investment advisor, or a registered broker-dealer. Options, futures and futures options are not suitable for all investors. Prior to trading securities products, please read the Characteristics and Risks of Standardize Options and the Risk Disclosure for Futures and Options found here: CLICK HERE.
