
 The broader markets did it again — another week of ending approximately where it was at the prior week’s end. So far, this has been a consolidation after the strong move that began at the beginning of May.
Historically, these types of patterns resolve themselves by moving higher. And while there were improvements last week to suggest that may happen this week, that move may not be as broad-based as the one that started the move.
What looks like it will lead a move higher, assuming that does happen, is what has outperformed in the past: that the being Technology and Internet sectors.
As mentioned in last Monday’s commentary, the week was heavy with earnings reports in the Retail sector. And retail stocks were some of the best and worst performers for that week.
Foot Locker (FL), Tiffany (TIF) and Ralph Lauren (RL) were the top performers, while Best Buy (BBY), Gap (GPS), Target (TGT) and Ross Stores (ROST) were among the worst. That kept the sector ETF symbol XRT relatively unchanged, which is an example of how ETF diversification can neutralize the positive and negative.
The best performing sector last week was Utilities, which benefited from the drop in interest rates. That performance came after a relatively large correction caused by rising interest rates, so it was a relief rally within the existing downtrend. We will be watching to see if there is a continuation of this move this week.
The Home Construction sector ETF symbol ITB mentioned last week did improve, which was helped by the decline in interest rates. While it was not able to overcome the price resistance, the depth of the retracement into that resistance does suggest a short-term bottom. We will see if it can clear it soon.
The Technology sector ETF symbol XLK looks poised to break out above its recent highs. We initiated a long position in it on Friday in the Green Room in anticipation of that happening.
The Internet sector ETF symbol FDN also looks poised to break out above the recent highs. For it, this would be a move to new all-time highs.
In last Monday’s letter, I said, “The Energy sector was among the best performing last week; however, I think it’s near a short-term top.” Crude oil and the Energy sector fell sharply last week and were the worst performing sectors last week.
I’m hopeful that the broader markets can get out of this tight range that it’s been in lately and move higher as last week’s price action in the technology and Internet ETF’s suggests that it can.
DOW JONES INDUSTRIAL AVG.
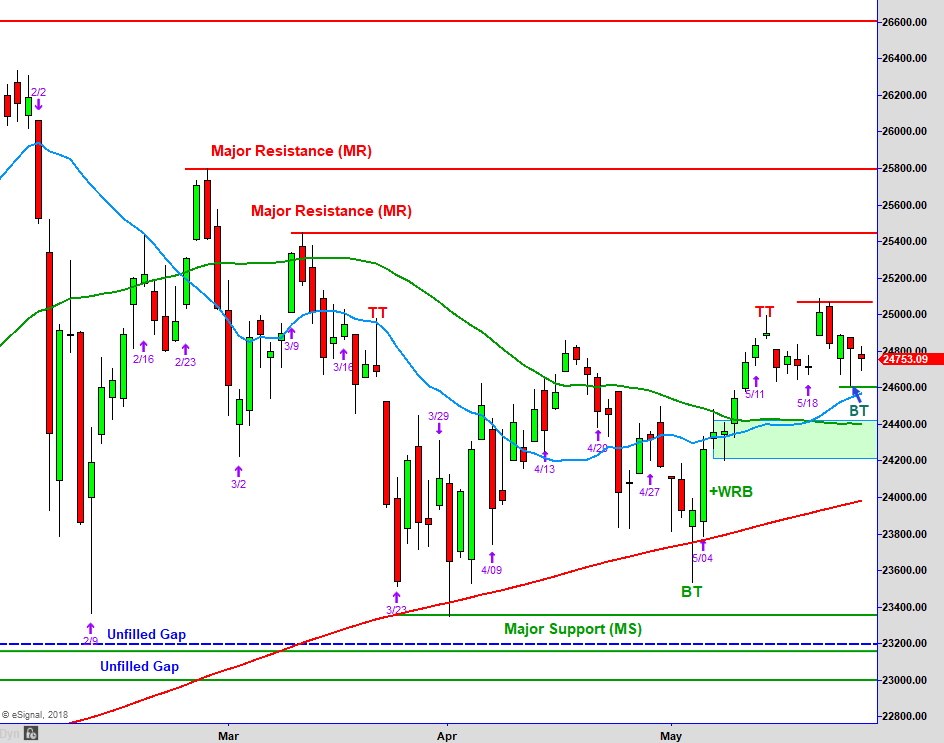
Above is the chart of the Dow Jones Industrial Average that we review each week. As you can see, the last candle on the chart is close to the prior week’s closing candle on 5/18, so very little movement from one week to another.
Last week started with a gap up from the prior week and did close relatively close to the high of the session, but it couldn’t follow through the next day. Tuesday opened higher near Monday’s high, but buyers lost confidence quickly and prices fell, closing the day with a large bearish candle.
Selling followed through the next day, but this time the sellers lost confidence and buyers took back control. That led us into Thursday where the whipsaw action continued with the drop lower that was followed by the rally higher.
Friday ended trading inside of Thursday’s range and it was a quiet day of trading ahead of the holiday weekend.
The short version is neither buyers nor sellers had the confidence to push prices higher or lower very much and it was another week of “running in place.”
So, for the Dow, we have new short-term reference points of support (green line) and resistance (red line). That being said, a move above or below Thursday’s bottoming tail bar could trigger a move in either direction.
Market Overview Video
[s3mv fileName=’May+Letters+2018/Letter_5_29_18.mp4′ fileType=’video’ source=’s3′ width=’800′ height=’450′ splashImage=” preLoad=’Y’ autoPlay=’N’ belowVideoHTML=” cuePoint=” redirectURL=” pauseAtCuePoint=’N’ isSecure=’Y’ bucketname=”]
NEW STOCK TRADING IDEAS
Below is a daily chart of PowerShares QQQ ETF (QQQ).
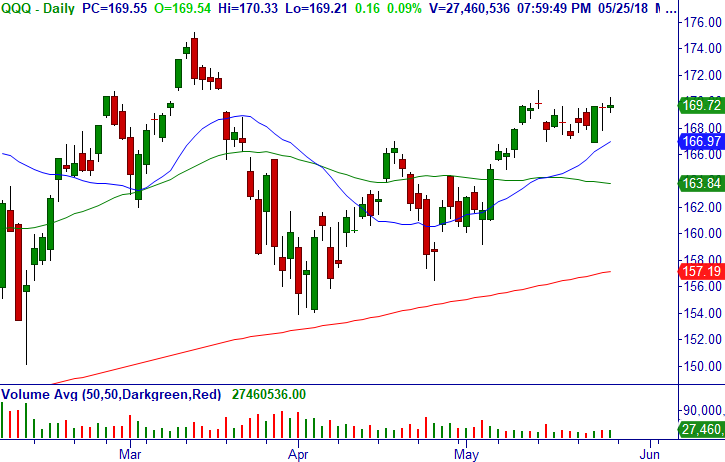
Trade: Over $170.33, consider buying QQQ.
Technical Setup: Bullish consolidation at the high end of +WRB engulfing bar after gap down to r20-MA daily, bullish weekly and monthly.
Stop Loss: $167.83.
Below is a daily chart of CommScope Holding Company, Inc. (COMM).
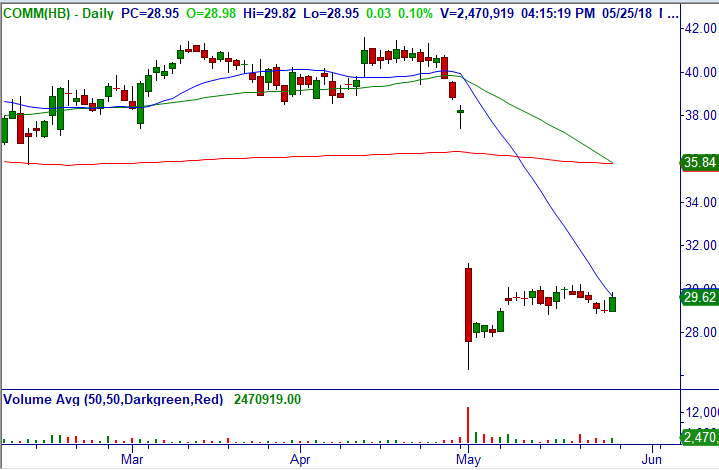
Trade: Under $28.95, consider shorting stock.
Technical Setup: Bearish consolidation after Pro Gap Breakdown and -WRB daily, bearish weekly and monthly.
Stop Loss: $29.83.
Below is a daily chart of Mastercard Incorporated (MA).
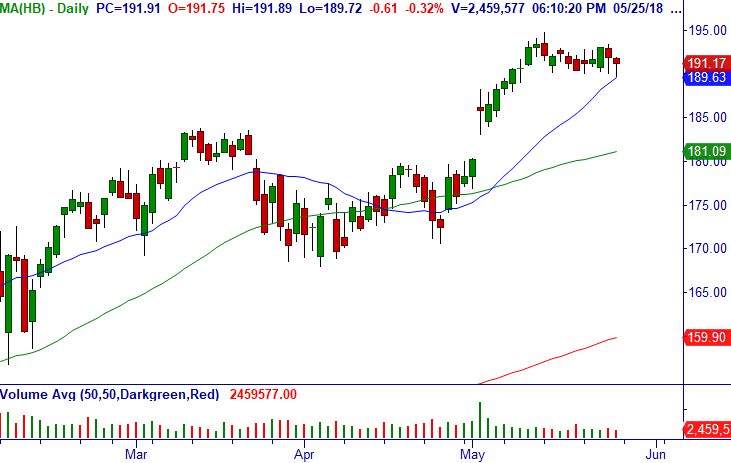
Trade: Over $193.30, consider buying stock.
Technical Setup: Bullish consolidation into the r20-MA daily, and will be breakdown failure if triggers, bullish weekly and monthly.
Stop Loss: $189.71.
Below is a daily chart of Intel Corporation (INTC).
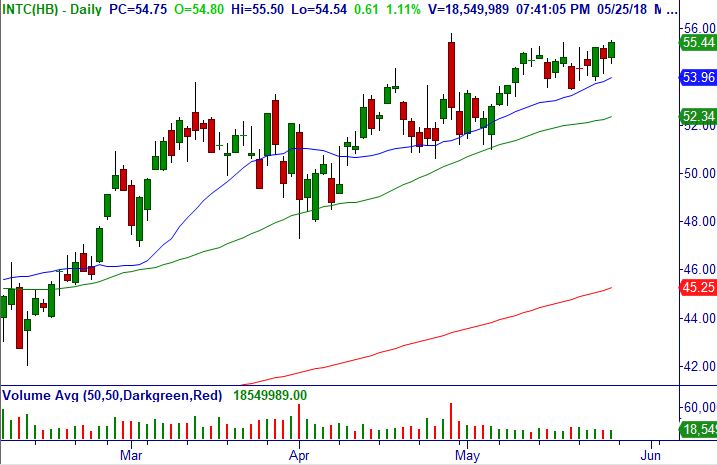
Trade: Over $55.50, consider buying stock.
Technical Setup: Bullish consolidation breakout above r20/50-MA daily, bullish weekly and monthly, and outperforming SMH (semiconductor ETF) which just broke out.
Stop Loss: $53.83.
Below is a weekly chart of MGM Resorts International (MGM).
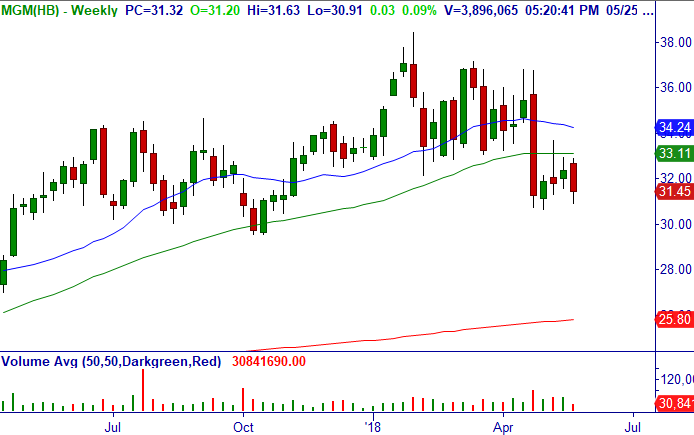
Trade: Under $30.86, consider shorting stock.
Technical Setup: Master Trader Sell Setup at the 50-MA with bearish engulfing bar weekly, bearish monthly.
Stop Loss: $32.91.
NEW OPTION TRADING IDEAS
Below is a daily chart of Visa Inc. (V).
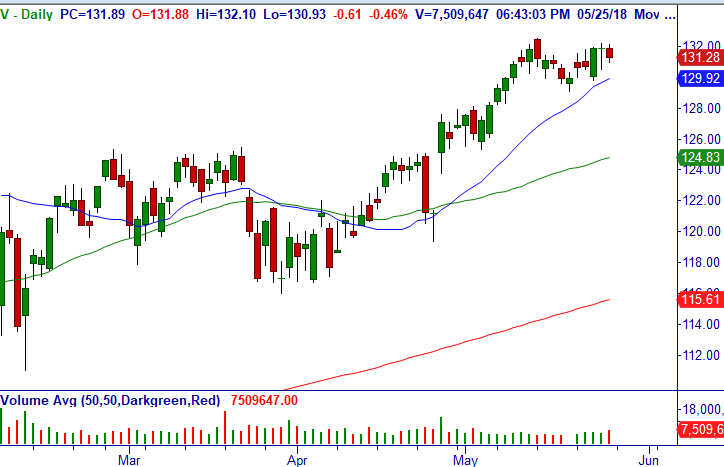
Trade: Over $132.21, consider shorting Jun (6/15) $129/124 bull put credit spread (18 DTE) for mid-point but a limit of $.65/share (closed at $.76/share).
Technical Setup: Bullish consolidation at the high end of +WRB engulfing bar after gap down to r20-MA daily, bullish weekly and monthly.
Option Strategy: Bull Put Credit Spread (BPCS).
Stop Loss: $129.78.
Below is a daily chart of Apple Inc. (AAPL).
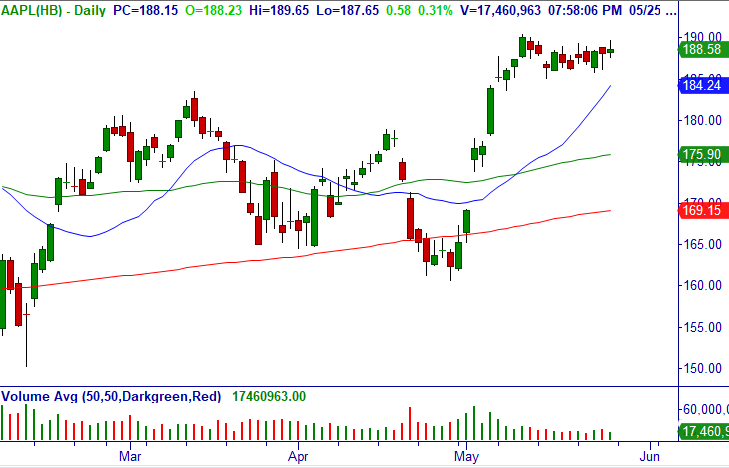
Trade: Over $189.65, consider buying Jun (6/15) $180/195 bull call debit spread (18 DTE) for mid-point but will have positive time value/cushion (closed at $8.58/share).
Technical Setup: Bullish consolidation following breakout to all-time highs daily, bullish weekly and monthly.
Option Strategy: Bull Call Debit Spread (BCDS).
Stop: $185.75.
Below is a daily chart of Microsoft Corporation (MSFT).
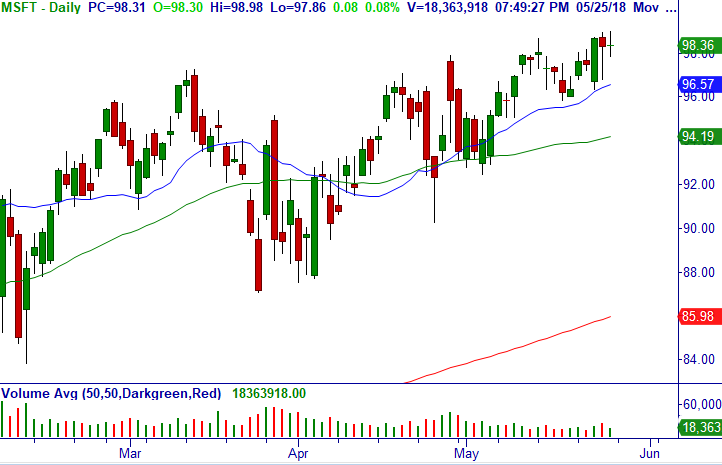
Trade: Over $99.00, consider shorting Jun (6/15) $96/90 bull put credit spread (18 DTE) for mid-point but a limit of $.55/share (closed at $.60/share).
Technical Setup: Bullish consolidation at the high end of +WRB engulfing bar after gap down to r20-MA daily, bullish weekly and monthly.
Option Strategy: Bull Put Credit Spread (BPCS).
Stop Loss: $96.28.
Below is a daily chart of Masco Corporation (MAS).
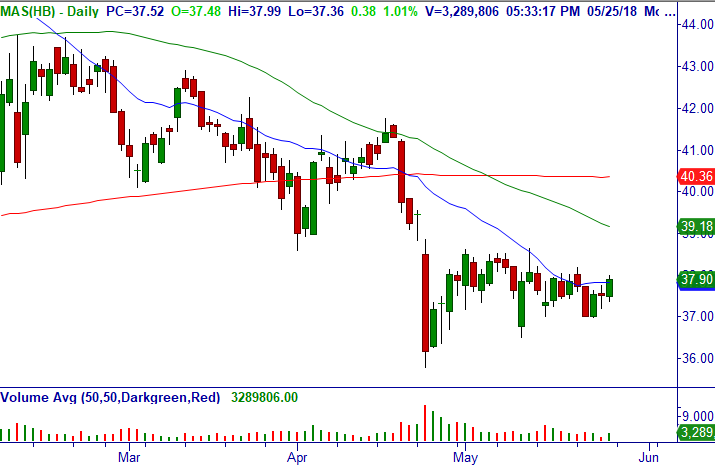
Trade: Over $38.00, consider shorting Jun (6/15) $37/34 bull put credit spread (18 DTE) for mid-point but a limit of $.37/share (closed at $.40/share).
Technical Setup: Consolidation with higher lows at the 20-MA daily, with multiple bullish Bottoming Tails on the weekly chart.
Option Strategy: Bull Put Credit Spread (BPCS).
Stop Loss: $36.98.
Below is a daily chart of Facebook, Inc. (FB).

Trade: Over $186.80, consider shorting Jun (6/1) $182.5/177.5 bull put credit spread (5 DTE) for mid-point but a limit of $.50/share (closed at $.60/share).
Technical Setup: Two-day consolidation inside a +WRB engulfing bar after gap down to r20-MA daily.
Option Strategy: Bull Put Credit Spread (BPCS).
Stop Loss: $182.17.
Thank you for being a loyal subscriber and feel to email us with any questions or comments on anything.
Access Trading Credit Spreads Course here, it’s the best $97 dollars spent to get up to speed fast.
Master Trader and You Building Your Financial Future Together
Happy trading! If you have any questions or comments, please e-mail Greg Capra at Greg@mastertrader.com or Dan Gibby at Dan@mastertrader.com
All the best,
Greg Capra
Managing Director of Master Trader
Trading the Pristine Method — Origin and End
Dan Gibby
Chief Options Strategist
Follow Greg on Twitter, YouTube, and StockTwits to get real-time updates and education:
Twitter: @GregCapra
Stocktwits: Greg_Capra
youtube.com/c/mastertrader (please subscribe to receive all the timely stock market updates)
NOTE: Master Trader will show opening and closing prices of all stock and options trades. We recommend that all traders and investors use proper share sizing for positions and money management. However, we cannot recommend what that is for your particular trading style, risk tolerance, or account balance.
We urge you to calculate your own share/position size based on your individualized risk parameters, Trading Plan, and familiarity with the proposed trade strategy and risk. Advanced Management Strategies (AMS) covers in detail foundational and advanced position and money management.
NOTE: Master Trader and its representatives may have existing positions in actual or other trade recommendations before or after suggested herein. Additionally, we may manage them differently for internal purposes based on different risk parameters than noted herein.
All trade ideas and content are for informational and educational purposes only. It is not, nor is it intended to be, trading or investment advice or a recommendation that any security, option or investment strategy is suitable for any person. Trading securities can involve high risk and the loss of any funds. Investment or trading information provided may not be appropriate for all investors, and is provided without respect to individual financial sophistication, financial situation, investing time horizon or risk tolerance. Supporting documentation for any claims (including claims made on behalf of options programs), comparison, statistics, or other technical data, if applicable, will be supplied upon request. Master Trader Consulting, Inc. is not a licensed financial advisor, registered investment advisor, or a registered broker-dealer. Options, futures and futures options are not suitable for all investors. Prior to trading securities products, please read the Characteristics and Risks of Standardize Options and the Risk Disclosure for Futures and Options found here: CLICK HERE.
