
 Last week’s range in the broader markets was the narrowest for the year. The last three trading days of last week barely moved. The closing change over those three days in the S&P 500 was only a point and ½ and the Dow moved just over eight points.
Contractions in range and volatility rarely stay this way for long, so the expectation is that an expansion is coming in the near future.
The question that we all want to know is, in what direction will this expansion in range be in? I will address that in a systematic way as much I can in the video.
Earnings season is nearing its end; however, this week is relatively heavy in the Retail sector.
Some notables are: AutoZone (AZO), Cracker Barrel (CBRL), Urban Outfitters (URBN), Dollar Tree (DLTR), Gap (GPS), Ralph Lauren (RL), Sears (SHLD), Target (TGT), Tiffany (TIF), Best Buy (BBY), Ross Stores (ROST), and Foot Locker (FL).
In the Technology sector, there are a few notables: Intuit (INTU), Autodesk (ADSK), Hewlett Packard (HPE) and Netapp (NTAP).
The Home Construction sector is one of the worst performing sectors this year. After plunging lower on Tuesday and below a multiple month base, it rallied back to the bottom of that base during the rest of the week.
By the end of the week, a Bottoming Tail had formed on the sector ETF symbol ITB. We will be watching to see if the ETF can move back up to the top of the base. If it does, we are going to be interested in this sector ETF as a buy.
Within this sector, two companies report earnings this week. They are Toll Brothers (TOL) and Lowe’s Companies (LOW). We’ll be watching how the ETF reacts.
The Energy sector was among the best performing last week; however, I think it’s near a short-term top. There are several Energy sector ETF’s. While they typically move in the same direction together, they don’t all perform exactly the same.
The worst performer energy ETF last week was the symbol XLE. It may be in the process of forming a Breakout Bar Failure (-BBF).
We will see early in the week if it plays out.
Market Overview Video
[s3mv fileName=’May+Letters+2018/MarketOverview_5_22_18.mp4′ fileType=’video’ source=’s3′ width=’800′ height=’450′ splashImage=” preLoad=’Y’ autoPlay=’N’ belowVideoHTML=” cuePoint=” redirectURL=” pauseAtCuePoint=’N’ isSecure=’Y’ bucketname=”]
The Green Room
As I believe you know, we opened the Green Room about two weeks ago.
The goal of the room is to take advantage of investing and trading opportunities of course. With the ability to update trades, management and exit of positions in the moment, we also take advantage of day trading opportunities.
For many of the members, the greatest value has been the education that we provide each day. In addition, it is the ability for us to provide a review of a member’s own trades for them when asked.
Our ability to give a thorough review and analysis of what was done correctly — and, more importantly, incorrectly — has been invaluable to them.
Each day in the room is like an investing trading course in stocks and options that never stops. If you have not taken a trial yet, register here and join us.
NEW STOCK TRADING IDEAS
Below is a daily chart of Abercrombie & Fitch Co. (ANF).
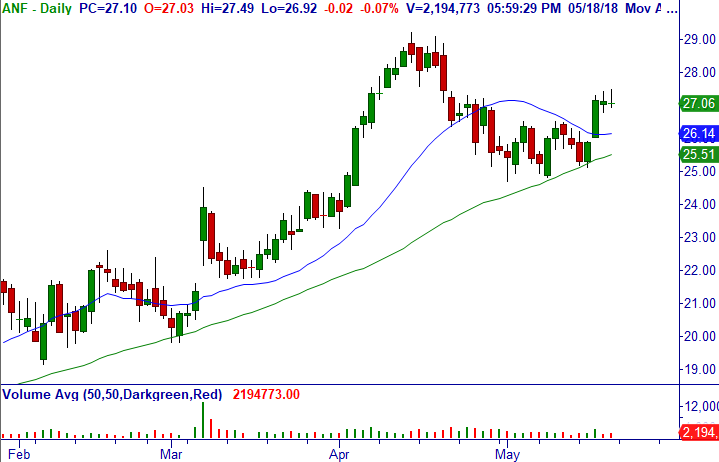
Trade: Over $27.49, consider buying stock.
Technical Setup: Two Doji Bars in the upper part of +WRB Breakout from W-Bottom consolidation at r50-MA daily, bullish weekly.
Stop Loss: $26.02. Earnings 6/1.
Below is a daily chart of Shutterfly, Inc. (SFLY).
Please read below.
NEW OPTION TRADING IDEAS
Below is a daily chart of Shutterfly, Inc. (SFLY).
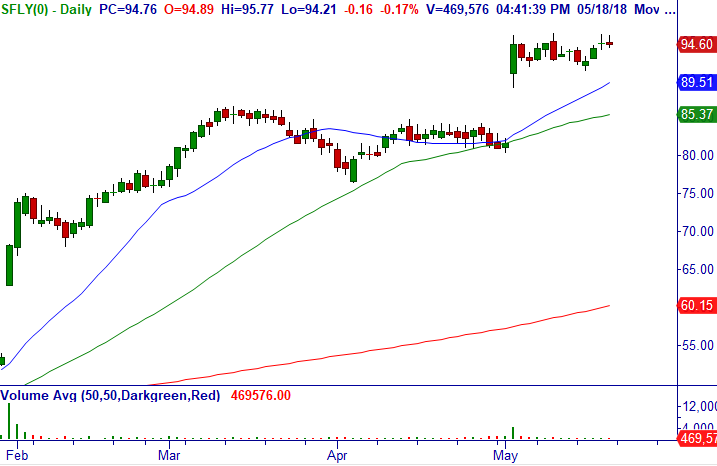
Trade: Over $95.88, consider shorting Jun (6/15) $90/85 bull put credit spread (26 DTE) for a limit of $.65/share (closed at $.70/share). Note: This stock tends to have wider spreads between the bid and ask.
As a stock Trading Idea
This price pattern is also suitable for a swing long above $95.88 and a stop-loss below $91.00. Share-size accordingly.
Technical Setup: Breakout from bullish consolidation after Pro Gap +WRB breakout daily, bullish weekly.
Option Strategy: Bull Put Credit Spread (BPCS).
Stop Loss: $91.54.
Below is a monthly chart of SunPower Corporation (SPWR).
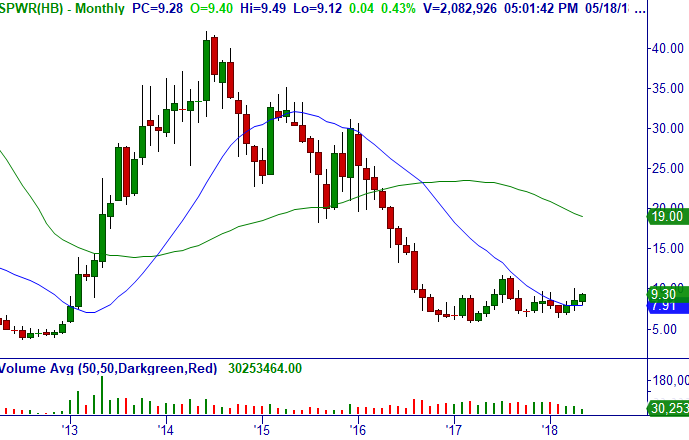
Trade: Over $9.49 or the 30-Min. high, consider shorting Jun (6/15) $9/7 bull put credit spread (26 DTE) for a limit of $.38/share (closed at $.42/share).
Technical Setup: Huge bullish W-Bottom monthly, bullish weekly, and sector (TAN) bullish.
Option Strategy: Bull Put Credit Spread (BPCS).
Stop Loss: $7.99.
Thank you for being a loyal subscriber and feel to email us with any questions or comments on anything.
Access Trading Credit Spreads Course here, it’s the best $97 dollars spent to get up to speed fast.
Master Trader and You Building Your Financial Future Together
Happy trading! If you have any questions or comments, please e-mail Greg Capra at Greg@mastertrader.com or Dan Gibby at Dan@mastertrader.com
All the best,
Greg Capra
Managing Director of Master Trader
Trading the Pristine Method — Origin and End
Dan Gibby
Chief Options Strategist
Follow Greg on Twitter, YouTube, and StockTwits to get real-time updates and education:
Twitter: @GregCapra
Stocktwits: Greg_Capra
youtube.com/c/mastertrader (please subscribe to receive all the timely stock market updates)
NOTE: Master Trader will show opening and closing prices of all stock and options trades. We recommend that all traders and investors use proper share sizing for positions and money management. However, we cannot recommend what that is for your particular trading style, risk tolerance, or account balance.
We urge you to calculate your own share/position size based on your individualized risk parameters, Trading Plan, and familiarity with the proposed trade strategy and risk. Advanced Management Strategies (AMS) covers in detail foundational and advanced position and money management.
NOTE: Master Trader and its representatives may have existing positions in actual or other trade recommendations before or after suggested herein. Additionally, we may manage them differently for internal purposes based on different risk parameters than noted herein.
All trade ideas and content are for informational and educational purposes only. It is not, nor is it intended to be, trading or investment advice or a recommendation that any security, option or investment strategy is suitable for any person. Trading securities can involve high risk and the loss of any funds. Investment or trading information provided may not be appropriate for all investors, and is provided without respect to individual financial sophistication, financial situation, investing time horizon or risk tolerance. Supporting documentation for any claims (including claims made on behalf of options programs), comparison, statistics, or other technical data, if applicable, will be supplied upon request. Master Trader Consulting, Inc. is not a licensed financial advisor, registered investment advisor, or a registered broker-dealer. Options, futures and futures options are not suitable for all investors. Prior to trading securities products, please read the Characteristics and Risks of Standardize Options and the Risk Disclosure for Futures and Options found here: CLICK HERE.
