
 If you have been to Disney World, you are familiar with the attraction there called “Mr. Toads Wild Ride.” Mr. Schizophrenic did not disappoint last week and sent the markets on its “wild ride.”
The plunge lower toward Major Support (MS), reversal higher — that was followed by Friday’s gap lower — and then the race higher into the close reminded me more of my first ride at Disney on Space Mountain!
If you have been on it, you know what I mean. Now what?
I’ll cover this extensively in the video review of the broader markets.
As difficult as it is to believe that this market is going to make a decisive move in a direction, the price action last week is telling us that the markets are going higher.
There is no market environment more difficult than this type we are experiencing at this time. That isn’t to say that this one is the most difficult.
Any market, commodity, currency or individual stock that is whipping back and forth in a consolidation is difficult to trade. Of course, standing aside is an option.
That being said, if we do not take opportunities in the direction of a meaningful reversal like the one seen last week, we will get left behind.
It’s not easy to trust that Mr. Schizophrenic isn’t going to whipsaw us again, but after multiple plunges down toward major support and prices reversing back up again, I believe that the weight of the evidence is on the bullish side.
We haven’t gone unscathed in this market environment and have taken a few lumps. It’s not the first time, but having done this now for close to three decades, I know that the storm always passes.
The key to longevity in the markets is an education of a sound method — and inevitably, calculated risks based on sound money management.
Having also been an educator of investing and trading the markets for just over two decades, I have also learned that those starting out in the markets typically leave the education of a method and money management until after the painful losses.
I wish I could say that I was different in that respect, but I wasn’t.
DOW JONES INDUSTRIAL AVG.
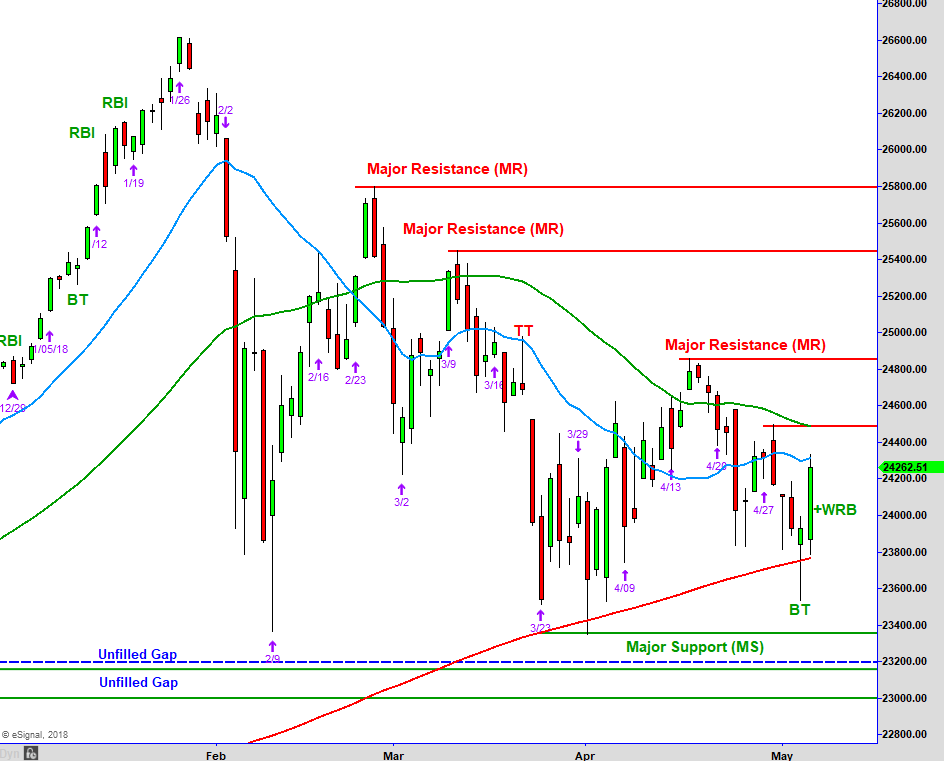
Above is the chart of the Dow Jones Industrial Average that we review each week. On Thursday, the morning move lower left little doubt at the moment that prices were going lower to the area of Major Support (MS) below.
Mr. Schizo had other plans. After about an hour of chopping back and forth, prices began to creep higher during the lunch hour.
Once prices reached the unfilled gap and Minor Resistance (mR) above, they went flat for the last two hours of the day. But a Bottoming Tail (BT) formed.
Friday morning, prices gap lower under that consolidation and buyer stepped up again pushing up into the consolidation above.
Once prices got through it, they never look back and rallied all the way into the last hour of the day where there was some minor profit-taking.
Friday ended with a Wide Range Bar (+WRB) and that is bullish after the previous day’s plunge lower that resulted in a BT.
After an almost 1000 point weekly range and 800 point range from Thursday’s low to Friday’s high, the Dow ended lower just over 48 points for the week.
While Mr. Schizophrenic has my confidence level a bit against the ropes, I cannot pass up the opportunity to be on the long side of this market right now.
As you know, we put on multiple positions into the end of the day on Friday expecting follow-through higher this week.
This certainly does not mean that Monday morning could not see some selling or just a choppy sideways day.
It’s common after a +WRB to see a Narrow Range Bar (NRB) day. Historically, this type of bottoming pattern with a BT and +WRB will see buyers on any dip lower.
On the other hand, and you know I always have at least two scenarios, it is quite possible that the broader markets gap higher Monday morning.
The first overhead resistance (red line) is not that far off, but this larger bottoming pattern should not stop prices from pushing through it for long.
If the anticipated advance does stall at the marked resistance area and reverse, it will be interesting to see if the bulls run for the exits again. Please say it isn’t so!
I would rather be long this market right now with a calculated risk of loss than the risk of being left behind. Stay tuned!
BROADER MARKETS
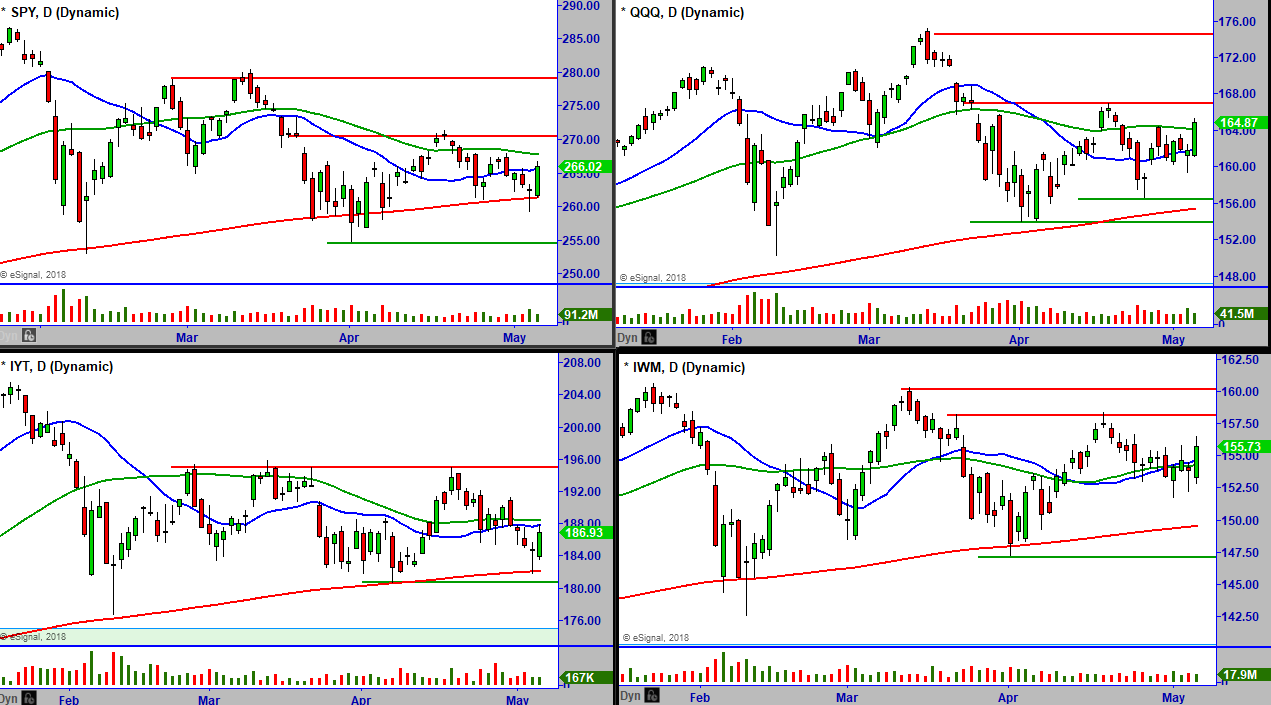
[s3mv fileName=’May+Letters+2018/BroaderMarkets_5_7_18.mp4′ fileType=’video’ source=’s3′ width=’800′ height=’450′ splashImage=” preLoad=’Y’ autoPlay=’N’ belowVideoHTML=” cuePoint=” redirectURL=” pauseAtCuePoint=’N’ isSecure=’Y’ bucketname=”]
TREND MATRIX AND INTERNALS
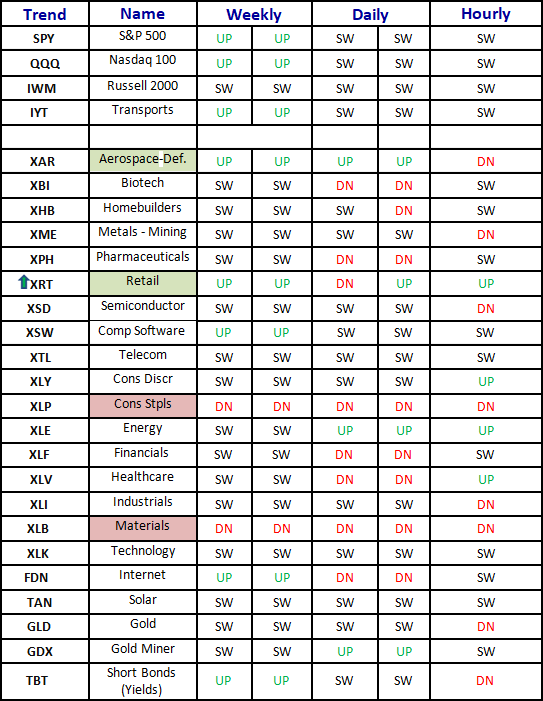
[s3mv fileName=’May+Letters+2018/Trends_5_7_18.mp4′ fileType=’video’ source=’s3′ width=’800′ height=’450′ splashImage=” preLoad=’Y’ autoPlay=’N’ belowVideoHTML=” cuePoint=” redirectURL=” pauseAtCuePoint=’N’ isSecure=’Y’ bucketname=”]

NEW STOCK TRADING IDEAS
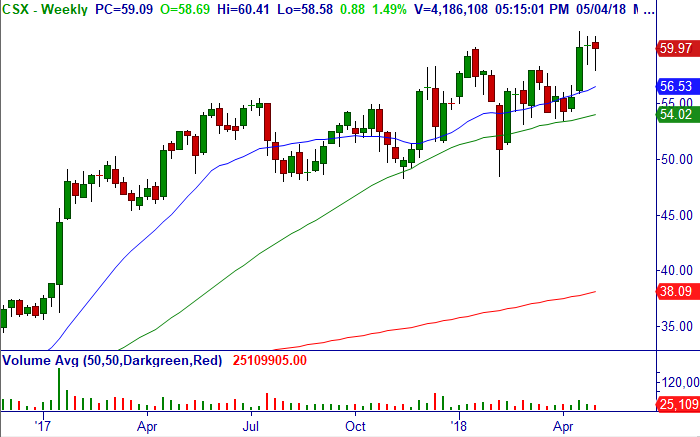
Trade: Over $60.41, consider buying stock.
Technical Setup: Bull flag consolidation after Pro Gap Breakout daily, bullish consolidation in upper 50% of +WRB Igniting Breakout weekly above r20/50-MA.
Stop Loss: $57.67.
Below is a daily chart of Visa Inc. (V).
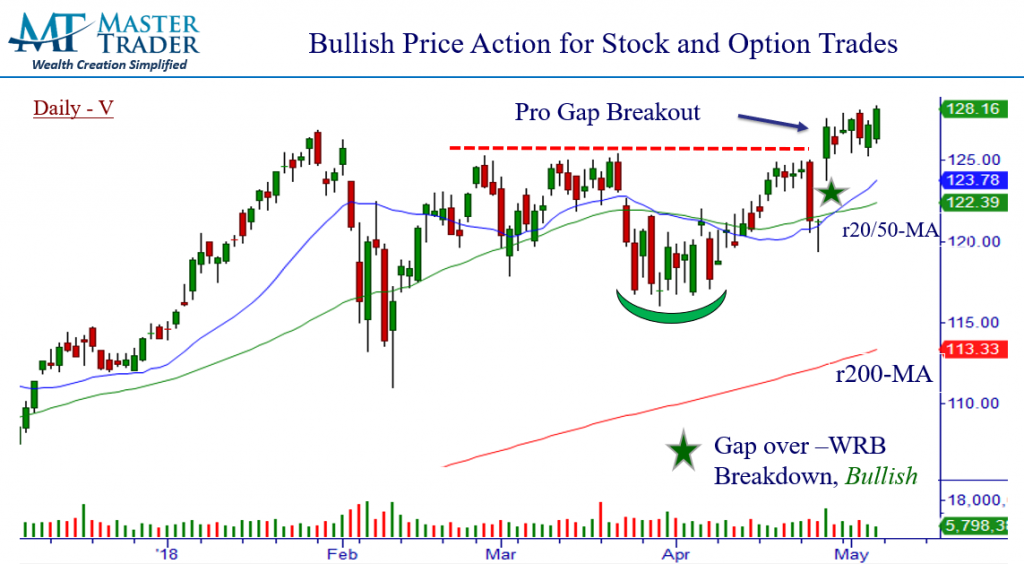
Trade: Over $128.36, consider buying stock.
Technical Setup: Breakout to all-time highs following Pro Gap over 4/2 -WRB on daily chart, bullish retest on r20-MA weekly, bullish monthly.
Stop Loss: $125.28.
Below is a weekly chart of The Cheesecake Factory Incorporated (CAKE).
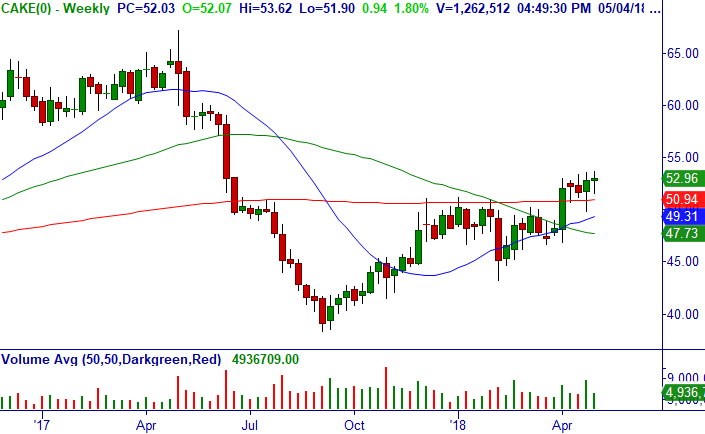
Trade: Over $53.13, consider shorting buying stock.
Technical Setup: Bullish consolidation in the top 50% of +WRB Breakout at 200-MA weekly, bullish reverse head and shoulders daily.
Stop Loss: $49.78.
NEW OPTION TRADING IDEAS
Below is a daily chart of Red Hat, Inc. (RHT).
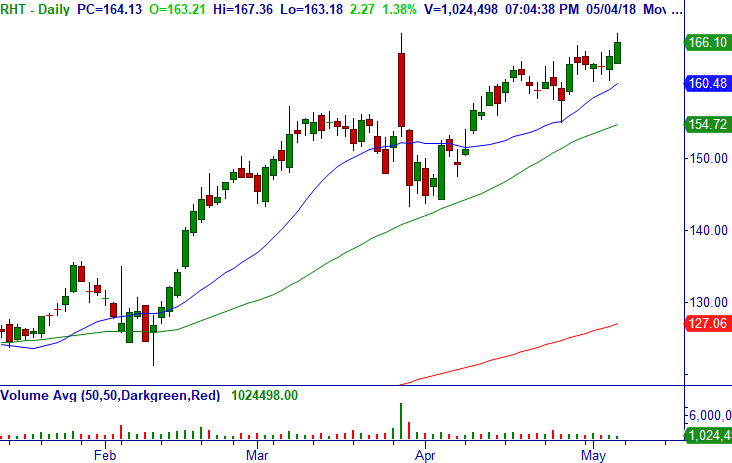
Trade: Over $166.35, consider shorting May (5/18) $160/150 bull put credit spread (12 DTE) for a limit of $1.07/share (closed at $1.17/share).
Technical Setup: Breakout daily, strong uptrend all time frames, relative strength.
Option Strategy: Bull Put Credit Spread (BPCS).
Stop Loss: $160.78.
Below is a daily chart of Alphabet Inc. (GOOGL).
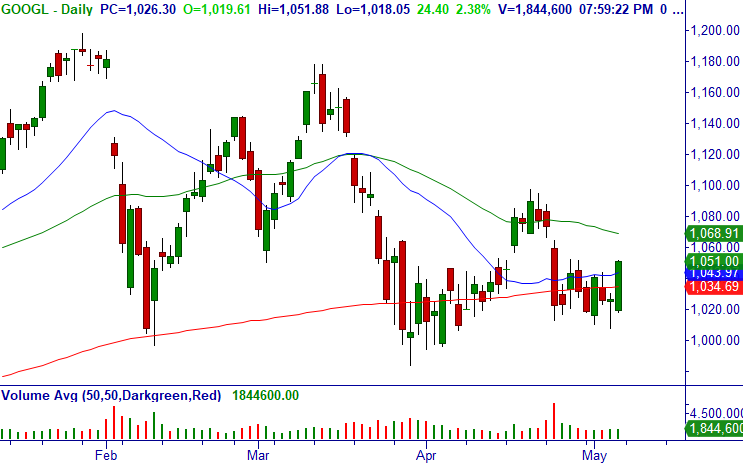
Trade: Over $1051.88, consider shorting May (5/18) $1000/980 bull put credit spread (12 DTE) for mid-point but a limit of $1.15/share (closed at $1.20/share).
Technical Setup: +WRB Breakout from bullish consolidation and Major Support at r200-MA.
Option Strategy: Bull Put Credit Spread (BPCS).
Stop Loss: $1,007.88.
Below is a daily chart of iPath S&P 500 VIX ST Futures ETN (VXX).
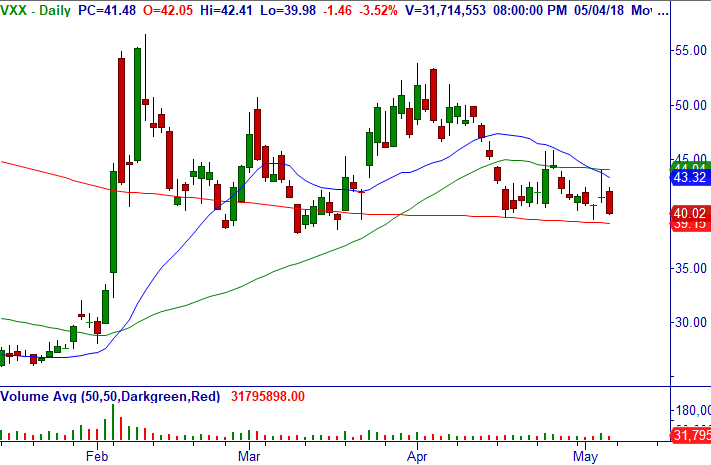
Trade: Under $39.98, consider shorting May (5/18) $45/55 bear call credit spread (12 DTE) for a limit of $.47/share (closed at $.51/share).
Technical Setup: Anticipated Breakdown after failed breakout daily (and moves opposite SPY, which is bottoming).
Option Strategy: Bear Call Credit Spread (BCCS).
Stop Loss: $44.12.
Below is a daily chart of SPDR S&P Oil & Gas Explor & Prodtn ETF (XOP).
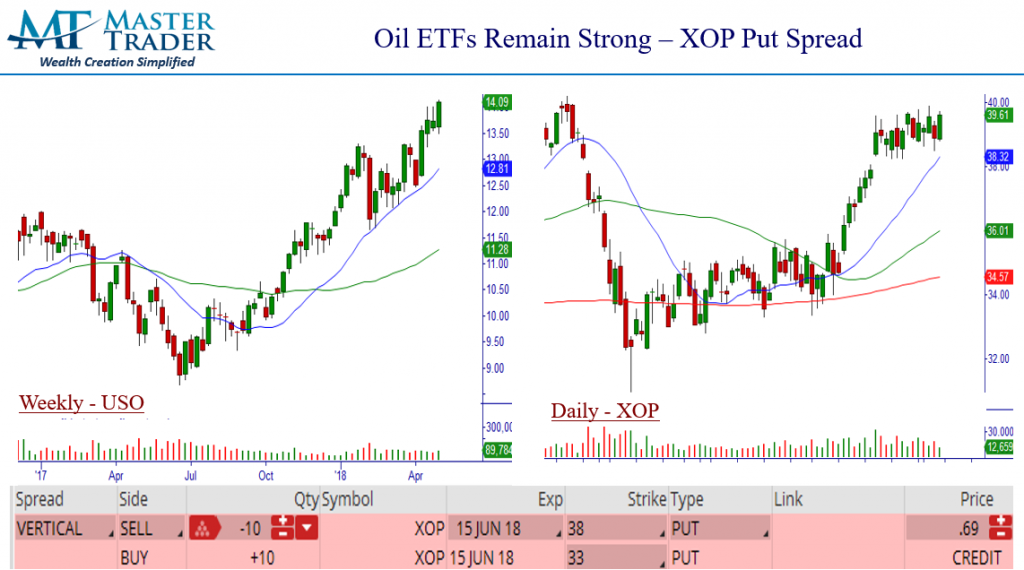
Trade: Over $39.75, consider shorting June (6/15) $38/33 bull put credit spread (40 DTE) for a limit of $.65/share (closed at $.69/share).
Technical Setup: Bullish consolidation at resistance after bullish move daily and weekly, with crude oil remaining strong (see weekly crude ETF above USO).
Option Strategy: Bull Put Credit Spread (BPCS).
Stop Loss: None, will take assignment if expires ITM because of bullish weekly/monthly.
Below is a daily chart of VMware, Inc. (VMW).
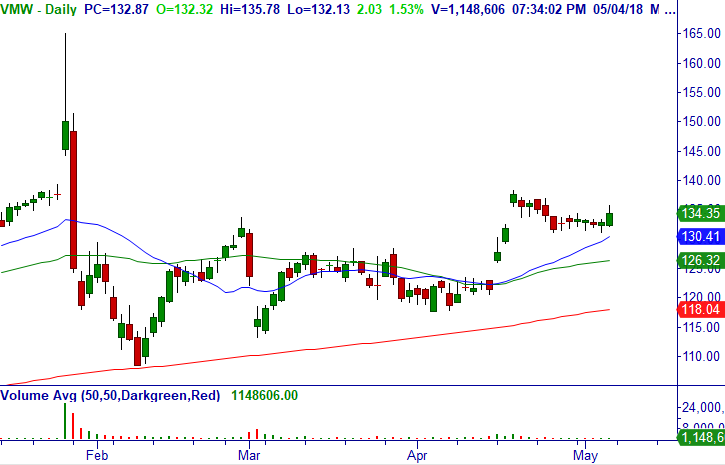
Trade: Over $134.75, consider shorting May (5/18) $130/120 bull put credit spread (12 DTE) for mid-point but a limit of $1.75/share (closed at $1.85/share). Note: higher risk since spready/illiquid.
Technical Setup: Breakout from bullish consolidation into r20-MA after Pro Gap daily.
Option Strategy: Bull Put Credit Spread (BPCS).
Stop Loss: $130.88.
Below is a daily chart of iShares Russell 2000 ETF (IWM).
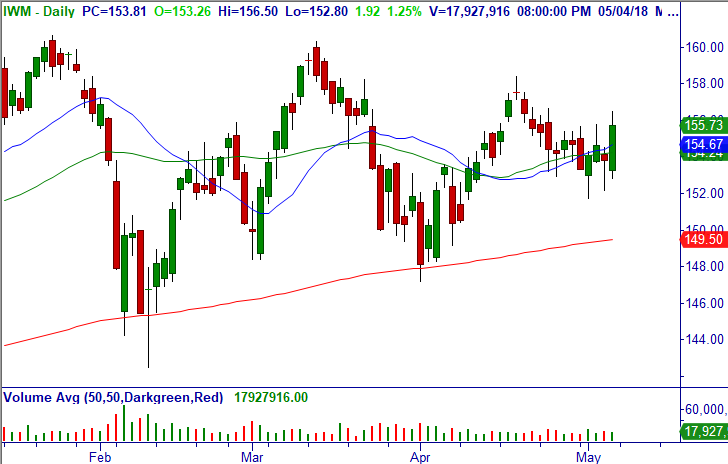
Trade: Over $156.07 or 30-Min. high, short May (5/18) $153/148 bull put credit spread (12 DTE) for a limit of $.50/share (closed at $.52/share).
Technical Setup: Bullish engulfing closing breakout from consolidation above r20/50-MA daily, weekly Bottoming Tail.
Option Strategy: Bull Put Credit Spread (BPCS).
Stop Loss: $152.79.
Below is a daily chart of D.R. Horton, Inc. (DHI).

Trade: Over $44.89, consider shorting June (6/15) $42/37 bull put credit spread (40 DTE) for around closing mid-point of $.49/share.
Technical Setup: Bullish symmetrical triangle consolidation on r200-MA daily and bullish W Formation on r50-MA weekly.
Option Strategy: Bull Put Credit Spread (BPCS).
Stop Loss: $42.44.
Master Trader Weekly Lessons for Investors and Traders will build your investing and trading knowledge and confidence to profit in all markets! Learn valuable education on stocks and options; basic to advanced chart analysis and technical strategies; the professional investor’s mindset and approach to the markets; Master Trader risk management techniques, etc. Each one can change your financial future! Sign up at www.MasterTrader.com/Lessons — only $11.97/month!
Thank you for being a loyal subscriber and feel to email us with any questions or comments on anything.
Access Trading Credit Spreads Course here, it’s the best $97 dollars spent to get up to speed fast.
Master Trader and You Building Your Financial Future Together
Happy trading! If you have any questions or comments, please e-mail Greg Capra at Greg@mastertrader.com or Dan Gibby at Dan@mastertrader.com
All the best,
Greg Capra
Managing Director of Master Trader
Trading the Pristine Method — Origin and End
Dan Gibby
Chief Options Strategist
Follow Greg on Twitter, YouTube, and StockTwits to get real-time updates and education:
Twitter: @GregCapra
Stocktwits: Greg_Capra
youtube.com/c/mastertrader (please subscribe to receive all the timely stock market updates)
NOTE: Master Trader will show opening and closing prices of all stock and option trades. We recommend that all traders and investors use proper share sizing for positions and money management. However, we cannot recommend what that is for your particular trading style, risk tolerance, or account balance.
We urge you to calculate your own share/position size based on your individualized risk parameters, Trading Plan, and familiarity with the proposed trade strategy and risk. Advanced Management Strategies (AMS) covers in detail the foundational to advanced position and money management that Master Trader uses.
NOTE: Master Trader and its representatives may have existing positions in actual or other trade recommendations before or after suggested herein. Additionally, we may manage them differently for internal purposes based on different risk parameters than noted herein.
All trade ideas and content are for informational and educational purposes only. It is not, nor is it intended to be, trading or investment advice or a recommendation that any security, option or investment strategy is suitable for any person. Trading securities can involve high risk and the loss of any funds. Investment or trading information provided may not be appropriate for all investors, and is provided without respect to individual financial sophistication, financial situation, investing time horizon or risk tolerance. Supporting documentation for any claims (including claims made on behalf of options programs), comparison, statistics, or other technical data, if applicable, will be supplied upon request. Master Trader Consulting, Inc. is not a licensed financial advisor, registered investment advisor, or a registered broker-dealer. Options, futures and futures options are not suitable for all investors. Prior to trading securities products, please read the Characteristics and Risks of Standardize Options and the Risk Disclosure for Futures and Options found here: CLICK HERE.
