
 In last Monday’s letter, I said, “Topping Tail candles tell us that sellers took control and suggests continued selling and lower prices. While that may be what happens, the fact that the recent support that has been created is not that far away.
While any day or day-to-day move may seem meaningful, the bigger picture continues to suggest that the upside or downside is limited. In other words, the expectation is for continued choppy price action.”
That is exactly what happened: more choppy action. Can the broader market get anymore indecisive than it and has been? I hope not.
As mentioned in that prior commentary, the week before last ended with a Topping Tail (TT) which suggested they would go lower.
And they did – for a day!
The broader markets fell sharply last Tuesday as they were headed for new lows on the year. But after a poke below Tuesday’s low, Mr. Schizophrenic (market participants) decided that was enough of a correction.
After some choppy back and forth, the broader markets pushed higher to close with a weekly Bottoming Tail (BT).
Now we have the unusual and odd pattern of a Topping Tail in opposition of a Bottoming Tail on the weekly chart. The closing change from the week before last week to last week was a virtual draw between sellers and buyers.
After plunging lower last Tuesday, the S&P 500 ended the week down less than one-quarter of a point. The NASDAQ 100 (cash index) ended the week down just over 11 points. It also has the opposing TT versus the BT.
What now?
The day-to-day price action is still a coin flip. However, the weekly TT and BT is now our reference point of resistance and support for any meaningful move higher or lower.
I wish that beyond those points were price “Voids” but the next reference points are not that far off. That being said, a move through them will be a move of some significance within the overall large trading range that has formed this year.
DOW JONES INDUSTRIAL AVG.
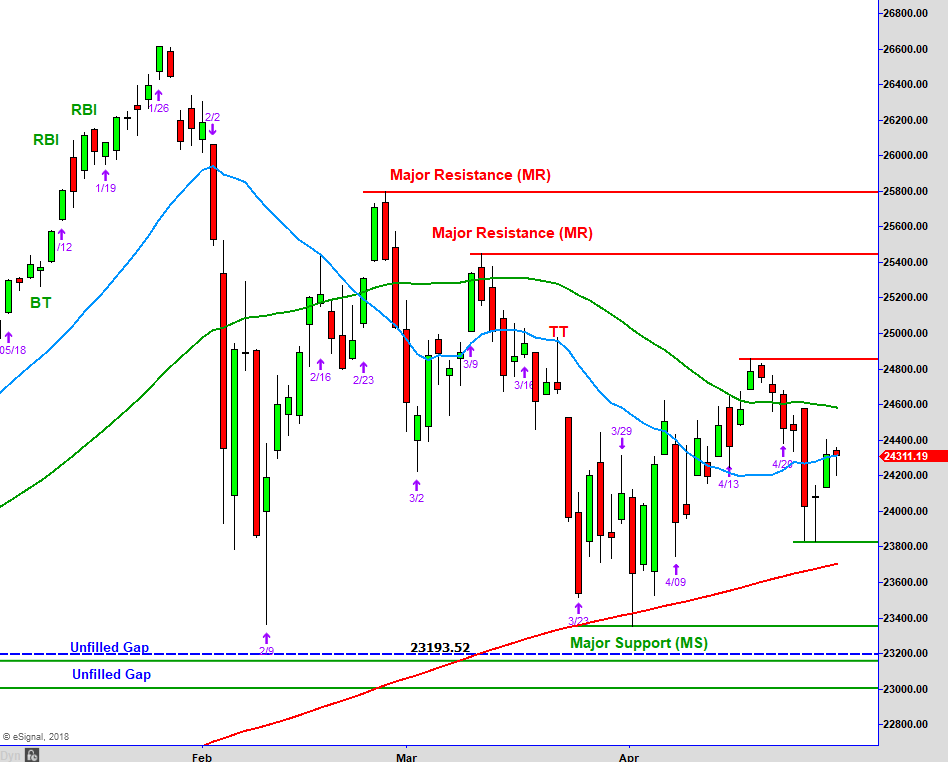
Above is the chart of the Dow Jones Industrial Average that review each week. As you can see, the green lines of support and the red lines of resistance are getting closer together with others above and below them.
What’s happening is that the forces of supply and demand are becoming tighter. Another way of viewing this is that the opposing opinions between sellers and buyers are reaching an inflection point.
This is what happens after an extended move higher or lower. Volatility increases and then dissipates over time, then prices will break either higher or lower.
The assumption is that after an extended run and whippy price action will be followed by a move to the downside. While that might be the case, it makes no sense to bet on it before it happens.
Over the years, I’ve seen many of these distribution type patterns fail and result in short moves higher. Again, it makes no sense to bet on it before it happens.
Unfortunately, our market internal gauges are not providing guidance to that direction at this time.
This choppy consolidation can go on for a while. The last run that started in 2013 to 2015 ended in almost a two year sideways chop before moving higher
There are many opinions about whether this market will go up or down and that’s all they are: opinions. I provided you with the short- and intermediate-term reference points of support and resistance.
Trade against them (fade them) or wait to move beyond and trade to the next reference point. The other choice is to stand aside as it relates to the broader markets and this type of price action in general.
We will always find short-term trading opportunities in individual sectors and/or stocks that are moving in a decisive trend or starting one — either up or down.
BROADER MARKETS
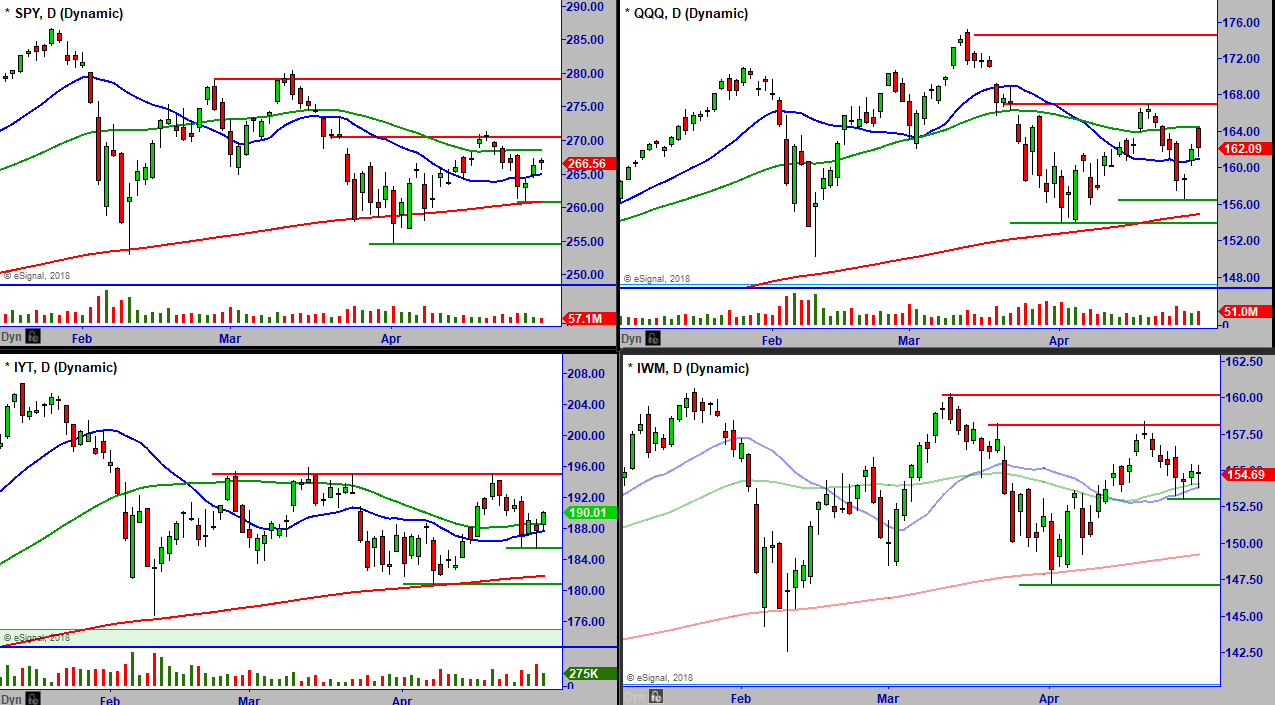
[s3mv fileName=’April+Letters/Broadermarkets_4_30_18.mp4′ fileType=’video’ source=’s3′ width=’800′ height=’450′ splashImage=” preLoad=’Y’ autoPlay=’N’ belowVideoHTML=” cuePoint=” redirectURL=” pauseAtCuePoint=’N’ isSecure=’Y’ bucketname=”]
TREND MATRIX AND INTERNALS
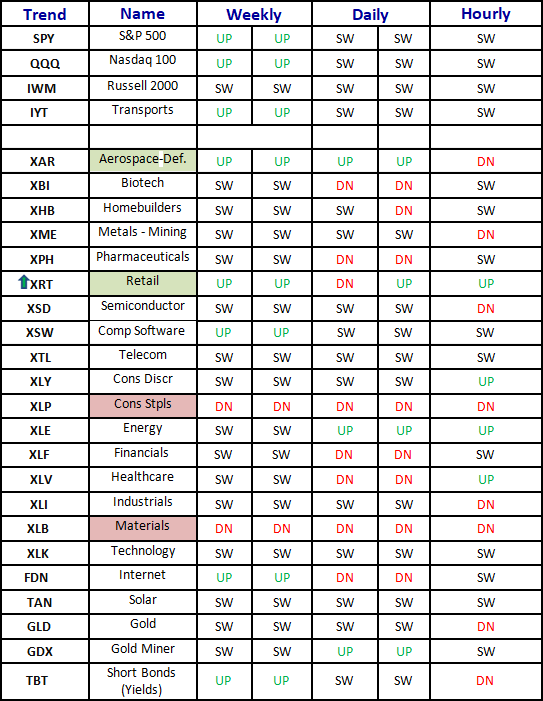
[s3mv fileName=’April+Letters/Trends_4_30_18.mp4′ fileType=’video’ source=’s3′ width=’800′ height=’450′ splashImage=” preLoad=’Y’ autoPlay=’N’ belowVideoHTML=” cuePoint=” redirectURL=” pauseAtCuePoint=’N’ isSecure=’Y’ bucketname=”]

NEW STOCK TRADES
Below is a daily chart of Green Dot Corporation (GDOT).
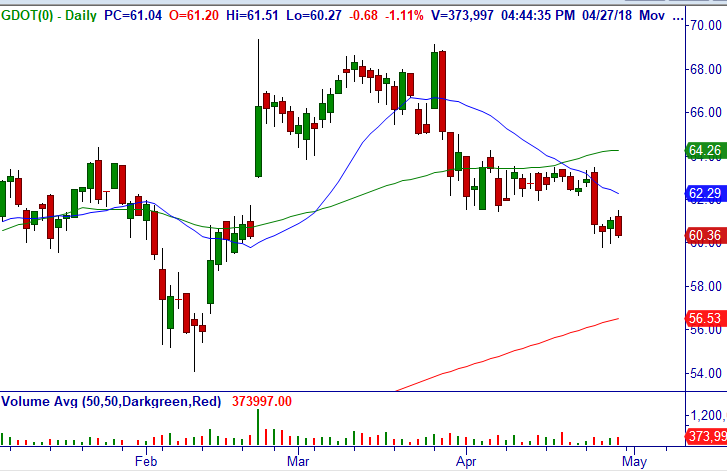
Trade: Under $60.27, consider shorting stock for a swing trade. Earnings 5/7 so close before then.
Technical Setup: Three bearish days of consolidation in bottom range of -WRB/engulfing breakdown daily, breakdown weekly.
Stop Loss: $63.61 for now.
Below is a daily chart of SPDR® S&P Retail ETF (XRT).
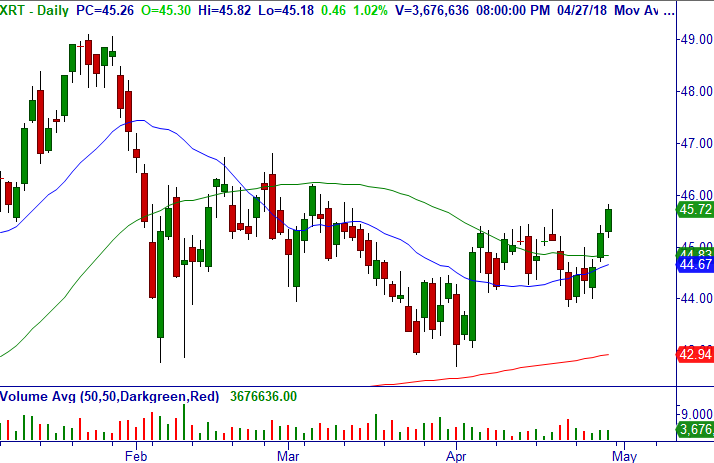
Trade: Consider buying a half-lot of stock around current levels of $45.72 and the other half-lot on any pull back to the low $45s (we will monitor).
Technical Setup: Although three days up to resistance on daily, it is a closing Breakout on the weekly, with a monthly Master Trader Buy Setup with Bottoming Tails on the 20/50-MA and Minor Support. We intend to hold for a longer-term trade because of multiple time frames.
Stop Loss: $42.99.
NEW OPTION TRADES
Below is a weekly chart of Constellation Brands, Inc. (STZ).
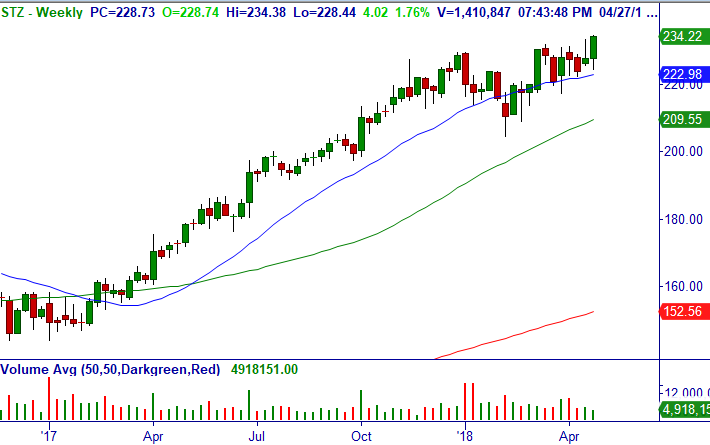
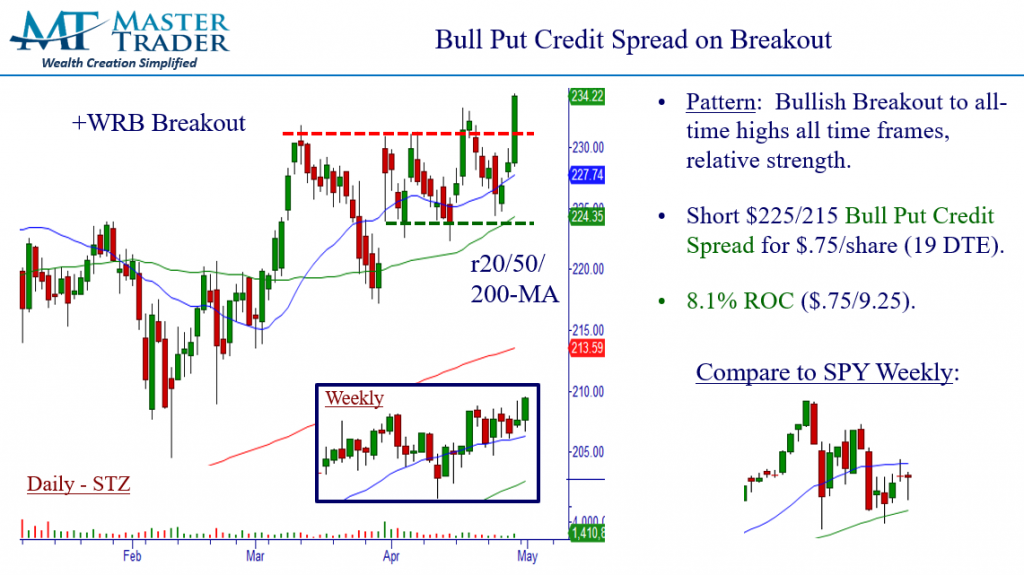
Trade: Over $234.38, consider shorting May (5/18) $225/215 bull put credit spread (19 DTE) around closing mid-point of $.75/share.
Technical Setup: Bullish Wide Range Bar (+WRB) Breakout on daily and weekly above r20/50/200-MA all time frames.
Option Strategy: Bull Put Credit Spread (BPCS).
Stop Loss: $228.43.
STZ – Trade #2 (Directional Trade): Because the hourly chart is extended, on a pull back to the $232 area, consider selling May (5/18) $240 calls (19 DTE) and buying Jun (6/15) $220 calls (47 DTE) for mid-point (don’t pay over $12/share which will be intrinsic value).
Technical Setup: See above.
Option Strategy: Bull Call Diagonal Spread (BCDS).
Stop Loss: $230.98.
Below is a daily chart of United Parcel Service, Inc. (UPS).
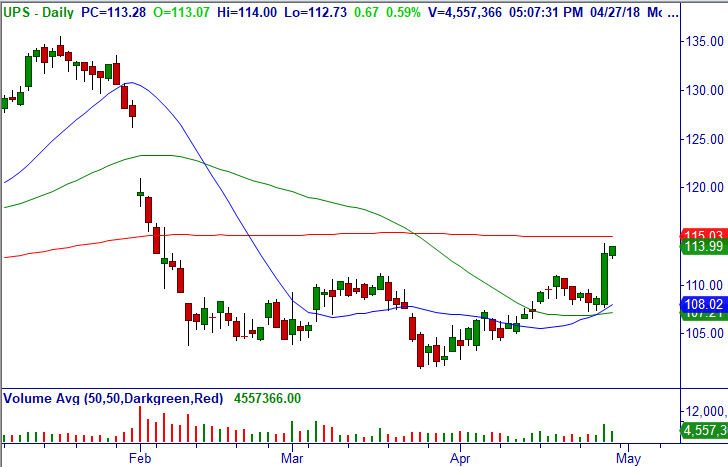
Trade: Over $114.28, consider buying May (5/4) $111/115 bull call debit spread (5 DTE) for mid-point which will have at least $.30/share positive time decay (closed at $2.73/share) for a swing trade.
Technical Setup: Bullish +123 Continuation from multi-month trading range/consolidation daily.
Option Strategy: Bull Call Debit Spread (BCDS).
Stop Loss: $111.38.
WATCH ITEMS
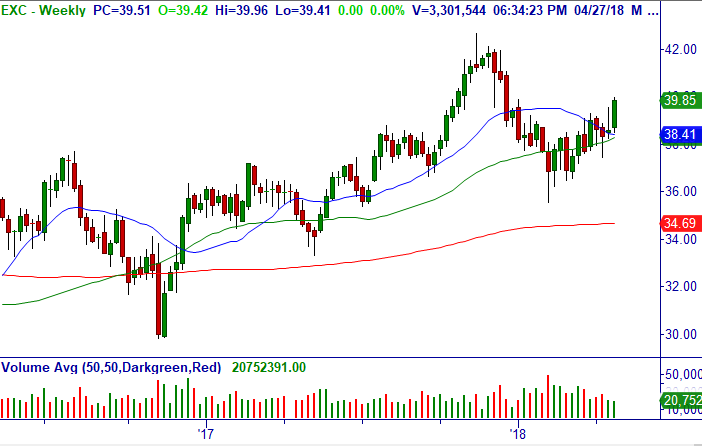
$EXC – Weekly Breakout, will watch after earnings on 5/1.
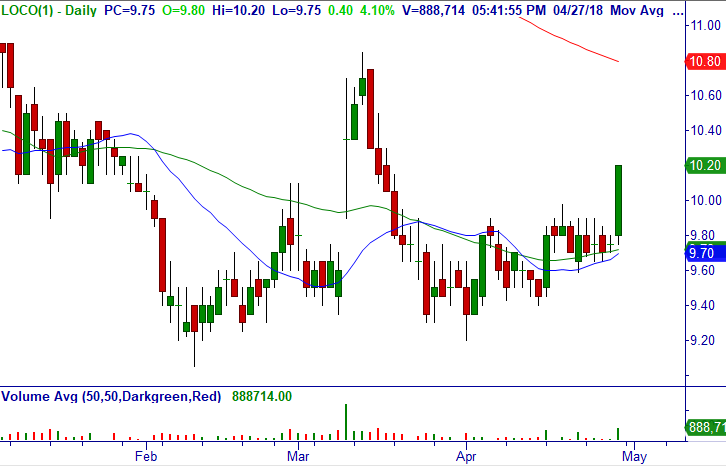
$LOCO – Daily +WRB Breakout, will watch after earnings on 5/3.
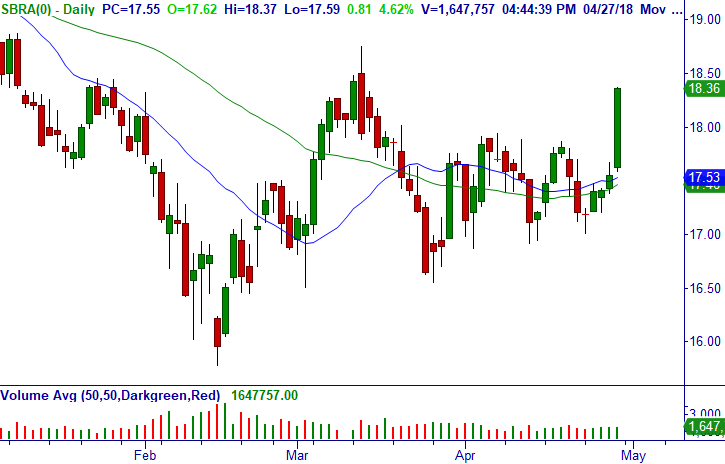
$SBRA – Daily +WRB Breakout and Bullish W Formation weekly, will watch for swing trade on pullback before earnings on 5/7.
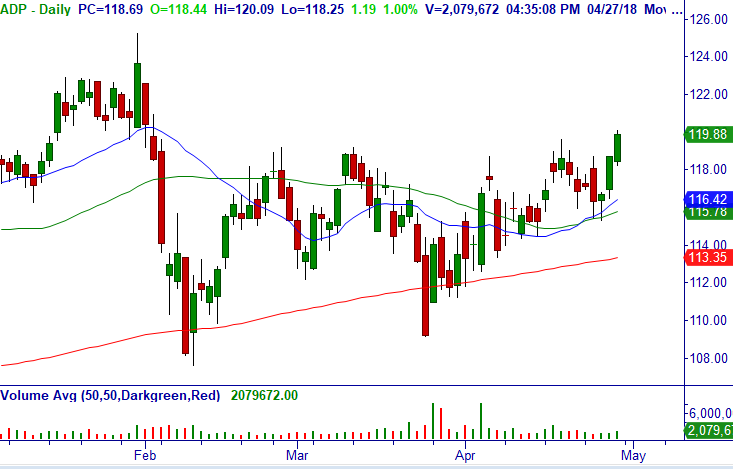
$ADP – Daily +WRB Breakout, will watch after earnings on 5/2.
Master Trader Weekly Lessons for Investors and Traders will build your investing and trading knowledge and confidence to profit in all markets! Learn valuable education on stocks and options; basic to advanced chart analysis and technical strategies; the professional investor’s mindset and approach to the markets; Master Trader risk management techniques, etc. Each one can change your financial future! Sign up at www.MasterTrader.com/Lessons — only $11.97/month!
Thank you for being a loyal subscriber and feel to email us with any questions or comments on anything.
Access Trading Credit Spreads Course here, it’s the best $97 dollars spent to get up to speed fast.
Master Trader and You Building Your Financial Future Together
Happy trading! If you have any questions or comments, please e-mail Greg Capra at Greg@mastertrader.com or Dan Gibby at Dan@mastertrader.com
All the best,
Greg Capra
Managing Director of Master Trader
Trading the Pristine Method — Origin and End
Dan Gibby
Chief Options Strategist
Follow Greg on Twitter, YouTube, and StockTwits to get real-time updates and education:
Twitter: @GregCapra
Stocktwits: Greg_Capra
youtube.com/c/mastertrader (please subscribe to receive all the timely stock market updates)
NOTE: Master Trader will show opening and closing prices of all stock and option trades. We recommend that all traders and investors use proper share sizing for positions and money management. However, we cannot recommend what that is for your particular trading style, risk tolerance, or account balance.
We urge you to calculate your own share/position size based on your individualized risk parameters, Trading Plan, and familiarity with the proposed trade strategy and risk. Advanced Management Strategies (AMS) covers in detail the foundational to advanced position and money management that Master Trader uses.
NOTE: Master Trader and its representatives may have existing positions in actual or other trade recommendations before or after suggested herein. Additionally, we may manage them differently for internal purposes based on different risk parameters than noted herein.
All trade ideas and content are for informational and educational purposes only. It is not, nor is it intended to be, trading or investment advice or a recommendation that any security, option or investment strategy is suitable for any person. Trading securities can involve high risk and the loss of any funds. Investment or trading information provided may not be appropriate for all investors, and is provided without respect to individual financial sophistication, financial situation, investing time horizon or risk tolerance. Supporting documentation for any claims (including claims made on behalf of options programs), comparison, statistics, or other technical data, if applicable, will be supplied upon request. Master Trader Consulting, Inc. is not a licensed financial advisor, registered investment advisor, or a registered broker-dealer. Options, futures and futures options are not suitable for all investors. Prior to trading securities products, please read the Characteristics and Risks of Standardize Options and the Risk Disclosure for Futures and Options found here: CLICK HERE.
