
 Over the years, I have seen quite a few conflicted markets. What they all have in common is time frames whose trends are “out of sync” with each other. Meaning, for example, long-term is up, intermediate-term is down, and short-term could be sideways or up. The day-to-day price action is also often erratic.
In this type of market environment, moves that begin look quite convincing — and then often reverse in the other direction. Then that direction looks convincing only to see prices reverse back again!
When you’re in “the thick of it,” it certainly seems crazy that the market, which is actually the market participants, can act in such a way. Those market participants range from money managers with hundreds of millions of dollars at their disposal for research (money cannot buy clarity when there is none) to the individual investor or trader.
In the March 12 letter I wrote, “there’s been an improvement but you can trust schizophrenic.” I was referring to the price action of the broader markets and that schizophrenic behavior continues.
Of course, this price action makes for a difficult trading environment. And while we have the choice to stand aside, as active investors and traders we are always focused on making the most out of any market environment.
During these times, it’s better to trade smaller positions and adding when possible — or taking a profit at the first sign of trouble.
Master Trader Tip: We have to stay involved in the markets if we are going to take advantage of “the easy money” when certainty and trend alignment returns.
DOW JONES INDUSTRIAL AVG.
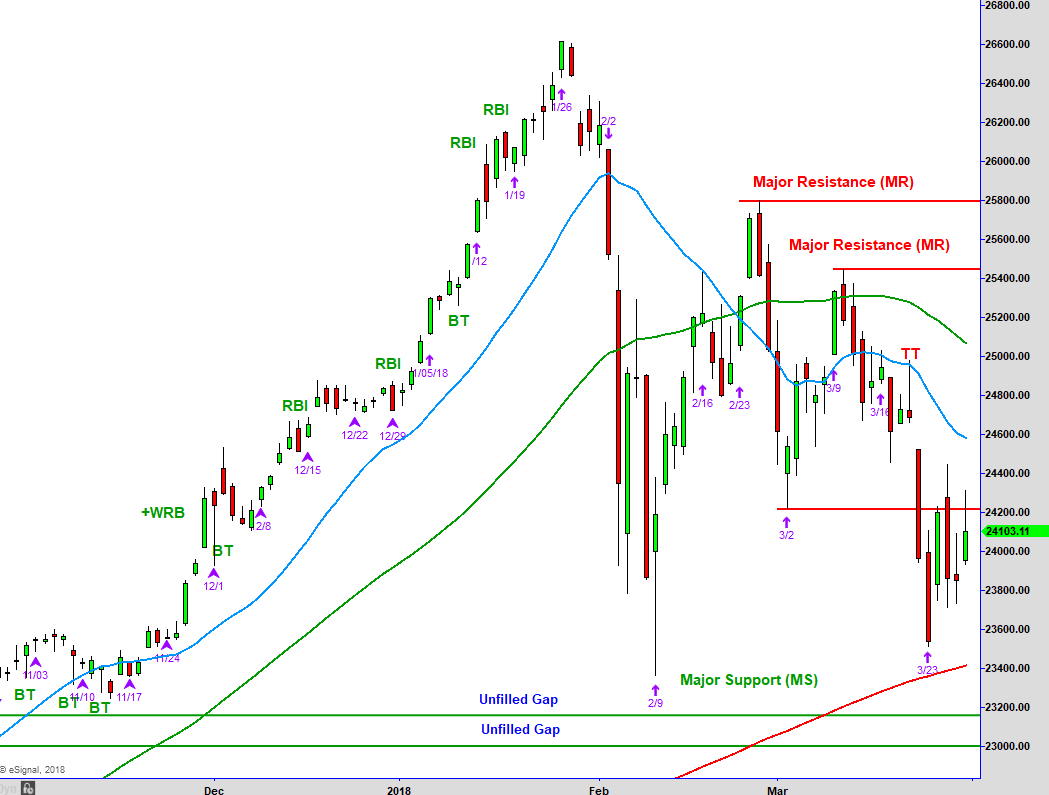
Above is the chart of the Dow Jones Industrial Average that we review each week. Last Monday started off with a sizable gap to the upside that followed through into the minor resistance from 3/2 (red line) and stopped right there.
Initially, Tuesday continued higher as the expectation was that prices would continue to the upside (it was ours also) to at least the 20-period moving average (blue line). Mr. Schizophrenia had other plans. Monday’s trading range was completely overlapped and prices traded under Monday’s low.
It then definitely looked like prices were going down below the prior week’s low and the 200-period moving average. Wrong again!
The Dow held Wednesday’s low and traded inside of its range on Thursday. Those types of “stall days” in the lower portion of a large bearish bar historically result in a continuation lower. Wrong again! Friday, prices moved higher, inching close to Wednesday’s ugly red reversal day’s high before backing off.
Mr. Schizophrenia did a marvelous job of keeping everyone second guessing the direction of the next day all of last week.
Moving out to the weekly time frame, which we will look at in the market update video, last week ended as a consolidation week at the bottom of the prior week’s bearish range.
I’m not looking forward to getting back in the ring with Mr. Schizophrenia this week. However, a move above last week’s high will be viewed as bullish, and a move below the week before last’s low will be viewed as bearish.
Below that low opens up the door to significantly lower prices; however, the market internals don’t support that bias which provides another layer of confusion.
Above last week’s high, potentially will create a W bottom on the weekly time frame that would suggest higher prices, which the internals do support.
The two areas of Major Resistance (MR) above on the daily shown will make for choppy price action on any move higher until getting through it, if prices can.
My level of confidence on the direction of prices in the short-term is about the same as a blindfolded man getting across a busy intersection unharmed.
If you have a Trading Plan and a Money Management Plan, even the worst market conditions will only cause a “flesh wound.” In the best market conditions, you will be able to maximize your gains beyond any simple “buy and hold” strategy.
If you are interested in learning simple and Advanced Money Management, consider taking my class on that. After taking it, you will be amazed at what is possible by just changing your money management approach.
As a subscriber to this service, enter coupon code MTSMONEY at checkout and the price will be discounted $400 dollars from $795 to $395.
BROADER MARKETS
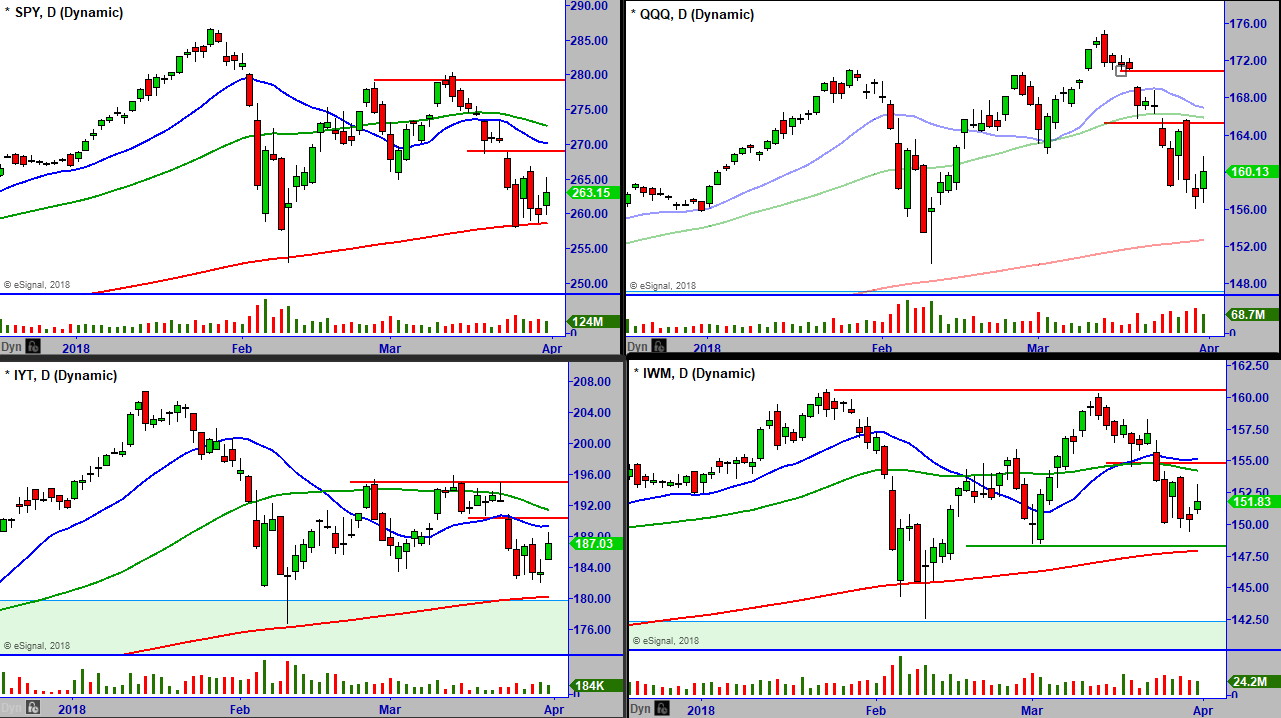
[s3mv fileName=’April+Letters/BroaderMarkets_4_2_18.mp4′ fileType=’video’ source=’s3′ width=’800′ height=’450′ splashImage=” preLoad=’Y’ autoPlay=’N’ belowVideoHTML=” cuePoint=” redirectURL=” pauseAtCuePoint=’N’ isSecure=’Y’ bucketname=”]
TREND MATRIX AND INTERNALS
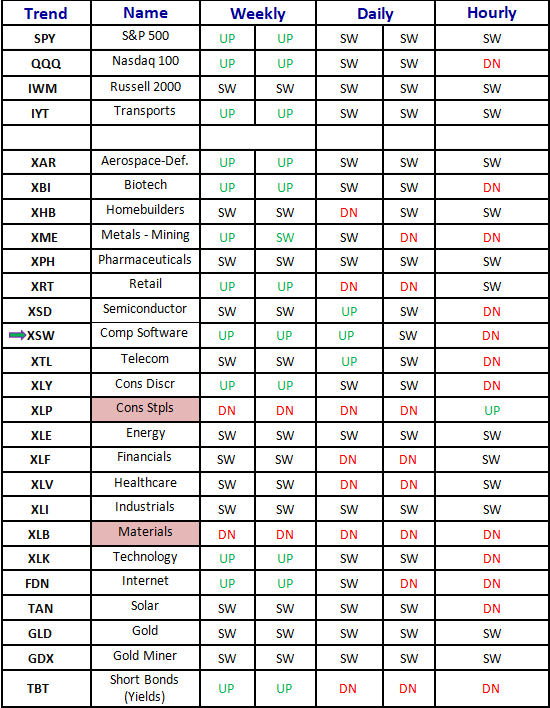
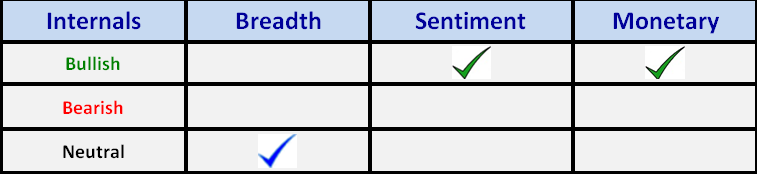
[s3mv fileName=’April+Letters/Trends_4_2_18.mp4′ fileType=’video’ source=’s3′ width=’800′ height=’450′ splashImage=” preLoad=’Y’ autoPlay=’N’ belowVideoHTML=” cuePoint=” redirectURL=” pauseAtCuePoint=’N’ isSecure=’Y’ bucketname=”]
NEW STOCK TRADING IDEAS
Below is a weekly chart of QEP Resources, Inc. (QEP).
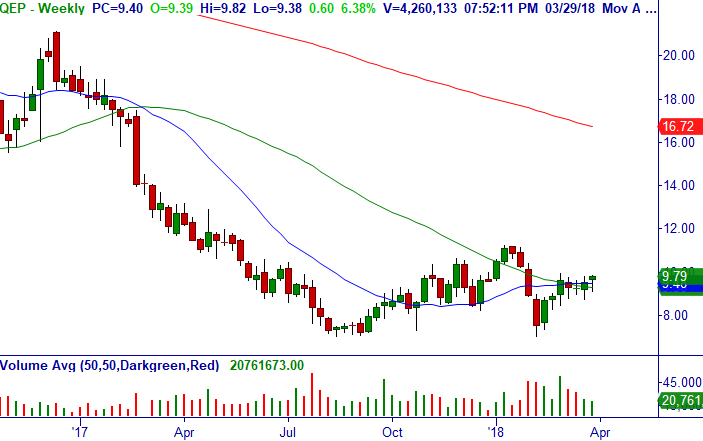
Trade: Over $9.82, consider buying stock.
Technical Setup: Breakout daily/weekly after bullish retest of Major Support.
Stop Loss: $9.10.
Below is a monthly chart of Rayonier Advanced Materials Inc. (RYAM).
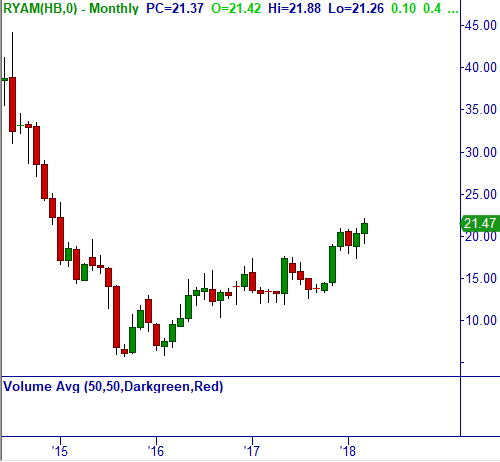
Technical Setup: Breakout from multi-year trading range after bullish W Formation in 2016 monthly. We will be watching on a daily setup with the broader markets.
NEW OPTION TRADING IDEAS
Below is a daily chart of Walmart Inc. (WMT).
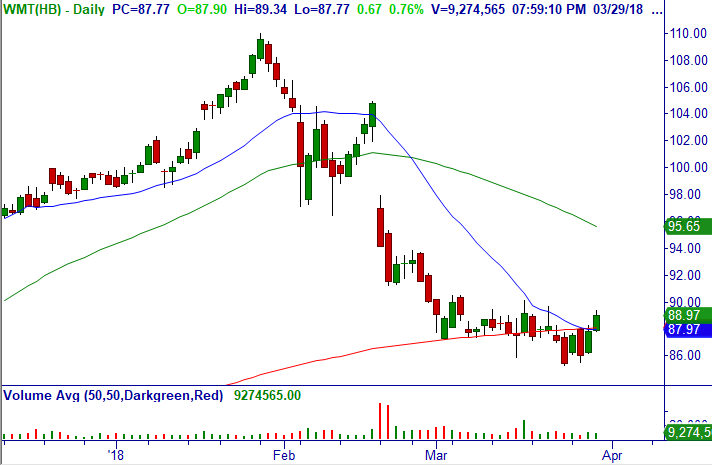
Trade: Over $89.34, consider buying Apr (4/13) $81/90.5 bull call debit spread (12 DTE) for a limit of $7.69/share, which gives $.65/share of time value/cushion (closed at $7.41/share).
Technical Setup: Bullish consolidation following failed breakdown and extended daily/weekly.
Option Strategy: Bull Call Debit Spread (BCDS).
Stop: $85.47.
Below is a daily chart of McDonald’s Corporation (MCD).
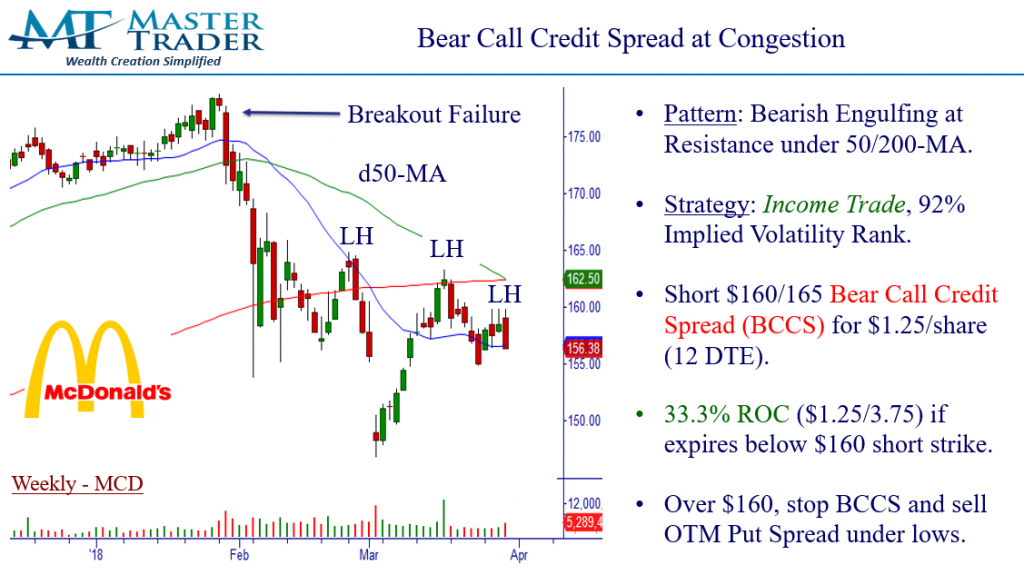
Trade: Under $156.38, consider shorting Apr (4/13) $160/165 bear call credit spread (12 DTE) for a limit of $1.25/share (closed at $1.32/share).
Technical Setup: Above.
Option Strategy: Bear Call Credit Spread (BCCS).
Stop Loss: Over $160, stop BCCS and sell 4/13 OTM Bull Put Credit Spread under week’s low.
Below is a daily chart of Monster Beverage Corporation (MNST).
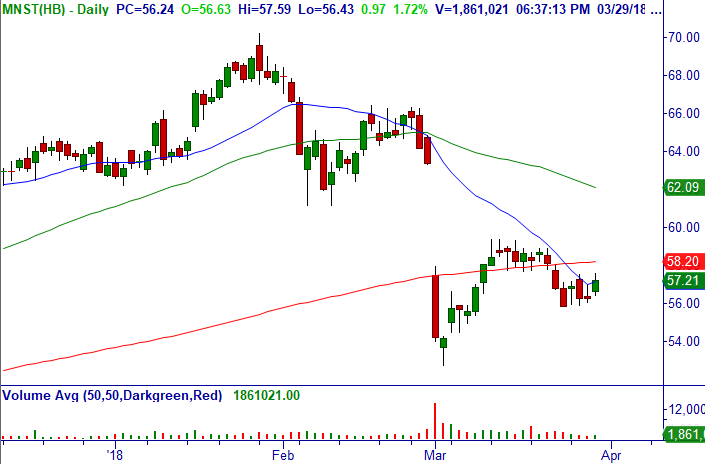
Trade: Under $56.43, consider shorting Apr (4/20) $59/62 bear call credit spread (19 DTE) for a limit of $.45/share (closed at $.52/share).
Technical Setup: Consolidation in downtrend and d20-MA daily after Pro Gap down and retracement.
Option Strategy: Bear Call Credit Spread (BCCS).
Stop Loss: $59.02 for now.
Below is a daily chart of Apache Corporation (APA).
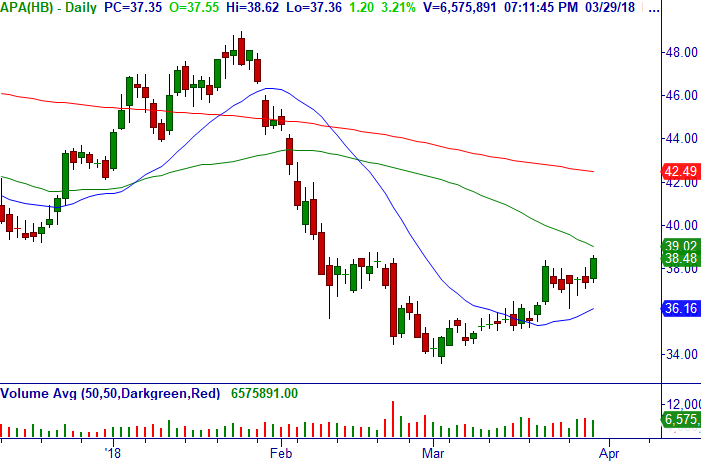
Trade: Over $38.62, consider shorting Apr (4/20) $36/32 bull put credit spread (19 DTE) for mid-point but limit of $.40/share (closed at $.43/share).
Technical Setup: Bullish Major Support trade daily/weekly.
Option Strategy: Bull Put Credit Spread (BPCS).
Stop Loss: None for now.
Below is a daily chart of SPDR S&P Oil & Gas Explor & Prodtn ETF (XOP).
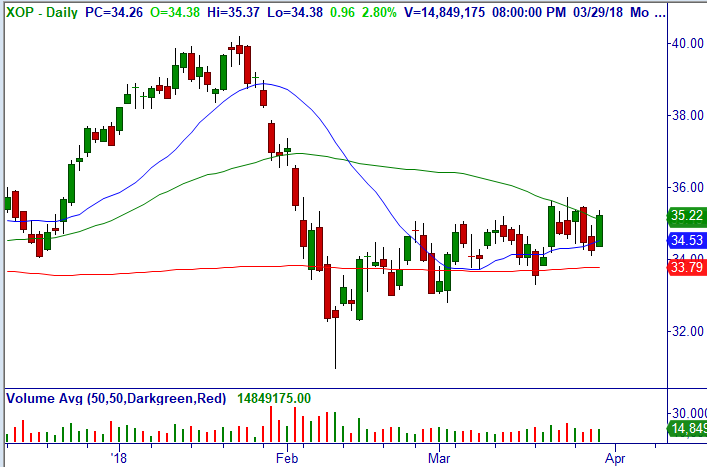
Trade: Over $35.37, consider shorting Apr (4/20) $33.5/29.5 bull put credit spread (19 DTE) for mid-point but limit of $.32/share (closed at $.34/share).
Technical Setup: Bullish Major Support trade daily/weekly.
Option Strategy: Bull Put Credit Spread (BPCS).
Stop Loss: None for now.
Below is a weekly chart of Marathon Oil Corporation (MRO).
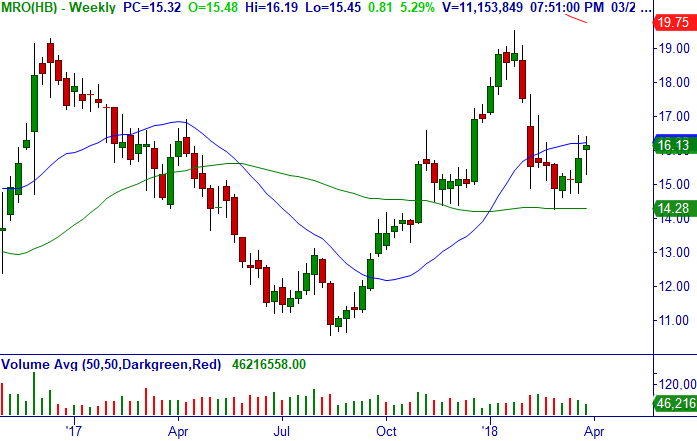
Trade: Over $16.20, consider shorting Apr (4/20) $15.5/13.5 bull put credit spread (19 DTE) for mid-point but limit of $.26/share (closed at $.29/share).
Technical Setup: Bullish Double Bottom and Bottoming Tails on Major Support and 50-MA weekly.
Option Strategy: Bull Put Credit Spread (BPCS).
Stop Loss: None for now.
Thank you for being a loyal subscriber and feel to email us with any questions or comments on anything.
Access Trading Credit Spreads Course here, it’s the best $97 dollars spent to get up to speed fast.
MasterTrader and You Building Your Financial Future Together
Happy trading! If you have any questions or comments, please e-mail Greg Capra at Greg@mastertrader.com or Dan Gibby at Dan@mastertrader.com
All the best,
Greg Capra
Managing Director of Master Trader
Trading the Pristine Method — Origin and End
Dan Gibby
Chief Options Strategist
Follow Greg on Twitter, YouTube, and StockTwits to get real-time updates and education:
Twitter: @GregCapra
Stocktwits: Greg_Capra
youtube.com/c/mastertrader (please subscribe to receive all the timely stock market updates)
