
 As we all know, volatility has come back in a big way this year. As discussed in a previous letter, the accelerated move at the start of the year into the end of January historically precedes a pullback. However, that did not suggest the extent of the pullback that occurred in such a short period of time.
The downward angle that prices fell at — and the depth of that drop — historically would mean that prices would not be near the old highs anytime soon. But the NASDAQ 100 is almost there and the software and services ETF has already exceeded it.
Times have changed is an understatement.
The NASDAQ 100 that was up just over 8% at its high in January was down just over 8.5% in February. However, year to date it’s up just over 7.9%. There are other examples of that type of crazy volatility in other indices or ETFs.
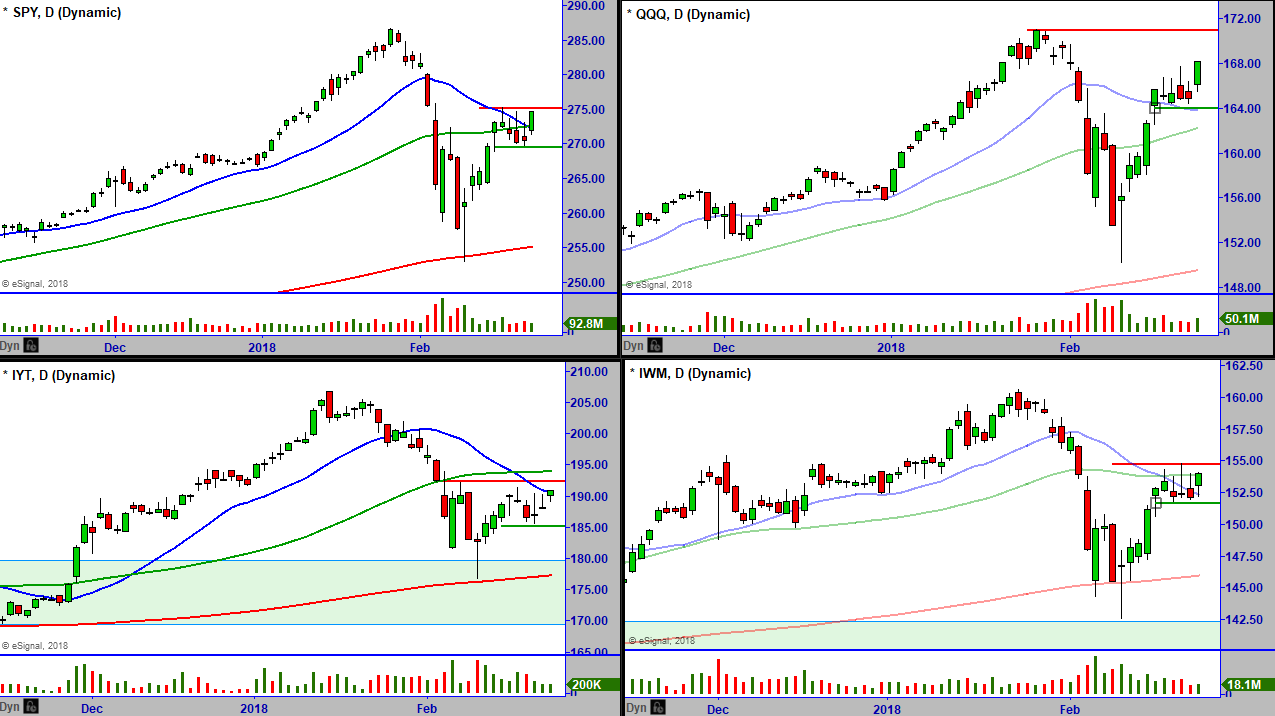
Not all markets or ETFs are near their old highs, but Friday’s bullish price action and close suggests that it’s a possibility. If it’s going to happen, we should see the start of that early in the week.
The current price patterns that we will review in the video of the broader markets suggest that prices will go higher. That being said, this type of volatility can turn on a dime back in the other direction.
If prices clear the areas of resistance that we will review, and you want to trade them long, they will require larger stops. For example, just using a prior day low could be a large stop. Stop below the next reference point of support, of course, is going to be even bigger.
Money Management is Key
When there are periods of high volatility, this is the norm. The answer to participating in volatile markets is proper money management. The simple answer to that is deciding where your stop loss point is, decide the amount of money you’re willing to risk, and then share size accordingly.
Many that are new to the markets make the mistake of share sizing equally across all trades. This often leads to oversize losses when ta stop-loss hits. By share-sizing as explained your losses — when they happen — become relatively equal.
Of course, unexpected gaps that are often created by the news are going to be a variable that cannot be accurately accounted for.
The positive side of extreme volatility can be the larger moves that are possible in the direction suggested by the price pattern. So the smaller position size required by the larger stop loss can still result in a sizable gain. The main point being, don’t lose big, and that is done by using proper money management.
DOW JONES INDUSTRIAL AVG.
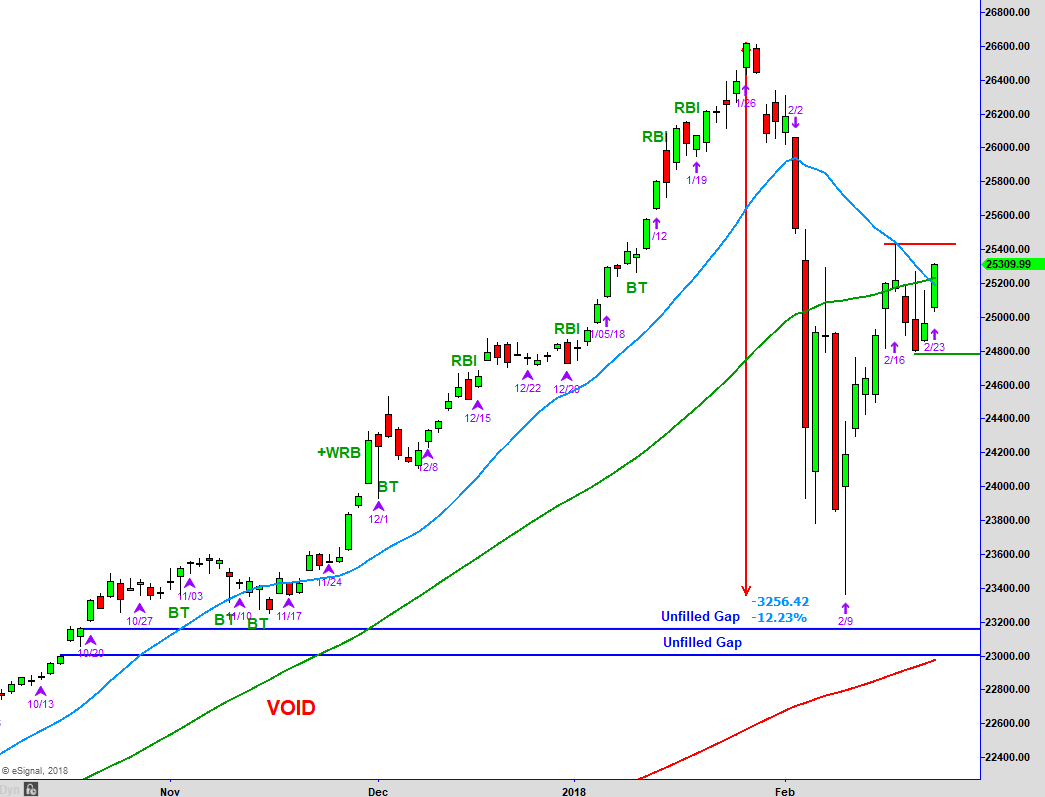
Above is the chart of the Dow Jones Industrial Average that we review each week. As you can see, there was almost a downward vertical movement of 12% in a very short period of time. Prices stopped and reversed in the area of the prior Bottoming Tail (BT) candles marked to the left.
The move from the February 9th low to the February 16th high is almost 9%. It certainly looked like prices were going to move lower to test somewhere in the open area below, but buyers stepped up in force on Friday.
Many broader market indices and ETFs did not clear the February 16 high, but the NASDAQ 100 did and as mentioned is relatively close to the old highs.
Ideally, if prices are going to clear the prior high from the 16th they will move sideways for a day or two first for an entry, rather than shooting through that high and continuing higher.
Moving sideways for a day or two would build an intra-day consolidation, which is a higher probability point to enter from as prices take out a prior resistance point.
With money managers falling over themselves to get out of the market and then get back in — in the blink of an eye — the ideal seems less likely. We shall see.
The Dow is forming a small trading range between the red and green lines after the move off of the low, which is bullish — as long as it stays above the 24,800 area (green line).
If there is a change from Friday’s bullish sentiment — and by chance, prices move lower breaking down through the 24,800 area, think short.
BROADER MARKETS
[s3mv fileName=’FEB+Letter+2018/BoarderMarkets_2_26_18.mp4′ fileType=’video’ source=’s3′ width=’800′ height=’450′ splashImage=” preLoad=’Y’ autoPlay=’N’ belowVideoHTML=” cuePoint=” redirectURL=” pauseAtCuePoint=’N’ isSecure=’Y’ bucketname=”]
TREND MATRIX AND INTERNALS
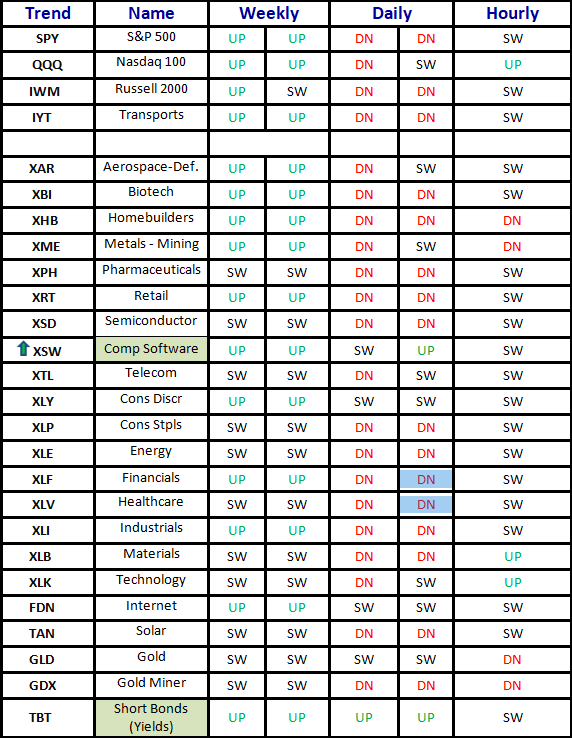
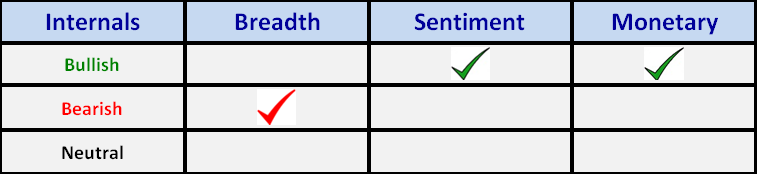
[s3mv fileName=’FEB+Letter+2018/Trends_2_26_18.mp4′ fileType=’video’ source=’s3′ width=’800′ height=’450′ splashImage=” preLoad=’Y’ autoPlay=’N’ belowVideoHTML=” cuePoint=” redirectURL=” pauseAtCuePoint=’N’ isSecure=’Y’ bucketname=”]
NEW STOCK IDEAS
Below is a daily chart of Anadarko Petroleum Corporation (APC).
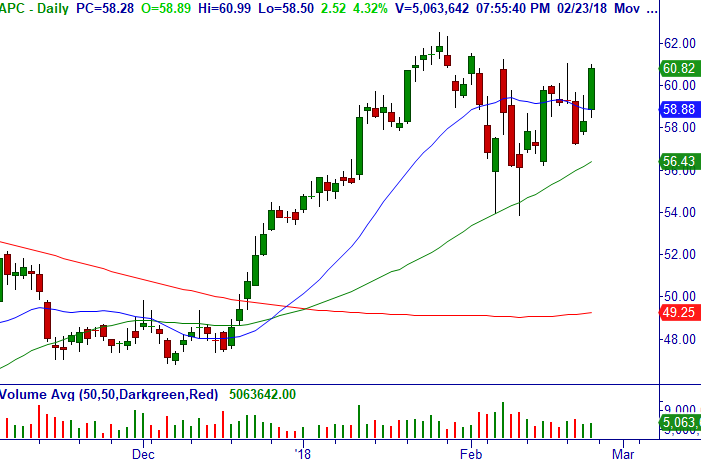
Trade: Over $61.00, consider buying stock.
Technical Setup: Bullish Wide Range Bar from symmetrical triangle consolidation above r50-MA daily, bullish weekly and monthly.
Stop Loss: $57.98. Earnings 5/1.
Below is a daily chart of Maxim Integrated Products, Inc. (MXIM).
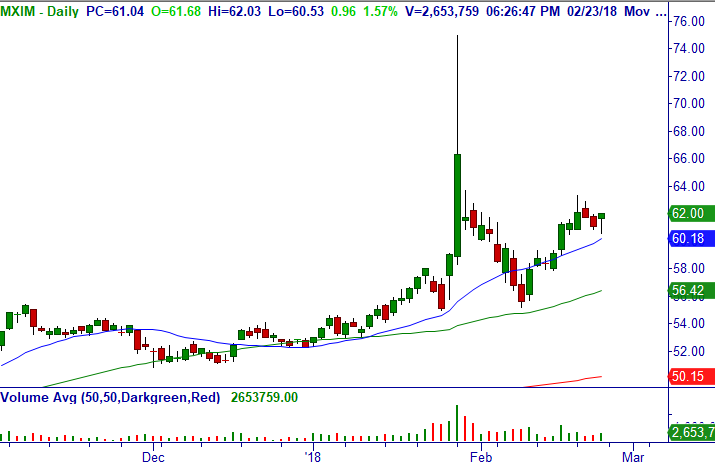
Trade: Over $62.03, consider buying stock.
Technical Setup: Bullish consolidation and Bottoming Tail above r20-MA daily, bullish weekly and monthly.
Stop Loss: $59.98. Earnings 4/19.
Below is a daily chart of Lululemon Athletica Inc. (LULU).
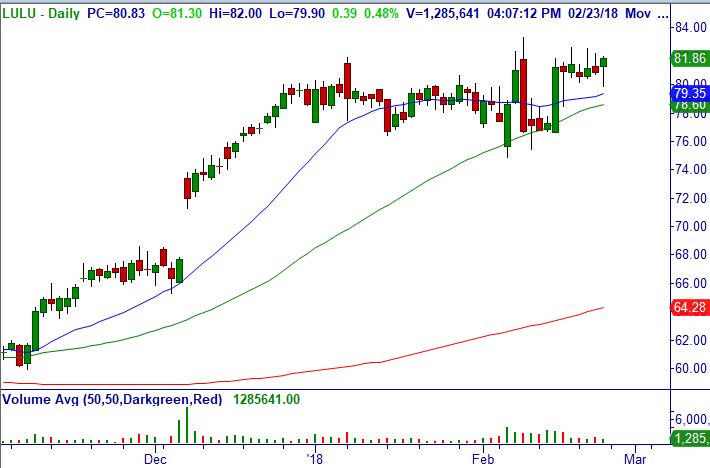
Trade: Over $82.70, consider buying stock.
Technical Setup: Bullish consolidation in top range of Bullish Wide Range Bar and Bottoming Tail above r20/50-MA after failed breakdowns daily, bullish weekly and monthly.
Stop Loss: $79.49. Earnings 4/4.
NEW OPTION IDEAS
Below is a daily chart of UnitedHealth Group Incorporated (UNH).
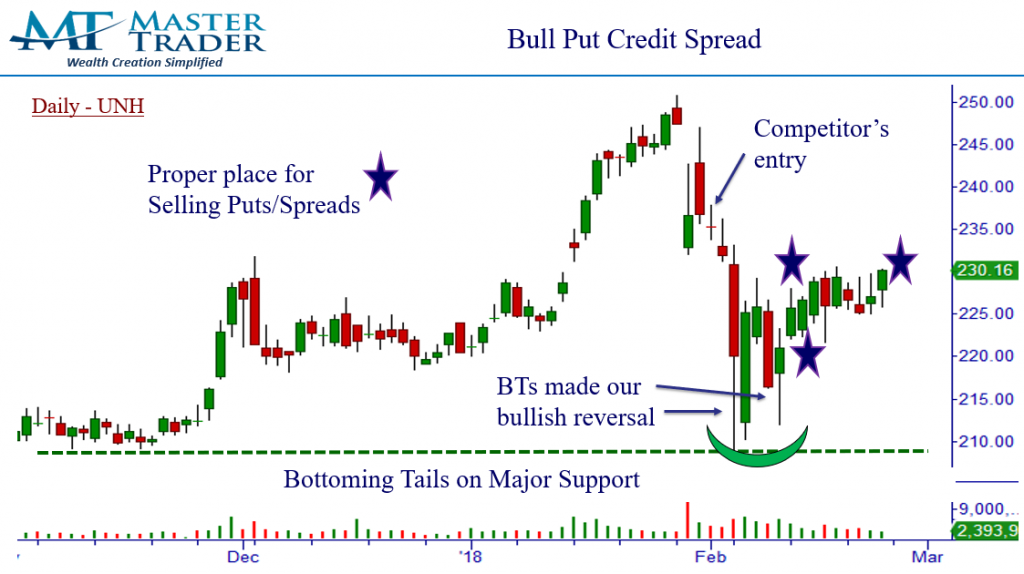
Trade: Over $230.32, consider shorting Mar (3/16) $220/210 bull put credit spread (19 DTE) around closing mid-point of $.81/share.
Technical Setup: Breakout after retracement/consolidation from bottoming pattern daily, bullish weekly on r20-MA.
Option Strategy: Bull Put Credit Spread (BPS).
Stop Loss: $221.48.
Below is a daily chart of Bristol-Myers Squibb Company (BMY).
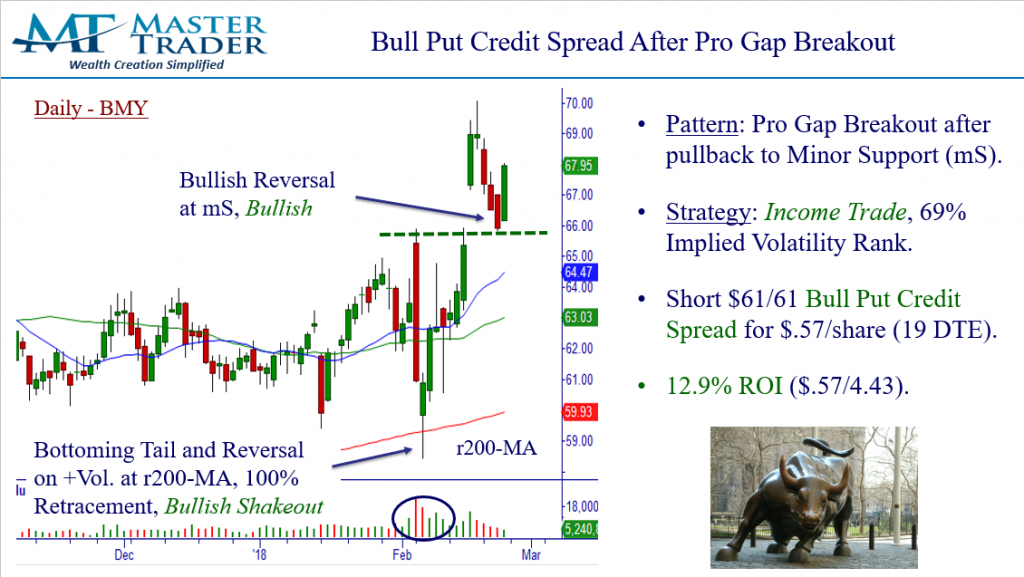
Trade: Provided it opens over $67.60, consider shorting Mar (3/16) $66/61 bull put credit spread (19 DTE) at mid-point but limit of $.57/share (closed at $.61/share).
Technical Setup: +WRB after pullback to Minor Support from Pro Gap Breakout daily, weekly and monthly.
Option Strategy: Bull Put Credit Spread (BPS).
Stop Loss: $66.16.
Below is a daily chart of Energy Select Sector SPDR ETF (XLE).
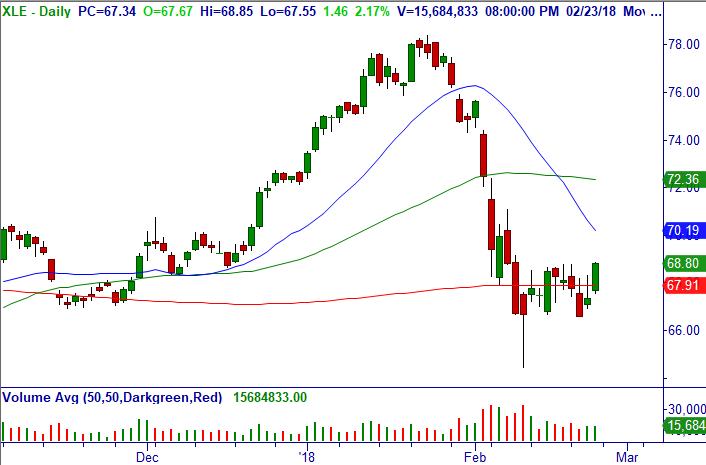
Trade: Above $68.85, consider shorting Mar (3/16) $66.5/61.5 bull put credit spread (19 DTE) at mid-point but limit of $.47/share (closed at $.50/share).
Technical Setup: Breakout of consolidation after Climactic Buy Setup and Bottoming Tail on 200-MA daily.
Option Strategy: Bull Put Credit Spread (BPS), 94% Implied Volatility Rank.
Stop Loss: $66.58.
Below is a daily chart of Anadarko Petroleum Corporation (APC).
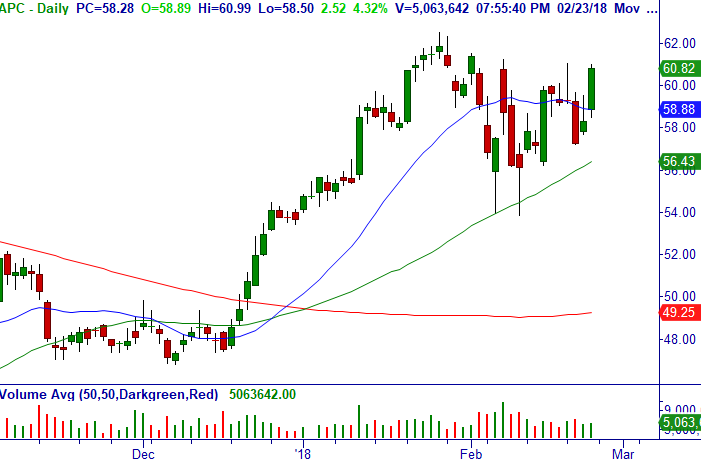
Trade: Above $61.00, consider shorting Mar (3/16) $58/53 bull put credit spread (19 DTE) at mid-point but limit of $.60/share (closed at $.62/share).
Technical Setup: Breakout of consolidation after Climactic Buy Setup and Bottoming Tail on 200-MA daily.
Option Strategy: Bull Put Credit Spread (BPS).
Stop Loss: $57.98.
Below is a daily chart of Maxim Integrated Products, Inc. (MXIM).
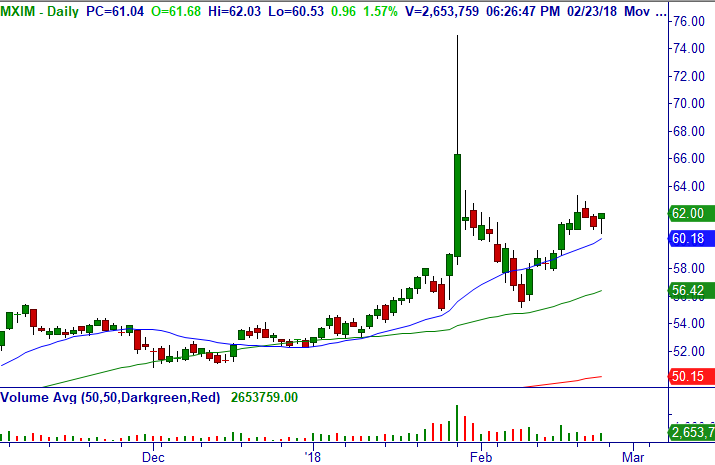
Trade: Over $62.03, consider shorting Mar (3/16) $60/55 bull put credit spread (19 DTE) at mid-point but limit of $.66/share (closed at $.70/share).
Technical Setup: +WRB after pullback to Minor Support from Pro Gap Breakout daily, weekly and monthly.
Option Strategy: Bull Put Credit Spread (BPS).
Stop Loss: $59.98.
Below is a daily chart of Lululemon Athletica Inc. (LULU).
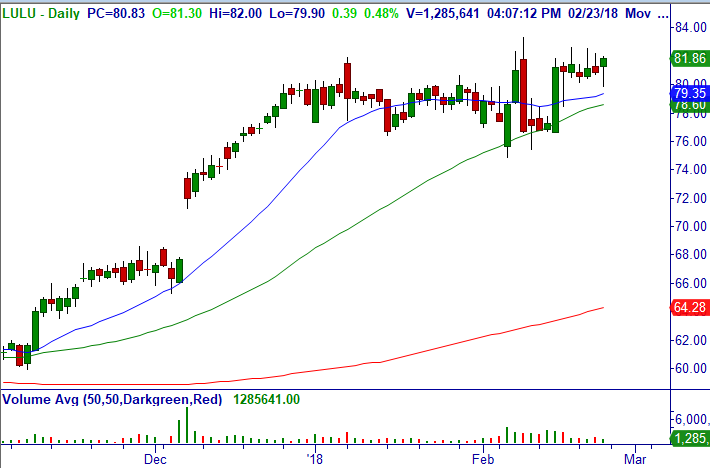
Trade: Over $82.70, consider shorting Mar (3/16) $79/73 bull put credit spread (19 DTE) at mid-point but limit of $.88/share (closed at $.97/share).
Technical Setup: Bullish consolidation in top range of Bullish Wide Range Bar and Bottoming Tail above r20/50-MA after failed breakdowns daily, bullish weekly and monthly.
Option Strategy: Bull Put Credit Spread (BPS).
Stop Loss: $79.49.
Below is a daily chart of The Boeing Company (BA).
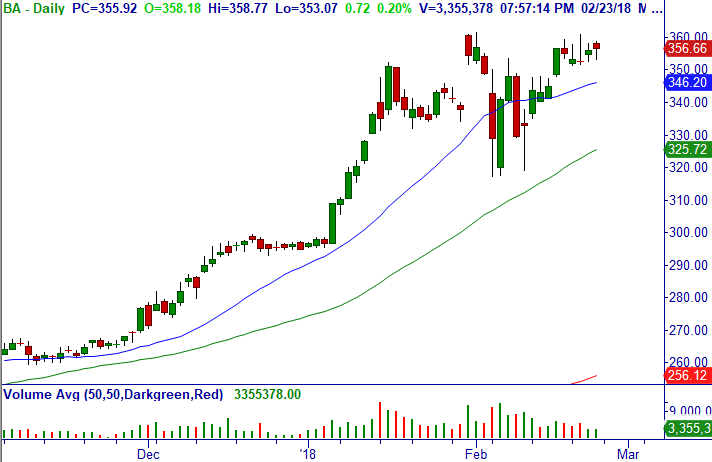
Trade #1: Over $360.81, consider buying Mar (3/16) $335 calls (19 DTE) and selling Mar (3/2) $370 calls (5 DTE) at mid-point (closed at $23.73/share). This is a directional trade like a covered call, but using the ITM long call as a stock replacement. Option Strategy: Bull Call Diagonal (BCD).
Trade #2: Over $360.81, consider shorting Mar (3/9) $345/325 bull put credit spread (12 DTE) at mid-point but limit of $2.00/share (closed at $2.17/share). Option Strategy: Bull Put Credit Spread (BPS).
Technical Setup: Breakout to all-time highs from bullish consolidation at prior high after bullish 100% retracement from prior lows daily, bullish weekly.
Stop Loss: $351.28.
Below is a daily chart of iPath S&P 500 VIX ST Futures ETN (VXX).

Trade: When SPY trades OVER $245, consider shorting Mar (3/19) $48/54 bear call credit spread (12 DTE) at mid-point but limit of $.50/share (closed at $.47/share, but spready).
Technical Setup: Breakdown daily (with SPY strength) with price void below, plus “Contango” head winds with Volatility ETFs.
Option Strategy: Bear Call Credit Spread (BCS).
Stop Loss: None now.
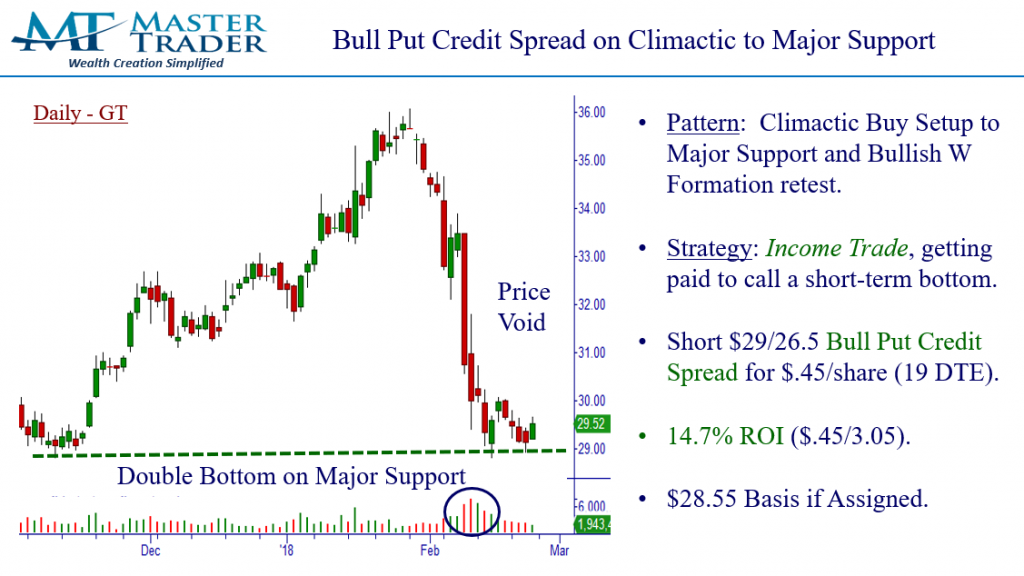
2/26: GT – Over $29.66, consider shorting $29/26.5 Bull Put Credit Spread for $.45/share (19 DTE). Stop: None now.
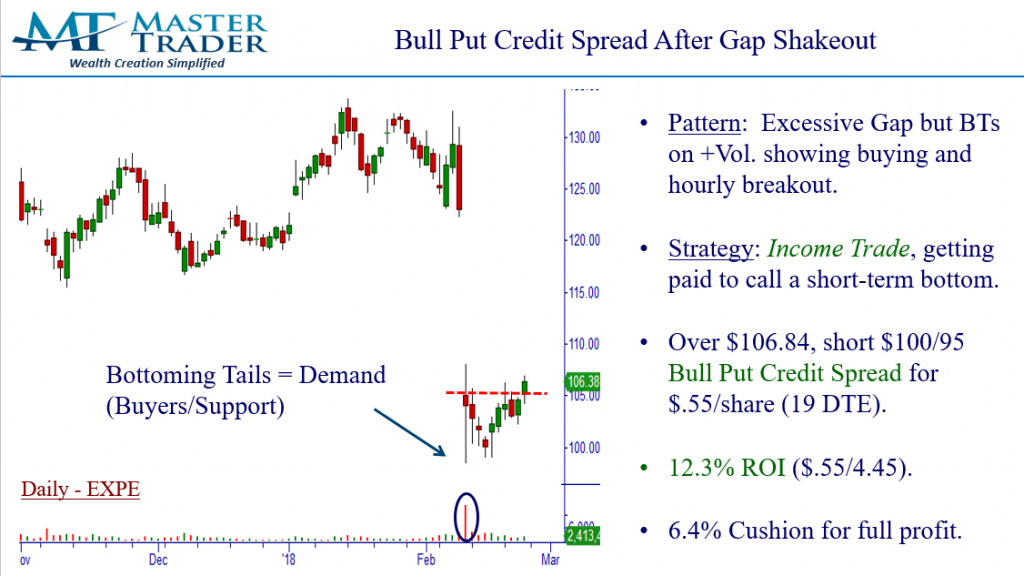
2/26: EXPE – Over $106.84, short $100/95 Bull Put Credit Spread for around $.55/share (19 DTE). Stop: None now.
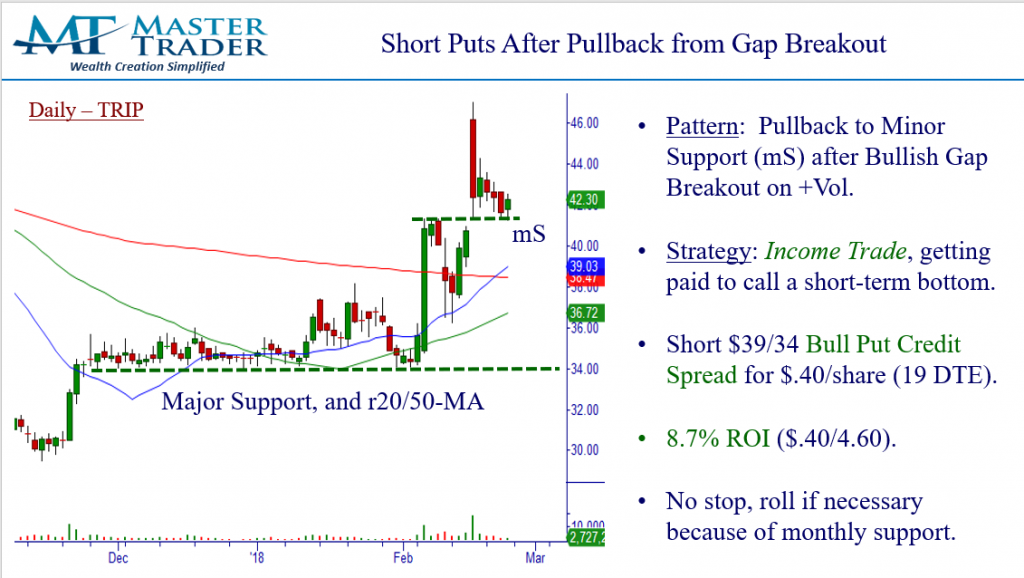
2/26: TRIP – Over $42.52, short $39/34 Bull Put Credit Spread for $.40/share (19 DTE). No stop, roll if necessary because of monthly support.
Miscellaneous Member Documents and Reminders:
Adjustments and Comments on Open and Closed trades in Master Trader’s Market Edge Advisory Letter. Note: Our Trade Updates are timely posted in a separate Report in the Member’s Area. Please CLICK HERE to see that document for a current reflection on all Open and Closed Trades since the spreadsheet updates immediately and will always be more current than this e-mail update.
Please see Master Trader Guidelines for Trading the Open and Gaps in Member’s Area for rules on trade entry, gaps, etc.
Below is a link to individual videos explaining in greater detail the definitions of the main option trading strategies used by Master Trader in its advisory letters to generate wealth and income.
Description of Master Trader Directional and Income Option Trades can be seen HERE
Please Sign Up for New WhatsApp Text Alert Service for Timely Trade Updates!
As a subscriber to the Master Trader’s Market Edge Advisory Letter, we would like to text you alerts for timely new trade opportunities and/or updates to open positions.
WhatsApp will allow us to post more detailed alerts (without being constrained by character limits), and also allow our many subscribers all over the world to receive these alerts (and you when you are traveling).
Please download the app on your phone if you want to take advantage of this service. You can read about the product at https://www.whatsapp.com/
Once downloaded, email Dan@mastertrader.com with your Name and Cell # to get the invitation to the “MasterTrader Advisory” Group. This app allows us to text all around the world. We reserve the right to ban anyone from the group for posting.
PLEASE DO NOT TEXT REPLIES HERE AS IT BROADCASTS TO ALL SUBSCRIBERS (instead, kindly e-mail dan@mastertrader with any questions). We reserve the right to ban anyone from the group for posting.
Our Trade Updates are timely posted in a separate Report in the Member’s Area. Please CLICK HERE to see that document for a current reflection on all Open and Closed Trades and adjustments since the spreadsheet updates immediately.
Since you have enjoyed this Service, please review the following for more detailed education — and profits!
You can sign up for the Master Trader Weekly Options Trader here. It is designed for the active trader wanting to generate weekly income from high probability short-term option selling, including news, gaps, earnings, and volatility trades around compelling chart patterns.
To learn how to create Wealth and Generate Income using our simple Option Strategies, please see Master Trader Option Strategies Series for Investors and Active Traders. Our unique approach is guaranteed to increase your ability to trade options with confidence with superior reward-risk that doesn’t take a lot of time.
Thank you for being a loyal subscriber and feel to email us with any questions or comments on anything.
MasterTrader and You Building Your Financial Future Together
Happy trading! If you have any questions or comments, please e-mail Greg Capra at Greg@mastertrader.com or Dan Gibby at Dan@mastertrader.com
All the best,
Greg Capra
Managing Director of Master Trader
Pristine’s Founder and Creator of the Pristine Method
Dan Gibby
Chief Options Strategist
Follow Greg on Twitter, YouTube, and StockTwits to get real-time updates and education:
Twitter: @GregCapra
Stocktwits: Greg_Capra
youtube.com/c/mastertrader (please subscribe to receive all the timely stock market updates)
