
 In last week’s letter, I mentioned the weekly “Hangman candle” on the weekly time frame. Hangman candles suggest a short-term top, but with any pattern that we trade as Master Trader, there must be confirmation of the pattern by trading above or below a defined reference point.
Not only was there no confirmation to that hangman, many markets accelerated above it — and higher with some forming a Wide Range Bar (WRB) — by week’s end. With two trading days left until the end of the month, the broader markets look like they will close with a bullish WRB.
Most of you know that such a candle, after a multiple bar move in one direction, is suggestive of traders “throwing caution to the wind” and chasing prices higher.
In last week’s video, I mentioned the possibility of prices continuing to move higher in the possibility of not participating in that because of prices being short-term extended. Well, extended has become “more extended” and there is the real possibility that the broader markets may accelerate even higher.
Historical measurements of extension provide us with “reasonable and objective” guidelines as to when the probability of retracements are likely. However, during the rare times when the broader markets, a sector or an individual stock defies historical norms, it can be difficult to follow those guidelines; meaning, not enter when everything seems perfect and that “nothing can go wrong.”
As we come across the trading patterns that we use, we will have recommendations based on them as we had last week and in this letter. Then we manage the risk accordingly. However, this is where some get in trouble — whether the markets are extended or not.
As traders looking for relatively short-term moves, our risk (money management) rules are based on those trade setups. Their are going to be setups that don’t work out and will hit our stop, that’s normal in trading or investing.
In markets like this one — where the bearish reversals have no or little follow-through — they lure you into believing that prices will always come back. And when it doesn’t work, that is when large losses occur that were never expected or calculated for. We do not want to see that happen to you; hence, these cautionary comments.
The Markets Now
My preaching about risk management aside, the markets continued to be strong and we do not have a sell signal from our market internals, even now. As also mentioned last week, markets can have normal retracements without the internals providing a sell signal. When the internals gives us that sell signal, the expectation is that a larger correction is likely.
With the broader markets having pushed higher on Friday and looking like they are going to accelerate higher, a bar-by-bar trail stop under a prior day’s low is appropriate.
There are a lot of earnings reports coming out this week with the FANG Stocks on deck: Facebook (FB), Microsoft (MSFT), Amazon (AMZN), Google (GOOGL) — and the mighty Apple (AAPL) — will be reporting this week.
In addition, there are eight other Dow Industrial stocks that are reporting; two being McDonald’s (MCD) and Boeing (BA) (Apple and Microsoft are in the Dow).
Adjusting and Rolling Option Strategies webinar recording link is at the end of the letter.
DOW JONES INDUSTRIAL AVG.
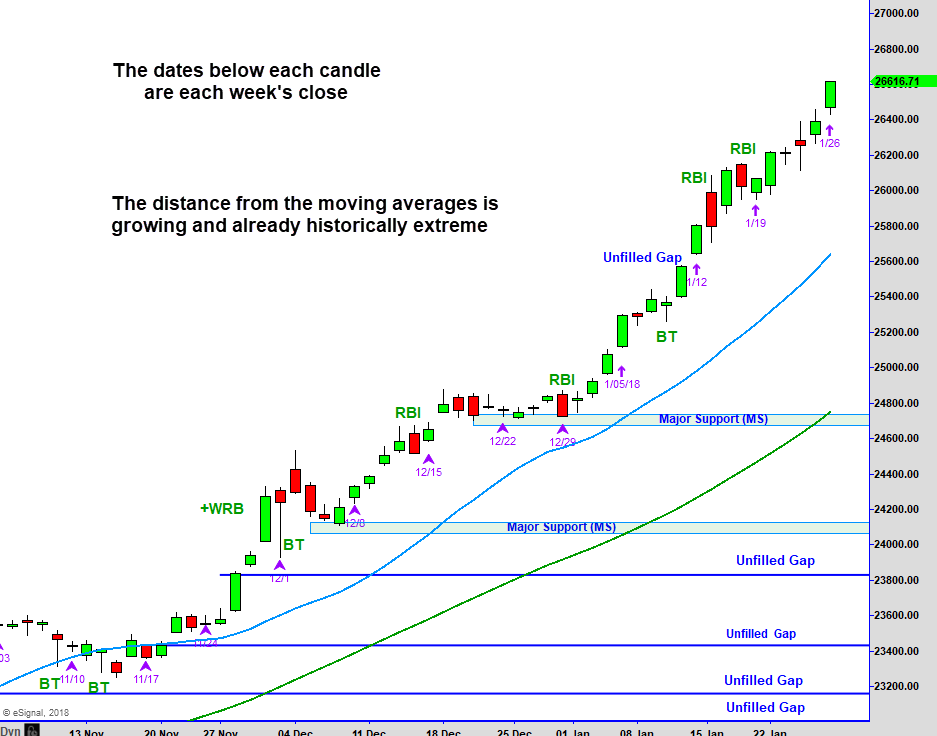
Above is the chart of the Dow Jones Industrial Average that we review each week. Last week prices climbed higher relatively slowly, day after day in the pace to the upside increase on Friday. As you can see from the chart, prices closed right near the high of the day — which was also at the high of the week.
This year, the move higher started from the first area marked as Major Support (MS). It never looked back other than the two red candles marked RBI, which means Red Bar Ignored. RBI candles within an uptrend or bullish confirmation of that trend tells us that buyers are aggressively buying on intraday dips.
With last week’s continued move up — within this relentless uptrend, coupled with Friday’s expanding range and high close, is the type of pattern that accelerates higher. This is why I said at the start of this commentary that there is the real possibility of prices accelerating higher. For that reason, the suggestion of a bar-by-bar trial stops.
DJI 27,000 is only 400 points away — and within striking distance of the type of accelerated move that is possible. That is only a 1 ½% move and that can happen within the next two trading days. The Dow would then be up about 10% in a month. That is a big move in a short amount of time, and this one is coming at the wrong time.
DOW JONES INDUSTRIAL AVG. MONTHLY CHART and PERCENTAGE GAIN
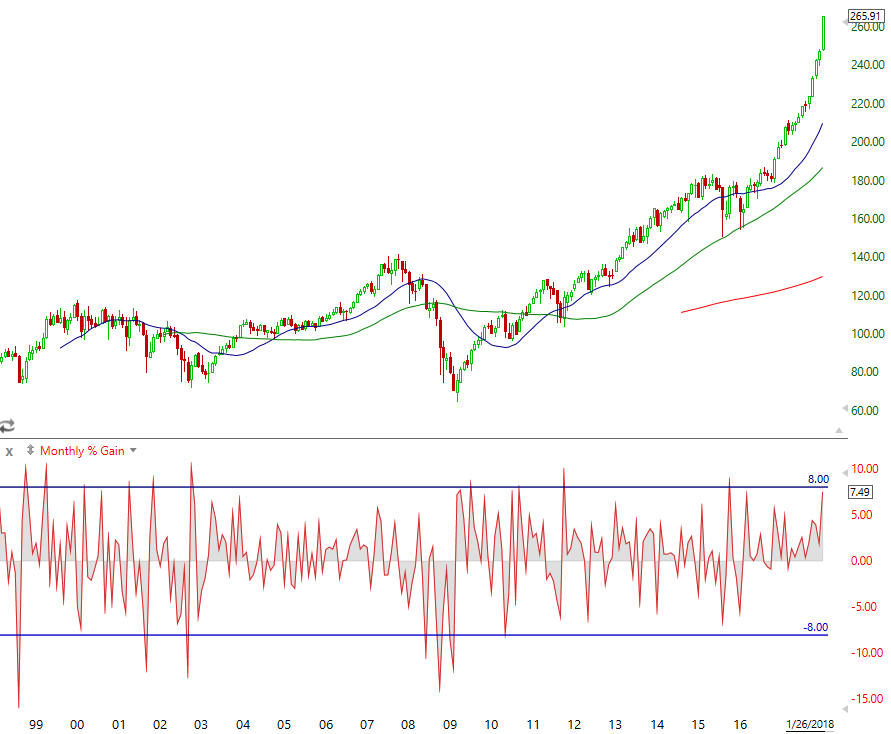
The chart above is a monthly chart of the Dow Jones Industrial average shown with the ETF symbol DIA. Below the price chart is the monthly gains for each month since the beginning of 1998.
While there are other times in this history where the Dow was up more than 8% in a month, those one-month gains happened after a small — or large correction. This monthly gain is going to happen after prices have been moving up since November 2017 — and accelerating higher.
We all know that risk on the long side is rising and I have provided objective information to measure what we already know. The internals have not given us a sell signal yet, so it seems likely based on last week’s price action that the acceleration of the move higher is coming.
As a student of the markets, extreme moves are interesting and exciting to see how they’re going to play out. What will be the news event that may be what is focused on as the reason for the correction? Stay tuned.
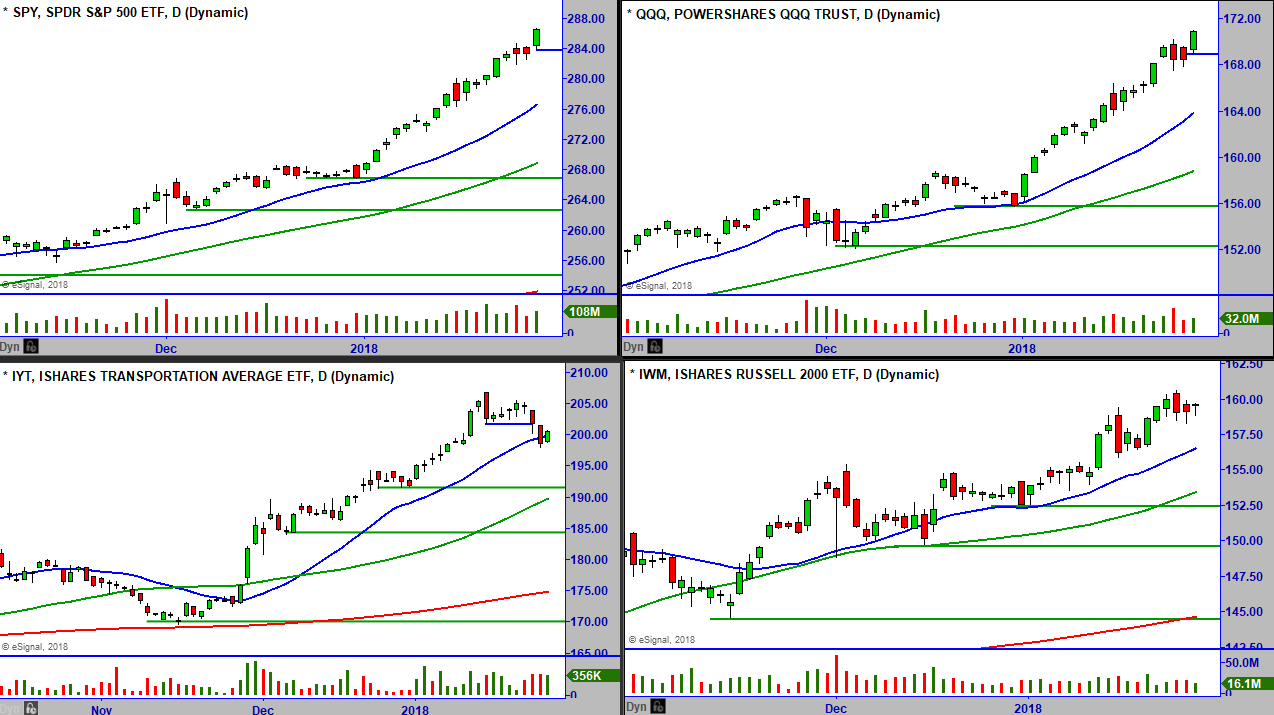
BROADER MARKETS
[s3mv fileName=’Jan+2018+letter/Broadermarkets_1_26_18.mp4′ fileType=’video’ source=’s3′ width=’800′ height=’480′ splashImage=” preLoad=’Y’ autoPlay=’N’ belowVideoHTML=” cuePoint=” redirectURL=” pauseAtCuePoint=’N’ fixedSizeVideo=’N’ isSecure=’Y’ bucketname=”]
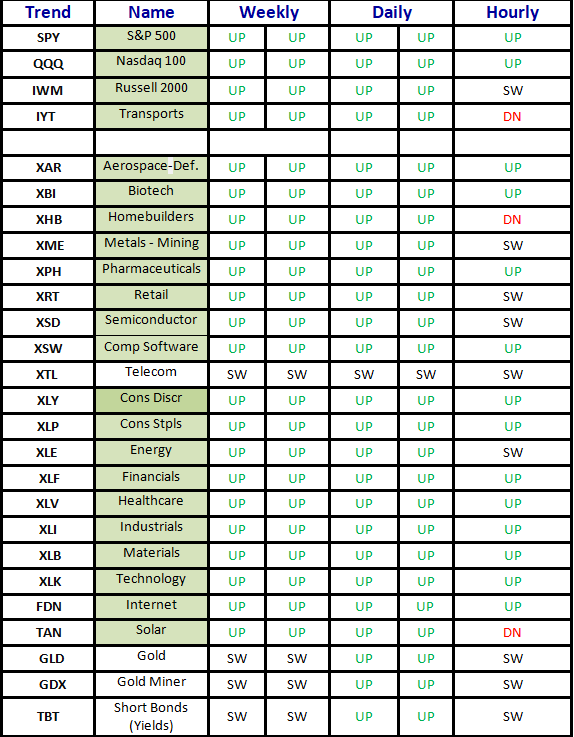
TREND MATRIX AND INTERNALS
[s3mv fileName=’Jan+2018+letter/tRENDS_1_26_18.mp4′ fileType=’video’ source=’s3′ width=’800′ height=’480′ splashImage=” preLoad=’Y’ autoPlay=’N’ belowVideoHTML=” cuePoint=” redirectURL=” pauseAtCuePoint=’N’ fixedSizeVideo=’N’ isSecure=’Y’ bucketname=”]

New Trade Ideas
Below is a daily chart of Caterpillar Inc. (CAT).
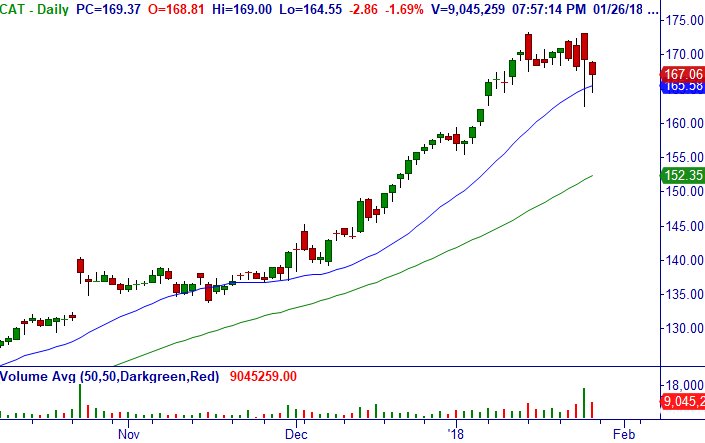
Trade: Under $165.50, consider shorting Feb (2/16) $175/185 bear call credit spread (18 DTE) at mid-point (closed at $1.12/share).
Technical Setup: Breakdown after earnings daily (Implied Volatility Rank still high at 92!), Climactic Sell Setup weekly and monthly.
Option Strategy: Bear Call Credit Spread (BCS).
Stop Loss: $173.22.
Below is a daily chart of American Express Company (AXP).

Trade: Under $98.95, consider shorting Feb (2/16) $100/105 bear call credit spread (18 DTE) at mid-point (closed at $1.19/share).
Technical Setup: Sell Setup into gap fill Minor Resistance and 20-MA daily, overbought market.
Option Strategy: Bear Call Credit Spread (BCS).
Stop Loss: $100.22.
Below is a daily chart of Darden Restaurants, Inc. (DRI).
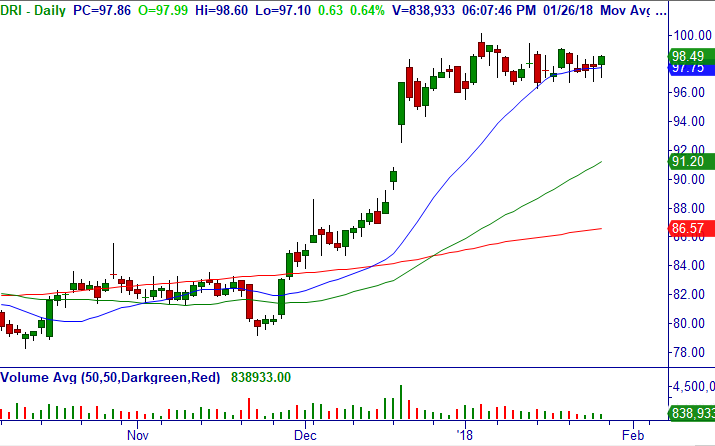
Trade #1: Over $99.10, consider buying Feb (2/16) $90 call options (18 DTE) for a limit of $9.30/share (which is only paying $.20/share time value) as a swing directional option trade. Stop Loss: $96.18.
Trade #2: Over $99.10, consider shorting Feb (2/16) $95/90 Bull Put Credit Spread (18 DTE) for mid-price (closed at $.52/share). Note that this trade has a higher probability of profit than long calls, but the gain is limited to the premium received. Stop Loss: $95.88.
Technical Setup: Breakout on daily and weekly to new highs.
Below is a daily chart of Fortinet, Inc. (FTNT).

Trade: Over $46.25, consider buying stock for a swing trade.
Technical Setup: Bullish consolidation after a +WRB negating a bear gap at the r20-MA daily, bullish weekly and monthly.
Stop Loss: $45.08 Note: Earnings 2/5 so exit before that.
Below is a daily chart of Republic Services, Inc. (RSG).
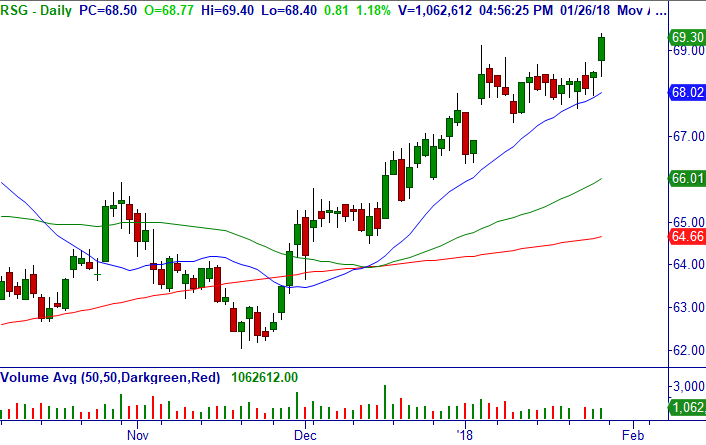
Trade: Over $69.40, consider buying stock for a swing trade.
Technical Setup: Bullish gap breakout and bottoming tail above r20-MA daily, bullish weekly and monthly to new highs.
Stop Loss: $67.94 initially. Note: Earnings 2/8 so exit before that.
Below is a daily chart of The Gap, Inc. (GPS).
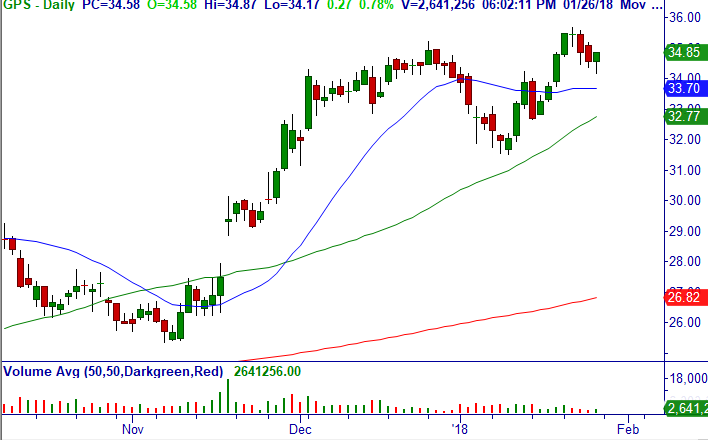
Trade: Over $34.87, consider buying stock for a swing trade.
Technical Setup: Master Trader Buy Setup, Bullish Reversal Bar and Bottoming Tail above r20-MA daily, bullish weekly and monthly.
Stop Loss: $34.16. Note: Earnings 2/22 so exit before that.
Below is a daily chart of Terex Corporation (TEX).
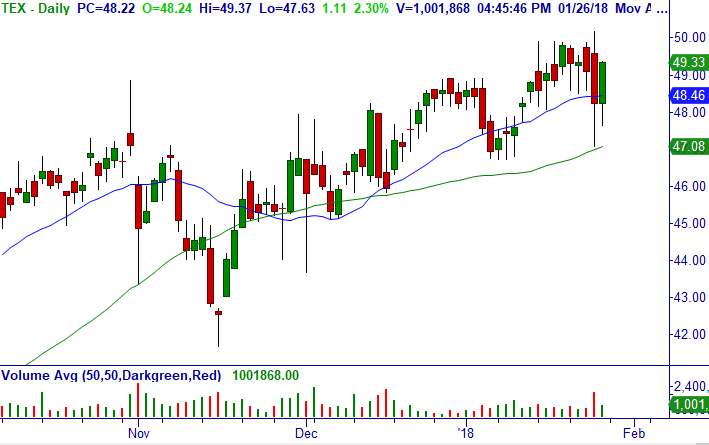
Trade: Over $49.37, consider shorting Feb (2/16) $47/42 bull put credit spread (18 DTE) for mid-point but limit of $.57/share (closed at $.65/share).
Technical Setup: Uptrend all time frames, Income Trade with short strike below last Thursday’s -WRB.
Option Strategy: Bull Put Credit Spread (BPS).
Stop Loss: $47.07.
Below is a daily chart of Industrial Select Sector SPDR ETF (XLI).
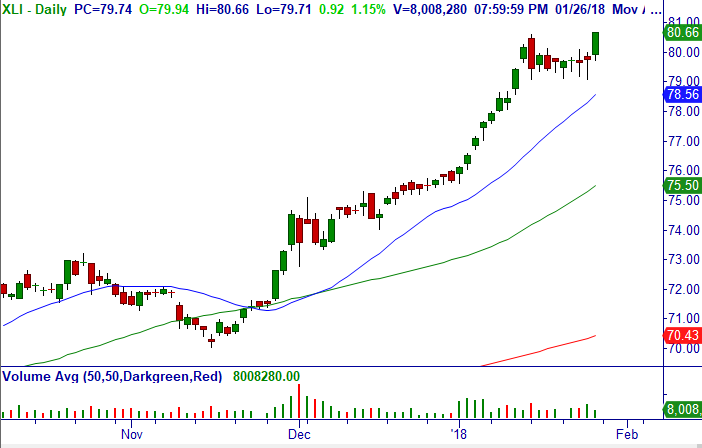
Trade: Over $80.66, consider buying Feb (2/16) $76/82 bull call debit spread (18 DTE) for a limit of $4.45/share (which is giving at least $.22/share positive time decay).
Technical Setup: Breakout daily, bullish weekly and monthly.
Option Strategy: Bull Call Debit Spread (BCS).
Stop Loss: $79.70.
Recording of Adjusting and Rolling Option Strategies
If you missed our great educational webinar, not to worry, here is the link if you would like to watch and/or review again:
https://register.gotowebinar.com/register/2696963872604864003
Miscellaneous Member Documents and Reminders:
Adjustments and Comments on Open and Closed trades in Master Trader’s Market Edge Advisory Letter. Note: Our Trade Updates are timely posted in a separate Report in the Member’s Area. Please CLICK HERE to see that document for a current reflection on all Open and Closed Trades since the spreadsheet updates immediately and will always be more current than this e-mail update.
Please see Master Trader Guidelines for Trading the Open and Gaps in Member’s Area for rules on trade entry, gaps, etc.
Below is a link to individual videos explaining in greater detail the definitions of the main option trading strategies used by Master Trader in its advisory letters to generate wealth and income.
Description of Master Trader Directional and Income Option Trades can be seen HERE
Please Sign Up for New WhatsApp Text Alert Service for Timely Trade Updates!
As a subscriber to the Master Trader’s Market Edge Advisory Letter, we would like to text you alerts for timely new trade opportunities and/or updates to open positions.
WhatsApp will allow us to post more detailed alerts (without being constrained by character limits), and also allow our many subscribers all over the world to receive these alerts (and you when you are traveling).
Please download the app on your phone if you want to take advantage of this service. You can read about the product at https://www.whatsapp.com/
Once downloaded, email Dan@mastertrader.com with your Name and Cell # to get the invitation to the “MasterTrader Advisory” Group. This app allows us to text all around the world. We reserve the right to ban anyone from the group for posting.
PLEASE DO NOT TEXT REPLIES HERE AS IT BROADCASTS TO ALL SUBSCRIBERS (instead, kindly e-mail dan@mastertrader with any questions). We reserve the right to ban anyone from the group for posting.
Our Trade Updates are timely posted in a separate Report in the Member’s Area. Please CLICK HERE to see that document for a current reflection on all Open and Closed Trades and adjustments since the spreadsheet updates immediately.
Since you have enjoyed this Service, please review the following for more detailed education — and profits!
You can sign up for the Master Trader Weekly Options Trader here. It is designed for the active trader wanting to generate weekly income from high probability short-term option selling, including news, gaps, earnings, and volatility trades around compelling chart patterns.
To learn how to create Wealth and Generate Income using our simple Option Strategies, please see Master Trader Option Strategies Series for Investors and Active Traders. Our unique approach is guaranteed to increase your ability to trade options with confidence with superior reward-risk that doesn’t take a lot of time.
Thank you for being a loyal subscriber and feel to email us with any questions or comments on anything.
Happy trading! If you have any questions or comments, please e-mail Greg Capra at Greg@mastertrader.com or Dan Gibby at Dan@mastertrader.com
All the best,
Greg Capra
Managing Director of Master Trader
Pristine’s Founder and Creator of the Pristine Method
Dan Gibby
Chief Options Strategist
Follow Greg on Twitter, YouTube, and StockTwits to get real-time updates and education:
Twitter: @GregCapra
Stocktwits: Greg_Capra
youtube.com/c/mastertrader (please subscribe to receive all the timely stock market updates)
