

Well, the first correction of 2018 is now behind us. Oh, you didn’t see it, you must have blinked! I’m joking of course, but based on Tuesday’s Topping Tail (TT) after multiple days higher, it didn’t look like there would be more than an intra-day dip.
By the end of the day on Wednesday, I was convinced that the markets were going to go higher. However, I didn’t think they would move as much as they did. I covered how things shaped up into Wednesday’s close in the Chart of the Week video. If you missed it, here is the link to that video.
If you’re not getting the Chart of the Week newsletter into your inbox, you can sign up at the website by just entering your name and email. To get alerts when Dan and I post videos on YouTube, click the subscribe button there and the bell.
Unless the markets start to pull back from here, it certainly looks like this is a blow-off run to the upside.
In the Chart of the Week video, I said that this looked like it could be a “measured move” higher and, so far, that looks like exactly what is going to happen. A measured move setup is a continuation pattern. The second part of the move is about equal in length to the first.
As a rule, I don’t trade a long measured move type of patterns unless they start from a base that was preceded by a downward correction. The start of the current potential measured move did start from a base. However, it was a base in an uptrend that started in November 2016.
In other words, it’s not the high probability scenario for a measured move to work; this one looks like it’s going to. If it does, that would put the S&P 500 Cash Index moving higher to the 2814 area. These measured moves rarely ever work out exactly to the number, but that is what the exact number would be. It’s a guide.
We will be looking at the market internals in the video below, but I will say now that I am surprised that the breadth is not already at an extreme.
While all the equity sectors followed in the trend matrix — except for telecom — are now in trend agreement in both the weekly and daily time frame., why is’nt breadth at an extreme already?
Percentage of Stocks Above 40-MA
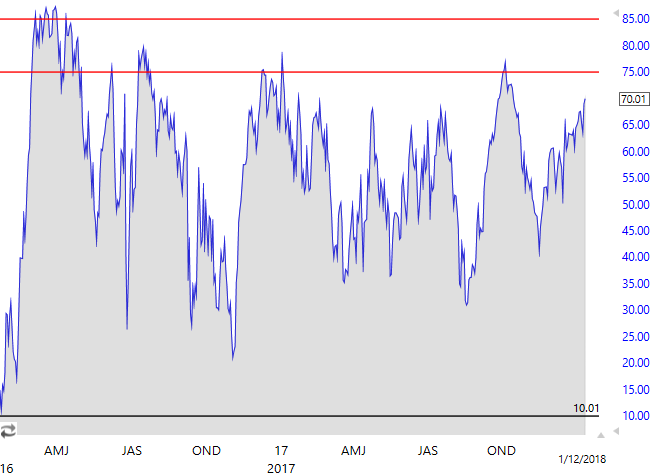
The chart above displays the percentage of stocks being monitored that are above their 40-period moving average. As you can see, the extremely high level has not been reached yet.
So while the broader markets and most sectors are moving higher, there are still many of the stocks within those broader market indices and sectors that are still below their 40-period moving average. I suspect that if the measured move does play out to the upside, this chart will reach its extreme level.
The sentiment is already been extreme and has been for a week. Historically, even without breadth at an extreme, sentiment reaching an extreme will typically cause at least some corrective action. The novice group of option traders that typically jump on board after the move has occurred — and is obvious to everyone — rarely profit from their timing like they had this time.
DOW JONES INDUSTRIAL AVG.
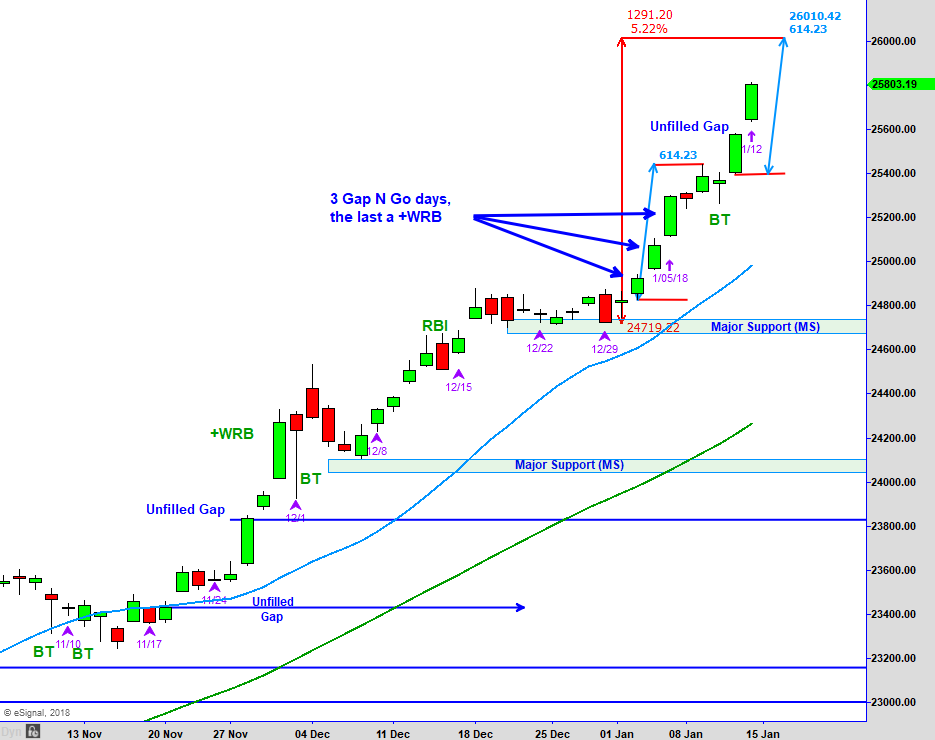
Above is the chart of the Dow Jones Industrial Average that review each week. On Wednesday, the broader markets opened lower and continued to fall, but by 10:30 – 11 o’clock ET, the selling was subsiding. By the end of the day, there were Bottoming Tails (BT) everywhere.
Many stocks, some of which I mentioned in the Chart of the Week video, closed at or near the high the day. What appeared like what would result in a short-term pullback after Tuesday’s Topping Tail (TT) now had the look of a possible measured move higher.
In the chart of the Dow, I measured from the low day that broke out of the range to the high of the topping tail bar. After a five-day almost vertical move higher and Topping Tail, it would be normal to have a minor pullback.
So the first anticipated correction of 2018 turned out to be a one-day intra-day dip and recovery. From the start of the move out of the base on 1-03-18 to the top of the Topping Tail bar on 1-09-18 is 614.23 points.
From the low candle on 01-11, the start of the move above the high of the BT candle projected the same distance higher puts the measured move at 26,010.
If it gets there, the Dow will have moved 1,297.20 points or 5.22% in a short time. And that doesn’t mean it can’t go higher; however, the higher it goes without correcting, the greater the odds of a longer correction. Historically, vertical moves result in an initial short pullback and then a retracement to test the high.
Stay tuned!
Percentage Gains for Broader Market and Main Sectors
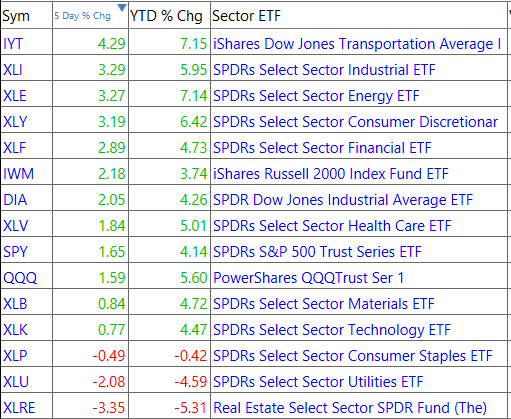
The transports were the best performer last week, up just over 4%. Utilities and real estate continue to be the weakest. Consumer staples went negative, but still within a consolidation after a strong move higher at the end of the year.
BROADER MARKETS
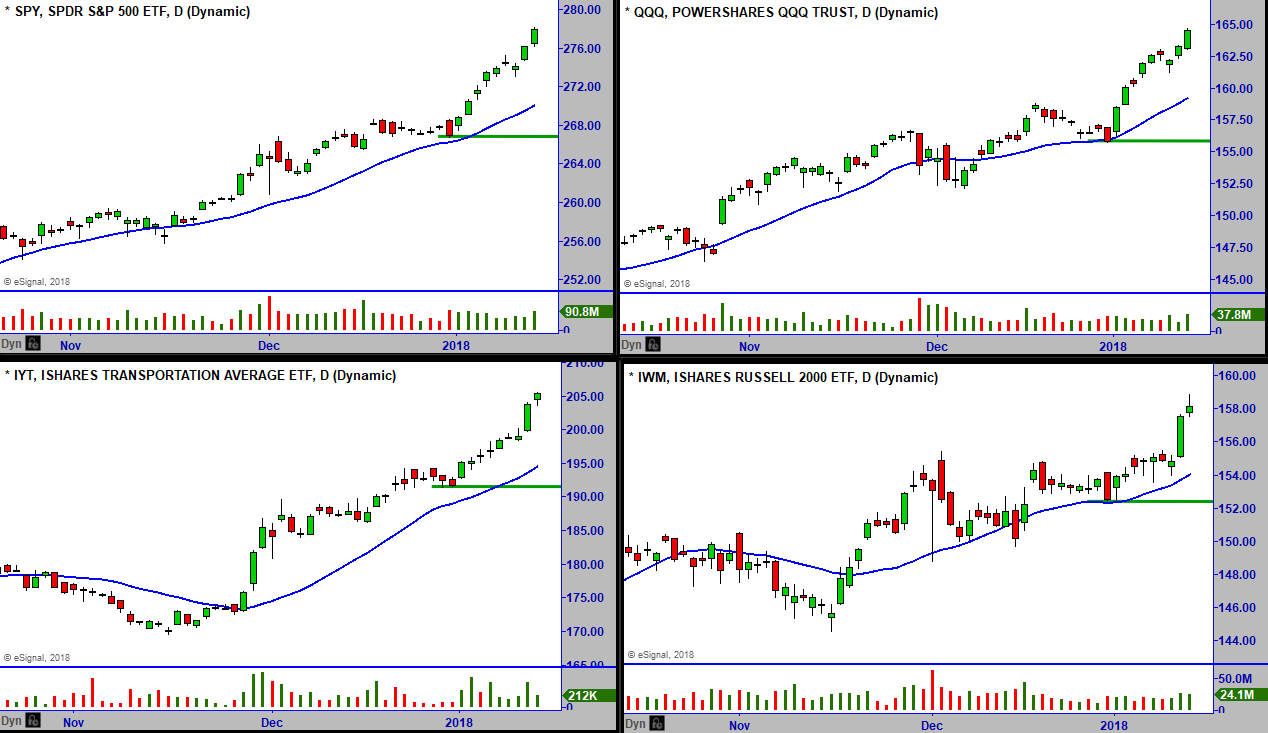
[s3mv fileName=’Jan+2018+letter/BroaderMarkets_1_16.mp4′ fileType=’video’ source=’s3′ width=’800′ height=’480′ splashImage=” preLoad=’Y’ autoPlay=’N’ belowVideoHTML=” cuePoint=” redirectURL=” pauseAtCuePoint=’N’ fixedSizeVideo=’N’ isSecure=’Y’ bucketname=”]
TREND MATRIX AND INTERNALS
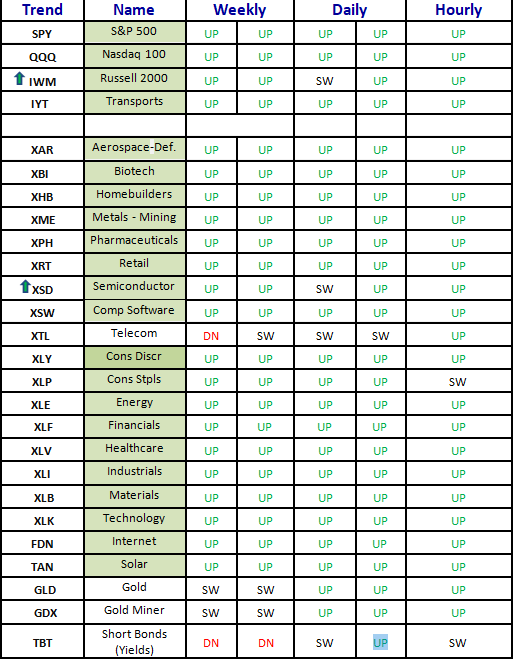
Best to view in full screen
[s3mv fileName=’Jan+2018+letter/Trends_Internals_1_16.mp4′ fileType=’video’ source=’s3′ width=’800′ height=’480′ splashImage=” preLoad=’Y’ autoPlay=’N’ belowVideoHTML=” cuePoint=” redirectURL=” pauseAtCuePoint=’N’ fixedSizeVideo=’N’ isSecure=’Y’ bucketname=”]
New Trade Ideas
Below is a weekly chart of ProShares UltraShort 20+ Year Treasury (TBT).
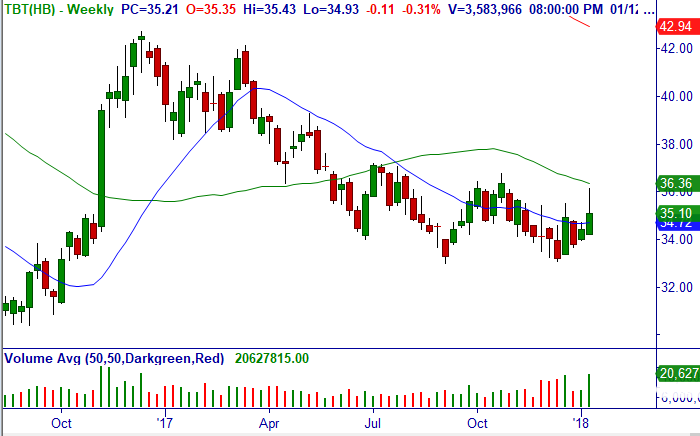
Trade #1: Over $35.10 or the 10-Min. high, consider shorting Feb (2/15) $35/31 bull put credit spread (31 DTE) for current mid-point (closed at $.75/share).
Trade #2: Over $35.43 (or prior day’s high), consider buying TBT for a core trade. We will monitor to sell options to convert into a covered call to lower cost basis.
Technical Setup: Three-day pull back after Bullish Gap Breakout from multi-week trading range daily, bullish weekly and monthly.
Option Strategy: Bull Put Credit Spread (BPS).
Stop Loss: None. Because of the longer-term, bottoming charts, we will roll every week as necessary.
Below is a daily chart of Bristol-Myers Squibb Company (BMY).
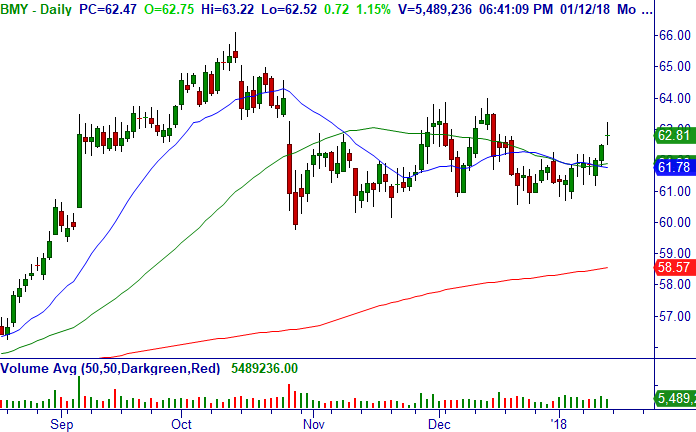
Trade #1: Consider shorting Feb (2/2) $61/58 bull put credit spread (18 DTE) for around closing mid-point of $.41/share.
Trade #2: Consider buying stock between $62.40 and $62.81 for a core trade, and also sell the Feb (2/16) $67.5 call options (31 DTE) as an earnings covered call to lower cost basis.
Below is a monthly chart of BMY which is why we like longer term:
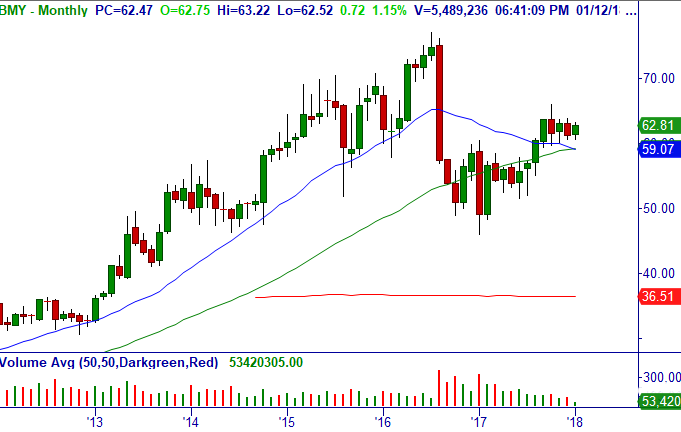
Technical Setup: Breakout from multi-week trading range daily, bullish weekly and monthly.
Option Strategy: Bull Put Credit Spread (BPS); Covered Call (CC).
Stop Loss: $60.48. Note: Earnings 2/5.
Below is a weekly chart of Lannett Company, Inc. (LCI).
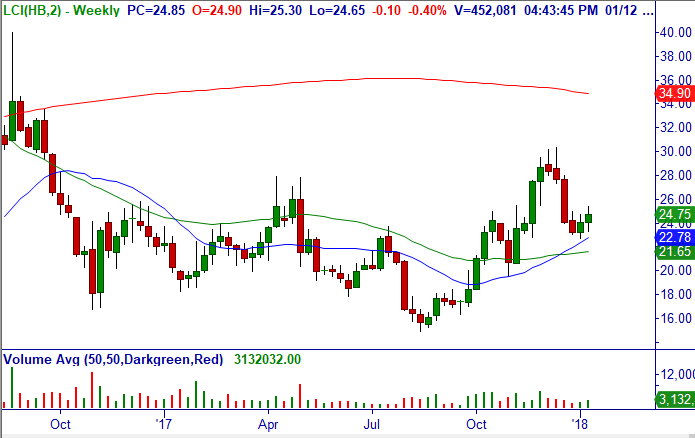
Trade: Over $25.40, consider buying stock as a core trade.
Technical Setup: Bullish consolidation in top range of +WRB after bullish W Formation daily, Master Trader Buy Setup with bullish reversal bar at r20-MA weekly, bullish multi-month consolidation.
Stop Loss: $23.28 Earnings 1/30.
Below is a weekly chart of Chico’s FAS, Inc. (CHS).
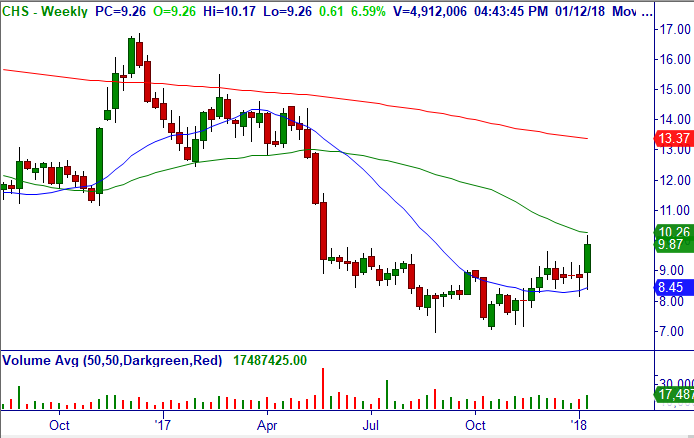
Trade: Consider buying stock around current prices of $9.87 for a swing trade. Then try to sell the Feb (2/16) $11 call options (31 DTE) for around $.50/share (closed at $.10 x .25 so need rally) to lower cost basis.
Technical Setup: Breakout daily, weekly and monthly.
Option Strategy: Covered Call (CC).
Stop Loss: $8.38. Note: Earnings 2/28.
Below is a daily chart of ViaSat, Inc. (VSAT).
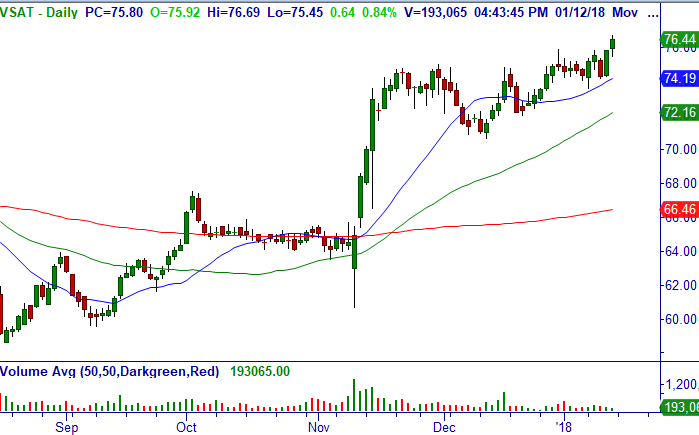
Trade: Over $76.69, consider buying stock as swing trade.
Technical Setup: Bullish breakout from consolidation above r20-MA daily and weekly, bullish monthly.
Stop Loss: $74.27. Earnings 2/7.
Below is a daily chart of Iridium Communications Inc. (IRDM).
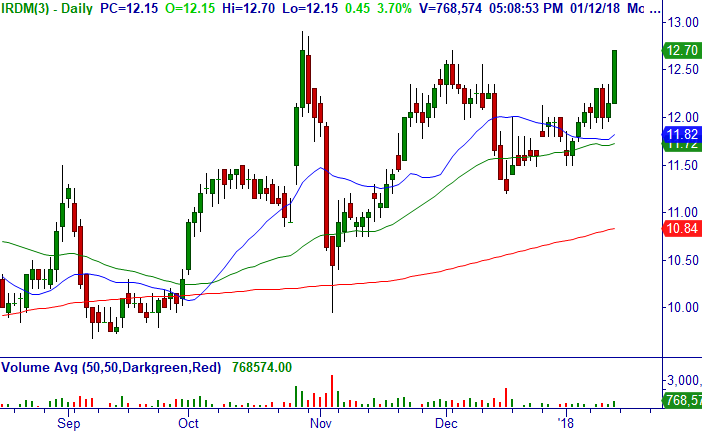
Trade: Over $12.70, consider buying stock as a core trade.
Technical Setup: Breakout daily, weekly, and monthly to new highs.
Stop Loss: $11.87. Earnings 2/21.
Miscellaneous Member Documents and Reminders:
Adjustments and Comments on Open and Closed trades in Master Trader’s Market Edge Advisory Letter. Note: Our Trade Updates are timely posted in a separate Report in the Member’s Area.
Please CLICK HERE to see that document for a current reflection on all Open and Closed Trades since the spreadsheet updates immediately and will always be more current than this e-mail update.
Please see Master Trader Guidelines for Trading the Open and Gaps in Member’s Area for rules on trade entry, gaps, etc.
Below is a link to individual videos explaining in greater detail the definitions of the main option trading strategies used by Master Trader in its advisory letters to generate wealth and income.
Description of Master Trader Directional and Income Option Trades can be seen HERE
Please Sign Up for New WhatsApp Text Alert Service for Timely Trade Updates!
As a subscriber to the Master Trader’s Market Edge Advisory Letter, we would like to text you alerts for timely new trade opportunities and/or updates to open positions.
WhatsApp will allow us to post more detailed alerts (without being constrained by character limits), and also allow our many subscribers all over the world to receive these alerts (and you when you are traveling).
Please download the app on your phone if you want to take advantage of this service. You can read about the product at https://www.whatsapp.com/
Once downloaded, email Dan@mastertrader.com with your Name and Cell # to get the invitation to the “MasterTrader Advisory” Group. This app allows us to text all around the world. We reserve the right to ban anyone from the group for posting.
PLEASE DO NOT TEXT REPLIES HERE AS IT BROADCASTS TO ALL SUBSCRIBERS (instead, kindly e-mail dan@mastertrader with any questions). We reserve the right to ban anyone from the group for posting.
Our Trade Updates are timely posted in a separate Report in the Member’s Area. Please CLICK HERE to see that document for a current reflection on all Open and Closed Trades and adjustments since the spreadsheet updates immediately.
Since you have enjoyed this Service, please review the following for more detailed education — and profits!
You can sign up for the Master Trader Weekly Options Trader here. It is designed for the active trader wanting to generate weekly income from high probability short-term option selling, including news, gaps, earnings, and volatility trades around compelling chart patterns.
To learn how to create Wealth and Generate Income using our simple Option Strategies, please see Master Trader Option Strategies Series for Investors and Active Traders. Our unique approach is guaranteed to increase your ability to trade options with confidence with superior reward-risk that doesn’t take a lot of time.
Thank you for being a loyal subscriber and feel to email us with any questions or comments on anything.
Happy trading! If you have any questions or comments, please e-mail Greg Capra at Greg@mastertrader.com or Dan Gibby at Dan@mastertrader.com
All the best,
Greg Capra
Managing Director of Master Trader
Pristine’s Founder and Creator of the Pristine Method
Dan Gibby
Chief Options Strategist
Follow Greg on Twitter, YouTube, and StockTwits to get real-time updates and education:
Twitter: @GregCapra
Stocktwits: Greg_Capra
youtube.com/c/mastertrader (please subscribe to receive all the timely stock market updates)
