
 We have the first week of 2018 behind us and it has started out better than the first week of 2017. Both years were preceded with corrective price action prior to the first week. However, 2016 saw a larger correction prior to the immediate move higher.
We will take a look at the charts of the NASDAQ 100 ETF both years at the time.
In 2016, the presidential election results ignited a move higher in November. In several months prior to that, the broader markets were correcting downward to sideways. This wasn’t the case in 2017.
In other words, the markets have been moving up for a few months and are now beginning to accelerate higher.
So while the first week of the New Year has done better than the one in 2017, the fact that 2017 was preceded by a larger correction, that was a better scenario than we have in 2018 to suggest a similar outcome.
Putting a “similar outcome” in perspective, depending on the broader market ETF being viewed, gains were in the area of 10% to as much as 32%.
The energy sector was down just over 4% (see last week’s letter), but the charts are now suggesting that energy will be an out performer this year.
We are long XOM and XLE (with bullish option trades on XOP and OIH) and are looking to get more long exposure in the energy sector, as you will see in this letter.
QQQ 2017 and 2018
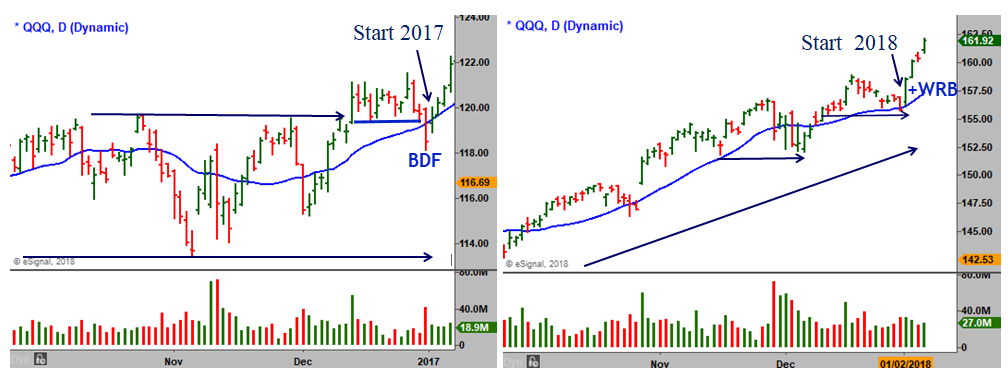
Above are the daily charts of the NASDAQ 100 ETF symbol QQQ. On the left is the end of 2016 in the first four days of 2017; on the right 2017 into the start of 2018.
As you can see, 2016 was a relatively wide sideways correction that broke out in December and then made its last dip lower on the last trading day of 2016. 2017 immediately reversed that down day forming a Breakdown Failure (BDF).
The beginning of 2017 was an initial breakout of the overall sideways correction that had been happening at the end of 2016 — the start of a new move.
The chart on the right is a relatively stable uptrend of higher highs and higher lows. Whereas, the end of 2017 was a downward sloping bullish angle of a correction into price support and the rising 20-period moving average.
The first day of 2018 was a Wide Range Bar (+WRB) that ignited the move higher last week. I think the obvious question that comes to mind is, “how long can this uptrend continue?”
Said it Last Week, But Worth Repeating
I addressed this in last week’s letter videos where I covered the broader markets and sectors from a very long-term perspective.
And while that does not provide a definitive answer as to the continuation of the trend, the odds do favor it at this time.
I said last week: “That’s a logical thought, especially after the markets have moved up as much as they have last year. However, one of the lessons that I learned years ago was that markets would trend either up or down longer than what seems logical.
There are always things that we don’t know that will make the broader markets, individual sectors, and/or stocks continue their trend. Those unknowns will always be there, and that can be hard to accept from a logical point of view.
Master Traders accept the unknown as such — and then simply, and easily, follow the trends in multiple time frames. We will continue to do that in 2018 and adjust our strategies as changes occur throughout the New Year.”
DOW JONES INDUSTRIAL AVG.
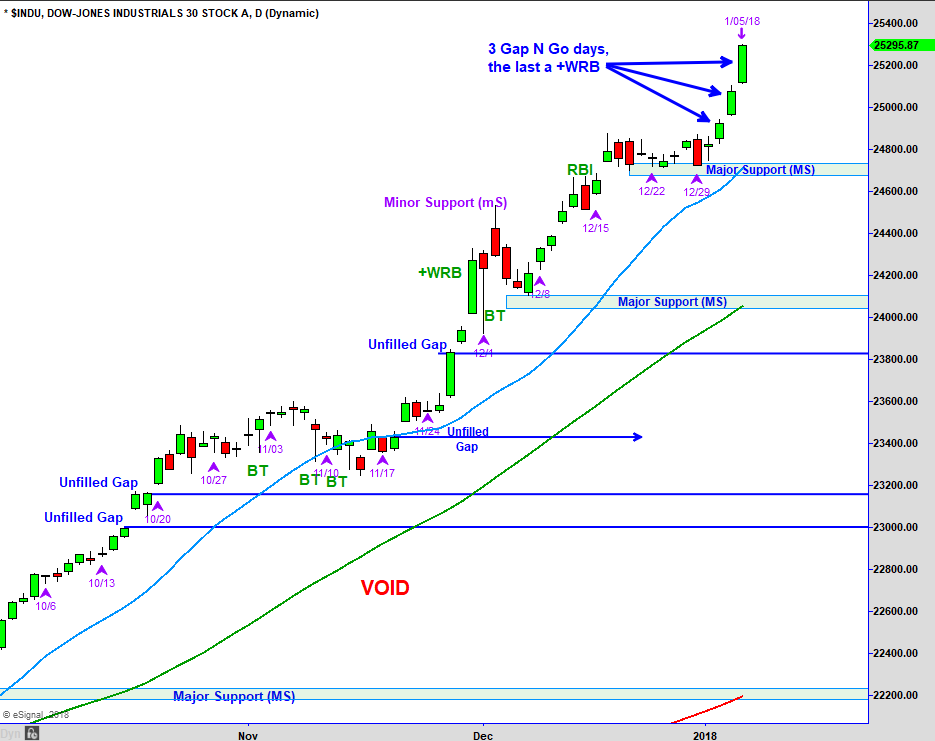
Above is the chart of the Dow Jones Industrial Average that review each week. Compared to the NASDAQ 100 chart that we just reviewed, the Dow moved sideways into year-end, rather than a downward sloping correction into the rising 20-period moving average; relative strength and more bullish.
While the first day of the New Year was an inside consolidation day, the following three days were all a Gap N Go higher. Friday was a bullish Wide Range Bar (+WRB) signaling that traders were very bullish and wanted to be long over the weekend and looking for higher prices on Monday.
From an intermediate-term bullish point of view, ideally, the Dow does not accelerate vertically higher from here. Even if Monday and Tuesday do move higher, a pullback will follow.
Master Trader Tip: Vertical moves within an ongoing uptrend historically set up a deep downward or longer sideways correction.
The first area below marked Major Support (MS) is the most recent higher low within the uptrend. A move below that, if it occurs, would violate the uptrend in the daily time frame and would be a breakout failure on the weekly time frame.
Right now, the trend is up and we will stay bullish until that’s no longer the case. Our market internal gauges are not signaling a top at this time, so there’s still “gas in the tank.” We’ll take a look at those in the video below.
Percentage Gains for Broader Market and Main Sectors
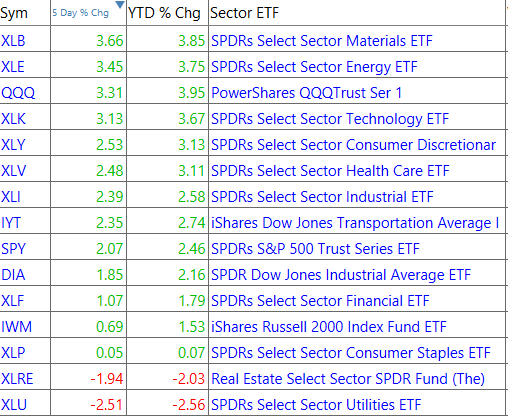
The Utilities were the worst performer last week and now at Major Support (MS), not shown. Maybe it will bounce from that price support.
BROADER MARKETS
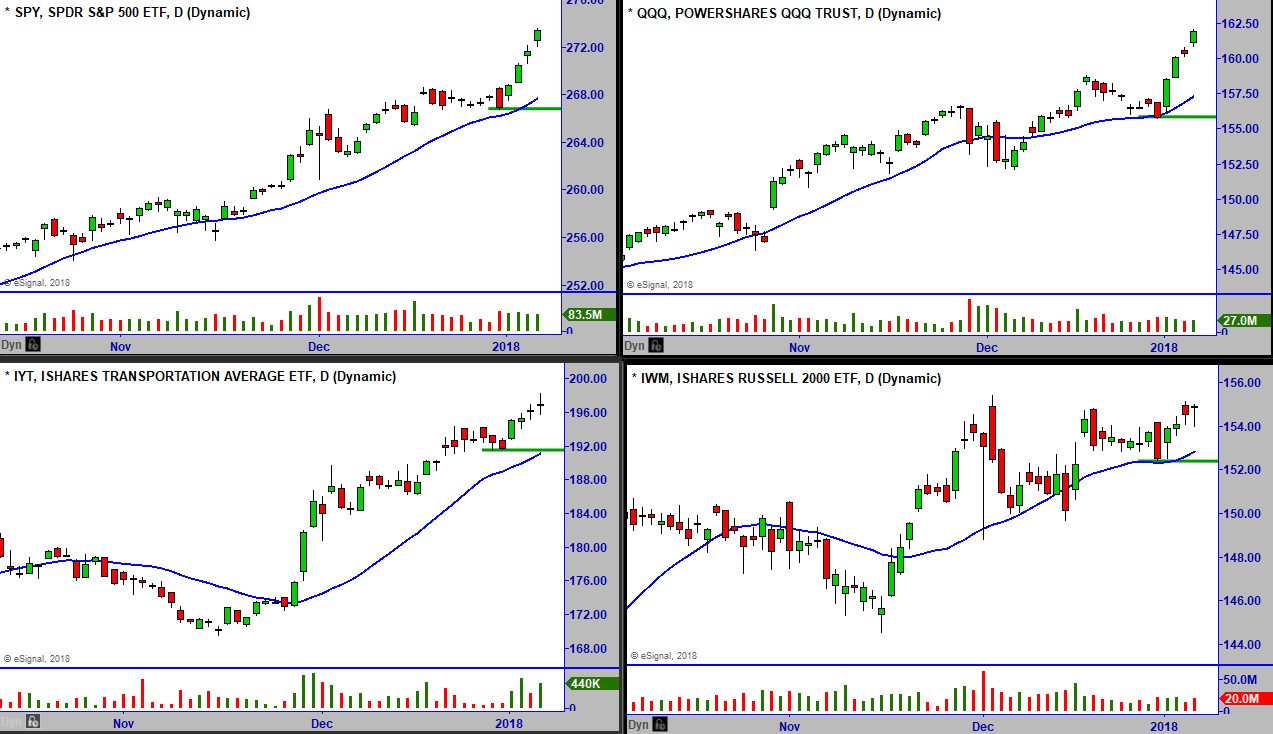
[s3mv fileName=’Jan+2018+letter/BroaderMarket_1_08_18.mp4′ fileType=’video’ source=’s3′ width=’800′ height=’480′ splashImage=” preLoad=’Y’ autoPlay=’N’ belowVideoHTML=” cuePoint=” redirectURL=” pauseAtCuePoint=’N’ fixedSizeVideo=’N’ isSecure=’Y’ bucketname=”]
TREND MATRIX AND INTERNALS
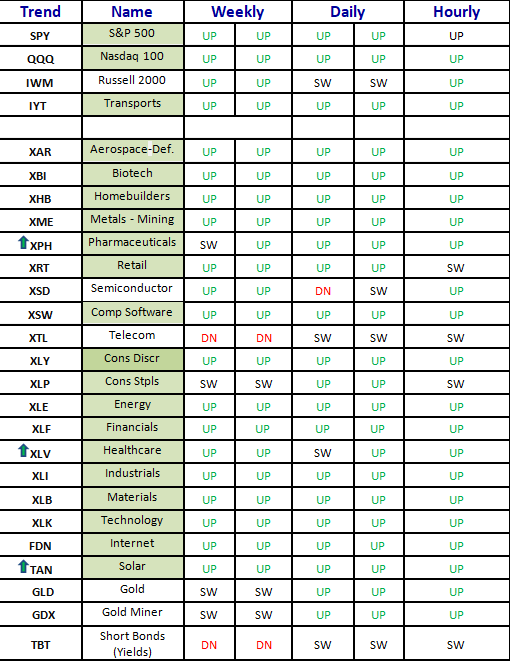
[s3mv fileName=’Jan+2018+letter/Sector_Trends_1_8_18.mp4′ fileType=’video’ source=’s3′ width=’800′ height=’480′ splashImage=” preLoad=’Y’ autoPlay=’N’ belowVideoHTML=” cuePoint=” redirectURL=” pauseAtCuePoint=’N’ fixedSizeVideo=’N’ isSecure=’Y’ bucketname=”]

New Trade Ideas
Below is a daily chart of Wal-Mart Stores, Inc. (WMT).
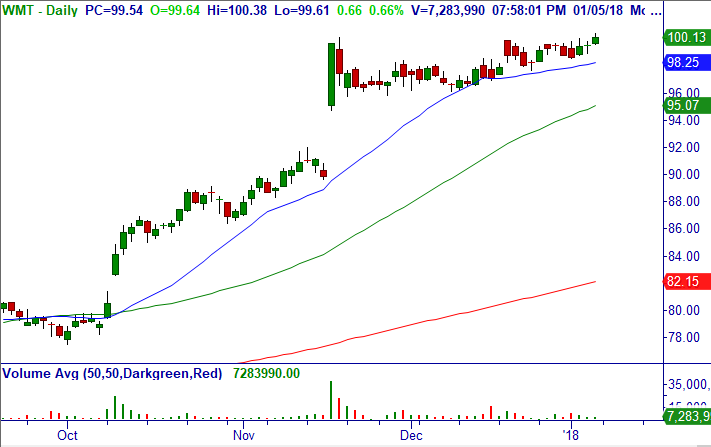
Trade: Over $100.38, consider buying stock and shorting Feb (2/16) $105 calls (40 DTE) for mid-point (calls closed at $.79 x .80/share so the premium will lower our cost basis and give us positive time decay income).
Technical Setup: Breakout on daily and weekly after multi-week consolidation above r20-MA.
Option Strategy: Covered Call (CC).
Stop Loss: $97.58. Note: Earnings 2/19/18.
Below is a monthly chart of SPDR S&P Pharmaceuticals ETF (XPH).
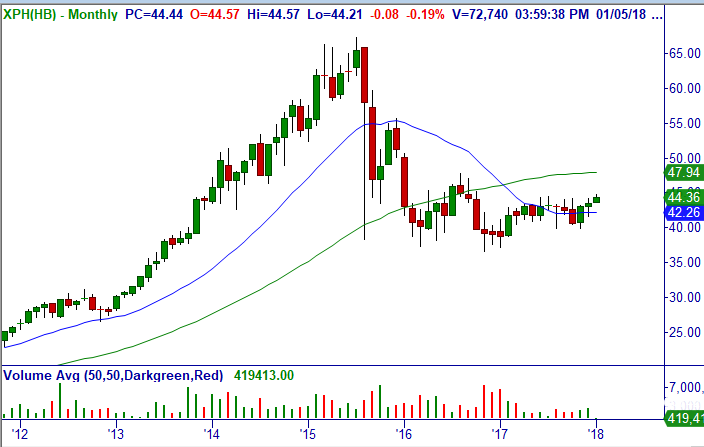
Trade: Over $44.57 (or prior day’s high), consider buying stock for a core trade.
Technical Setup: Breakout on daily, bullish weekly and monthly after a multi-year trading range.
Stop Loss: $43.35.
Below is a weekly chart of Health Care Select Sector SPDR ETF (XLV).
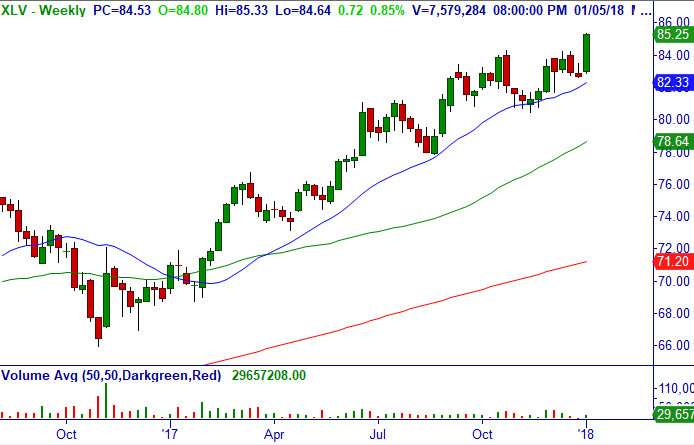
Trade: Consider buying stock anywhere between the current price of $85.25 down to the low $84s for a core trade. Note: Daily is extended but with the powerful breakout from multi-month consolidation, it should not retrace greatly but up to you to work the best entry per your trading plan.
Trade #2: Consider shorting Feb (2/16) $84/74 Bull Put Credit Spread (40 DTE) for a minimum of its closing mid-price of $.67/share (because spready and extended). Note that this trade has a higher probability of profit than long stock because of lower cost basis, but gain is limited to the premium received.
Technical Setup: Breakout on daily, bullish weekly and monthly to new highs.
Stop Loss: $82.58.
Below is a monthly chart of Perrigo Company plc (PRGO).
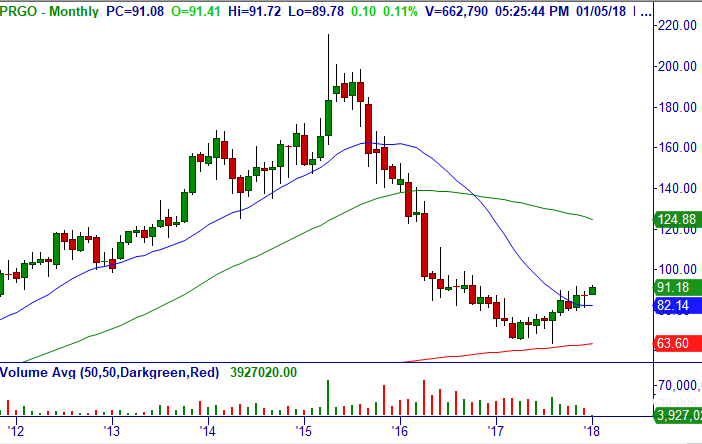
Trade: Over $92.04, consider buying Feb (2/16) $80/100 bull call debit spread (40 DTE) for a limit of $11.90/share (closed at $11.10/share which is giving positive time decay).
Trade #2: Over $92.04, consider shorting Feb (2/16) $85/70 Bull Put Credit Spread (40 DTE) for a minimum of $1.40/share (closed at $1.35/share but spready). Note that this trade has a higher probability of profit than long stock because of lower cost basis, but gain limited to the premium received.
Technical Setup: Breakout on daily, bullish weekly and monthly after multi-week/month consolidation, strong sector.
Option Strategy: Bull Call Debit Spread (BCS); Bull Put Credit Spread (BPS).
Stop Loss: $87.03. Earnings 2/26.
Below is a daily chart of Xunlei Limited (XNET).
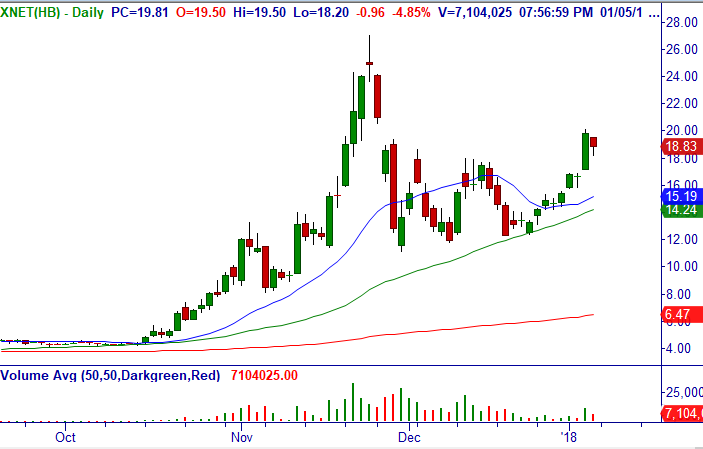
Trade: Over $20.10, consider buying stock for a swing trade, stop $17.13.
Trade #2: Over $20.10, consider shorting Jan (1/12) $15/10 Bull Put Credit Spread (12 DTE) for a minimum of $.40/share (closed at $.45/share). Stop Loss: $15.78.
Technical Setup: Bullish +123 Continuation following Breakout from multi-week trading range daily.
Option Strategy: Bull Put Credit Spread (BPS).
Below is a weekly chart of SPDR S&P Oil & Gas Equipment&Svcs ETF (XES).
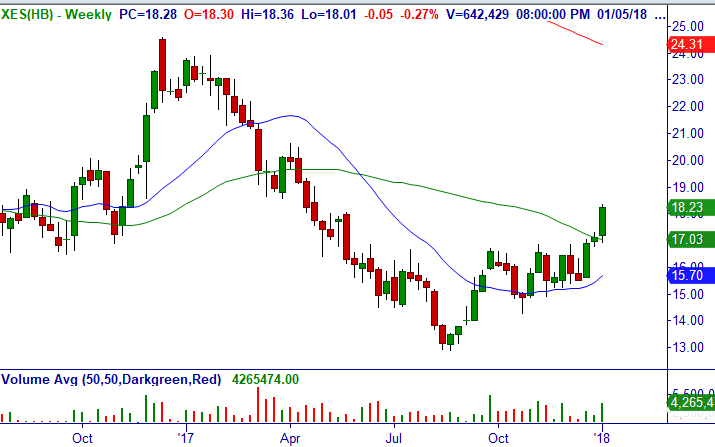
Trade: Consider shorting Feb (2/16) $18 naked puts (40 DTE) for a limit of $.80/share (closed at $.55 x .70 but extended daily).
Technical Setup: Breakout daily/weekly/monthly.
Option Strategy: Short Naked Puts (SP).
Stop Loss: None for now.
Sorry for the improper formatting of these remaining trades:
The Michaels Companies, Inc. (MIK).
Trade: Over $24.63, consider buying Feb (2/16) $20/25 bull call debit spread (40 DTE) for a limit of $4.00/share (closed at $3.98/share which gives us a Max Gain of $1.00/share if expires over $25, which is 20% return on capital and positive time decay).
Technical Setup: Breakout on daily, bullish weekly and monthly.
Option Strategy: Bull Call Debit Spread (BCS.
Stop Loss: $23.58.
AKAM – Provided it opens over $65.60, then over 10-Min. high, consider shorting Jan (1/19) $64/62 Bull Put Credit Spread (12 DTE) for around closing mid-point of $.30/share. Stop Loss: None. If trades under $64.65, sell Jan (1/19) $67.5/70 Bear Call Credit Spread to leg into iron Condor.
CAR – Over $44.61, consider shorting Jan (1/19) $42.5/39 Bull Put Credit Spread (12 DTE) for a minimum of $.33/share (closed at $.37/share). Stop Loss: $43.08.
Miscellaneous Member Documents and Reminders:
Adjustments and Comments on Open and Closed trades in Master Trader’s Market Edge Advisory Letter. Note: Our Trade Updates are timely posted in a separate Report in the Member’s Area. Please CLICK HERE to see that document for a current reflection on all Open and Closed Trades since the spreadsheet updates immediately and will always be more current than this e-mail update.
Please see Master Trader Guidelines for Trading the Open and Gaps in Member’s Area for rules on trade entry, gaps, etc.
Below is a link to individual videos explaining in greater detail the definitions of the main option trading strategies used by Master Trader in its advisory letters to generate wealth and income.
Description of Master Trader Directional and Income Option Trades can be seen HERE
Please Sign Up for New WhatsApp Text Alert Service for Timely Trade Updates!
As a subscriber to the Master Trader’s Market Edge Advisory Letter, we would like to text you alerts for timely new trade opportunities and/or updates to open positions.
WhatsApp will allow us to post more detailed alerts (without being constrained by character limits), and also allow our many subscribers all over the world to receive these alerts (and you when you are traveling).
Please download the app on your phone if you want to take advantage of this service. You can read about the product at https://www.whatsapp.com/
Once downloaded, email Dan@mastertrader.com with your Name and Cell # to get the invitation to the “MasterTrader Advisory” Group. This app allows us to text all around the world. We reserve the right to ban anyone from the group for posting.
PLEASE DO NOT TEXT REPLIES HERE AS IT BROADCASTS TO ALL SUBSCRIBERS (instead, kindly e-mail dan@mastertrader with any questions). We reserve the right to ban anyone from the group for posting.
Our Trade Updates are timely posted in a separate Report in the Member’s Area. Please CLICK HERE to see that document for a current reflection on all Open and Closed Trades and adjustments since the spreadsheet updates immediately.
Since you have enjoyed this Service, please review the following for more detailed education — and profits!
You can sign up for the Master Trader Weekly Options Trader here. It is designed for the active trader wanting to generate weekly income from high probability short-term option selling, including news, gaps, earnings, and volatility trades around compelling chart patterns.
To learn how to create Wealth and Generate Income using our simple Option Strategies, please see Master Trader Option Strategies Series for Investors and Active Traders. Our unique approach is guaranteed to increase your ability to trade options with confidence with superior reward-risk that doesn’t take a lot of time.
Thank you for being a loyal subscriber and feel to email us with any questions or comments on anything.
Happy trading! If you have any questions or comments, please e-mail Greg Capra at Greg@mastertrader.com or Dan Gibby at Dan@mastertrader.com
All the best,
Greg Capra
Managing Director of Master Trader
Pristine’s Founder and Creator of the Pristine Method
Dan Gibby
Chief Options Strategist
Follow Greg on Twitter, YouTube, and StockTwits to get real-time updates and education:
Twitter: @GregCapra
Stocktwits: Greg_Capra
youtube.com/c/mastertrader (please subscribe to receive all the timely stock market updates)
