
Many traders learn candlestick patterns and quickly notice something frustrating:
The same pattern doesn’t always produce the same result.
That’s because the pattern itself is not the edge.
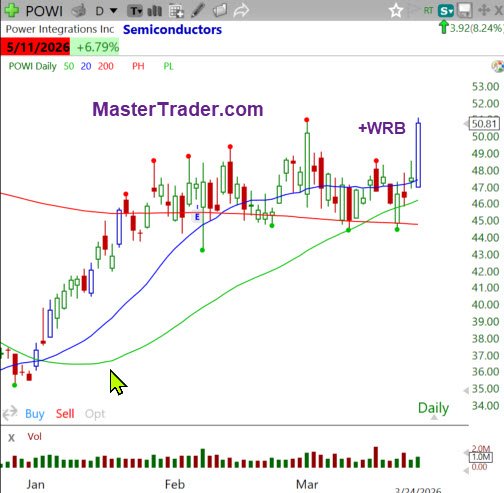
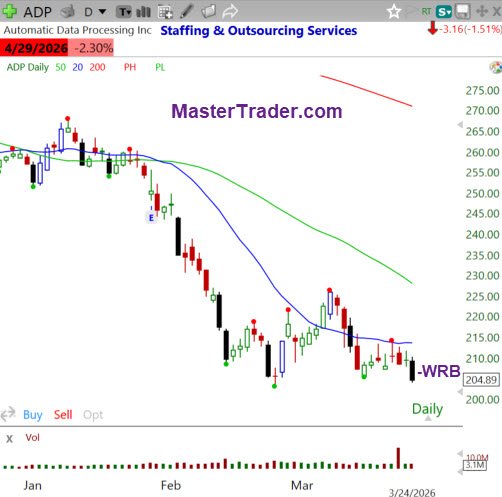
Context is the edge. I have listed some of today's scan results below, and two charts
And that’s exactly what the Master Trader Technical Strategies (MTS) bar-by-bar approach is designed to provide.
The MTS Perspective: Reading the Story of Price
Bar-by-bar analysis is not about memorizing patterns.
It’s about developing a continuous read of:
- What price has done
- What it is doing now
- What it is likely to do next
- What traders are thinking and what they are likely to do next!
Charts are simply a visual representation of traders’ beliefs and expectations—expressed with money. When you learn to read that properly, patterns stop being random and start becoming predictable in context.
Among all candlestick formations, one consistently stands out:
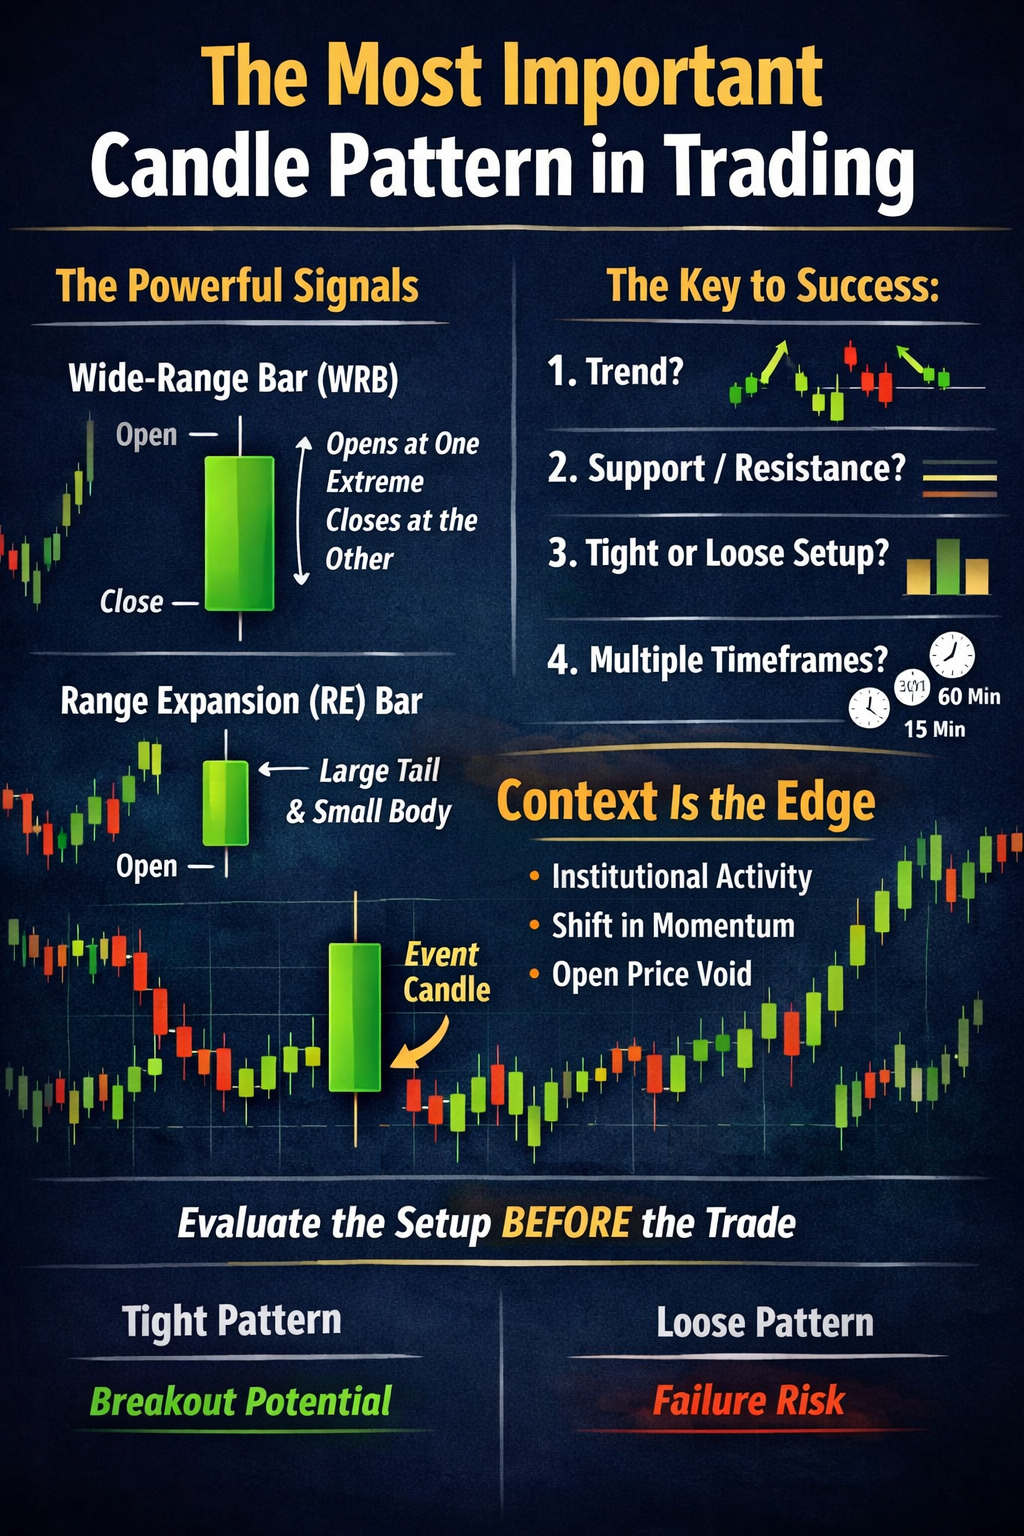
The Wide-Range Bar (WRB) / Range Expansion (RE) Bar
These are candles that are visibly different from the surrounding price action:
- A wide-range body closing near one extreme (institutional conviction)
- Or a range expansion bar with a tail and small body (aggressive rejection)
These are not ordinary candles.
They represent a shift in supply and demand—often driven by institutional activity.
Why These Bars Are So Powerful
A significant WRB or RE bar tells you:
- Momentum has expanded
- Control has shifted (buyers vs. sellers)
- Something meaningful just changed
It may be news-driven or purely technical, but the cause doesn’t matter.
Price already reflects it.
And when a bar clearly stands out from everything to the left, it becomes an event.
The Candle That Matters Most
But Here’s Where Most Traders Go Wrong
They treat the bar as a signal.
In MTS, it’s only the starting point.
The real edge comes from evaluating it within context:The MTS Thought Process
Before acting on any WRB or RE bar, ask:
1. What is the trend?
- Uptrend → continuation or exhaustion?
- Downtrend → continuation or reversal?
- Sideways → breakout or failure?
2. Where is it forming? (Support/Resistance)
- At prior support or resistance?
- Into a void (open space)?
- At a major moving average or pivot?
3. What do multiple time frames say?
- Alignment increases probability
- Conflict increases risk
4. Is the pattern tight or loose?
- Tight: controlled, orderly price action → higher quality
- Loose: wide, erratic overlap → lower quality
5. Is there a price void?
- Open space to the left = potential for fast movement
Tight vs. Loose: A Critical Distinction
Two identical-looking candles can produce completely different outcomes.
Why?
Because of the structure leading into them:
- Tight consolidation + WRB → breakout potential
- Loose, erratic price action + WRB → failure risk
This is where most traders misinterpret patterns.
They see the candle—but miss the structure of the pattern the preceded the "Signal Candle."
What About Volume?
Volume can add confirmation, but in MTS:
Price comes first
We’ve seen countless high-quality WRBs and RE bars that led to significant moves without a volume spike.
- Volume spike = confirmation (nice to have)
- Price structure = decision driver
How We Use This in Real Trading
These bars are the foundation of our scans because they highlight:
- Where institutions are active
- Where momentum has changed
- Where opportunity may exist
But scanning is just step one.
Scans and Layouts are Free for Students
How to Put It Together
From there, we evaluate:
- Trend
- Location
- Structure
- Opportunity type
Which can lead to:
- Directional swing trades
- Intraday setups
- Options strategies (including credit spreads)
Today’s Scan (Example Starting Points)
+WRBs:
MCHP, COLB, A, CE, POWI, KBWB, PNC, CFG, TXN, ANET
-WRBs:
ADP, GOOGL, CLX, CHKP, SPGI, VRNS, ZS, WDAY, IT
These are not trades by themselves—they are alerts to potential opportunity.
The edge comes from applying the MTS framework to each one.
Read about the Bar-by-Bar Analysis course, I break down these nuances and a lot more in detail—like management, multiple time frames and trader psychology, so you can move beyond recognizing patterns and start understanding what they actually mean.
This week only, See Your Significant Pre-Applied Discount at the Checkout!
The most important candle pattern in trading isn’t just the WRB or RE bar.
It’s a Great Start to a:
Significant Signal Bar interpreted in the right context
That’s the difference between:
- Random outcomes
- And consistent decision-making
When you learn how these concepts fit together, as I have done in the Bar-By-Bar Course, your trades make far more sense — and your trading decisions become clearer, more confident, and more consistent.
If you have found this post helpful, Share it Forward with other Traders
All the best
Greg Capra
