How MTS turns a correction, failed breakdown, and relative strength into a defined trading opportunity
The MTS Edge: A chart does not have to be complicated to reveal a high-probability opportunity.
More...
The edge comes from understanding what buyers and sellers are doing, recognizing when bearish signals fail, and waiting for price to confirm the trade.
COHU is a strong example of how Master Trader Technical Strategies can simplify decision-making. We do not need a chart crowded with indicators.
Price structure, a few moving averages used as visual aids, wide-range bars, relative strength, and bar-by-bar analysis provide the evidence. I will explain in the chart below.
The Correction Created the Opportunity
COHU was in a strong uptrend earlier in the year and peaked in early July as many semiconductor stocks began correcting. The decline sliced through the rising 50-period moving average (green), paused at the rising 100-period moving average (black), bounced back to the 50-MA (green line), and failed.
When prices later broke below the 100-MA (black), the chart appeared vulnerable to a deeper decline toward the rising 200-MA (red).
Instead, COHU immediately reversed higher after earnings.
That failure to continue lower was the first important bullish clue: sellers had the opportunity to take control, but they could not maintain it.
Wide-Range Bars: The Reaction Matters More Than the Color
The black bars identify bearish wide-range bars that meet specific MTS scan criteria; the blue-outlined bars identify bullish wide-range bars. The scan makes an important bar easy to see, but the bar itself is not the complete signal. We evaluate what happens next.
During the earlier uptrend, most bearish wide-range bars produced little or no downside follow-through. The large bearish bar in early July was different: sellers followed through, and the correction accelerated.
By late July and August, however, the bearish bars again began losing their ability to push prices lower.
The most recent bearish bar produced no follow-through and was followed by an inside day as the 20-MA and 100-MA converged.
Master Trader Tip: Converging moving averages visually confirm price compression. Compression does not predict direction by itself, but it warns that a range expansion may be near. Direction must come from the price pattern and subsequent confirmation.
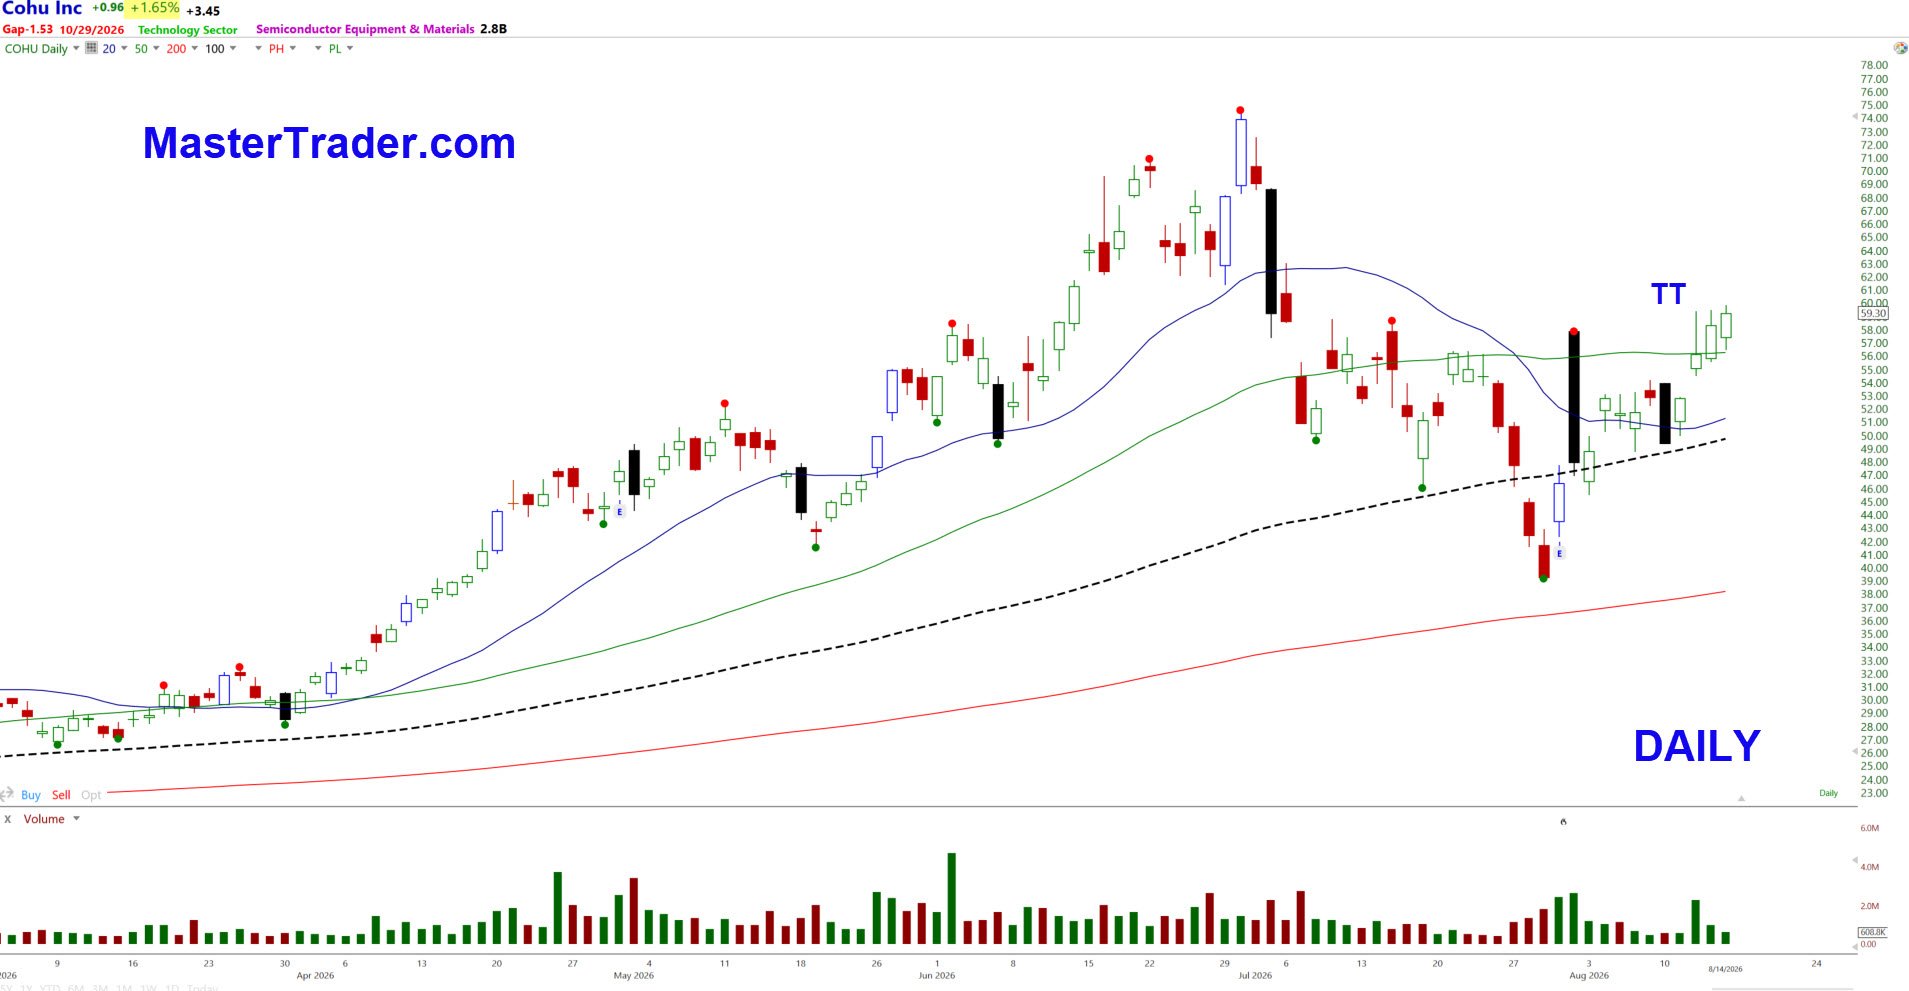
Daily chart of Cohu Inc. (COHU) -
The Last Three Bars Changed the Message
Wednesday, August 12: COHU gapped higher and closed with a Topping Tail (TT). The tail showed that sellers took control after the opening advance. A normal bearish response would have been a decline to fill the gap.
Thursday, August 13: Prices opened near Wednesday's close, advanced toward the Topping Tail high, and held there. The expected downside follow-through never developed. That was bullish.
Friday, August 14: COHU closed positive while the semiconductor ETF (SMH) and Nasdaq 100 ETF (QQQ) finished slightly lower. That relative strength provided another sign that buyers were accumulating the stock.
The Bigger Picture: A Downside Shakeout
The earnings decline below the 100-MA shook out weak holders, but prices quickly reclaimed the breakdown area. The larger pattern can be viewed as a downside shakeout or a developing head-and-shoulders bottom, with COHU now pushing above the neckline area.
This is an important MTS concept: when a bearish pattern fails, it can become powerful fuel in the opposite direction. Traders positioned for a continued decline are forced to cover, while new buyers enter as the bullish structure becomes clearer.
A Defined MTS Trade Plan
Entry trigger: A move above the high of the August 12-14 three-bar consolidation would confirm that buyers have overcome the Topping Tail and activate the bullish setup.
Technical invalidation: A decline below the low of that three-bar consolidation would weaken the immediate breakout thesis. The stop belongs where the pattern is no longer working, not at an arbitrary dollar amount.
Position size: Calculate the difference between the entry and stop, then size the position so the total dollar risk stays within your trading plan. A wider stop requires fewer shares; a tighter valid stop permits more.
Management: The prior resistance to the left becomes the first area to monitor. If momentum expands and price holds above the breakout, you can adjust management bar by bar as new pivots form.
Why This Can Make a Difference: One chart can produce one trade. Learning to recognize the repeatable sequence - correction, failed breakdown, compression, relative strength, confirmation, and risk control - gives you a skill you can apply to thousands of charts. That is how education can improve your odds and support more consistent profitability.
Turn Market Education into Practical Results
Master Trader education is designed to make you self-reliant. You learn how to read price action, understand multiple time frames, recognize high-probability patterns, and manage positions based on objective chart evidence rather than predictions or social-media opinions.
Learn the method: Master Trader course bundles teach MTS from foundational chart reading through advanced technical analysis, position sizing, and money management.
Receive planned opportunities: The Advisory Swing and Options Trader provides setups like this, including entries, stops, management guidance, and timely updates.
Watch MTS applied live: In the Master Trader Green Room, you can see how professional traders evaluate changing conditions and make decisions in real time.
Learn the method. Follow the plan. Build the skills to trade with confidence.
Questions? Email Support@mastertrader.com
If you have found this post helpful, Share it Forward with other Traders. All the best Greg Capra