

Learn How Tails Increase Pattern Probability Success:
Trading high-probability Setups are the same for stocks, bonds, Index and Sector ETFs, commodities, or currencies — on any time frame!
Master Trader teaches many price patterns for trading stocks and options.
Using Bar-by-Bar Analysis, you will know what any price pattern signals — even one that can tell you to do nothing.
In this Trade Review we are going to teach you how a Topping Tail (TT) increased the probability of the Breakdown working using Master Trader Strategies (MTS).
The same logic obviously applies to a Bottoming Tail (BT) if trading an opposite looking Breakout.
With all Setups, we need a Price Void (insignificant resistance to the left for longs, or support for shorts), as you will see here.
Below is a daily chart of Charter
Communications, Inc. (CHTR):
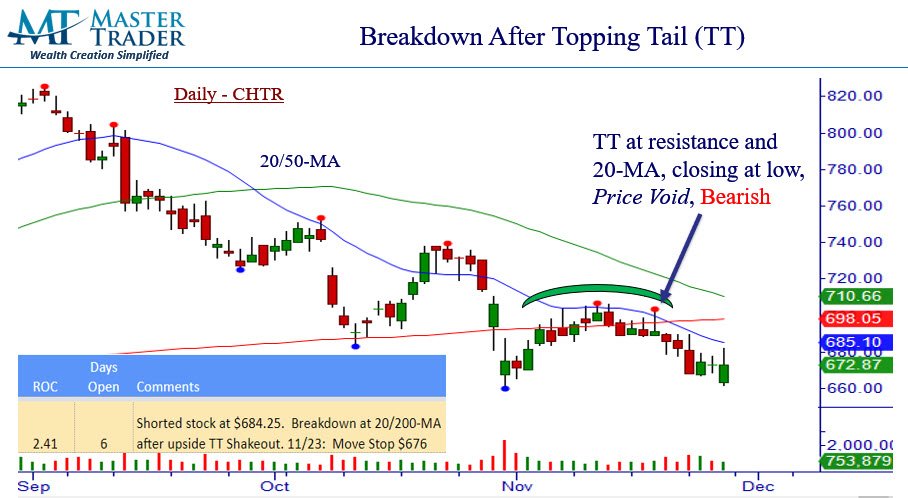
CHTR is in a downtrend on this time frame, which is defined by two or more lower pivot highs and lower pivot lows.
Master Trader teaches many price patterns in uptrends, downtrends, and sideways trends.
The pattern here is a Breakdown; however, it’s the message of the TT which makes this setup High Odds.
Here are different range bars, as well as TT and BT. Learn to recognize them easily and quickly.
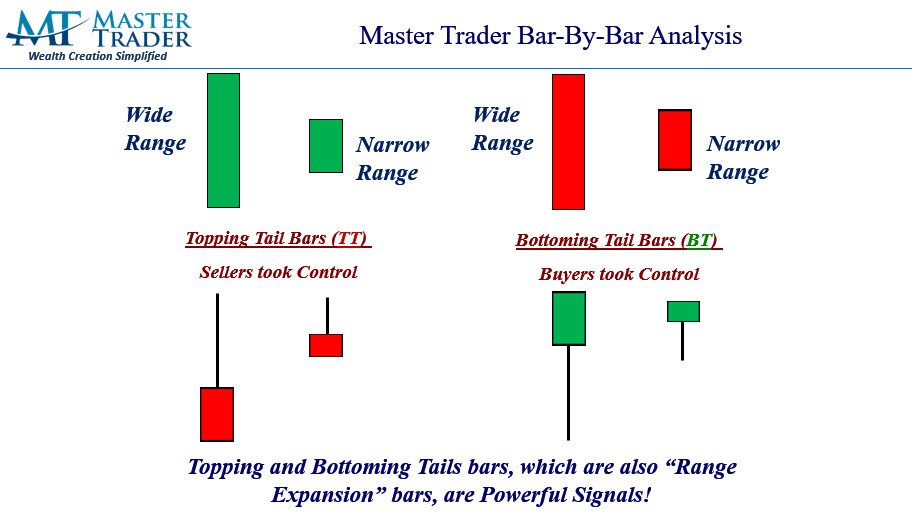
The bottom left shows you pictures of TTs. The message – as you can see with CHTR – was that Sellers took control when the candlestick completed.
Below is a 15-Min. chart of CHTR:
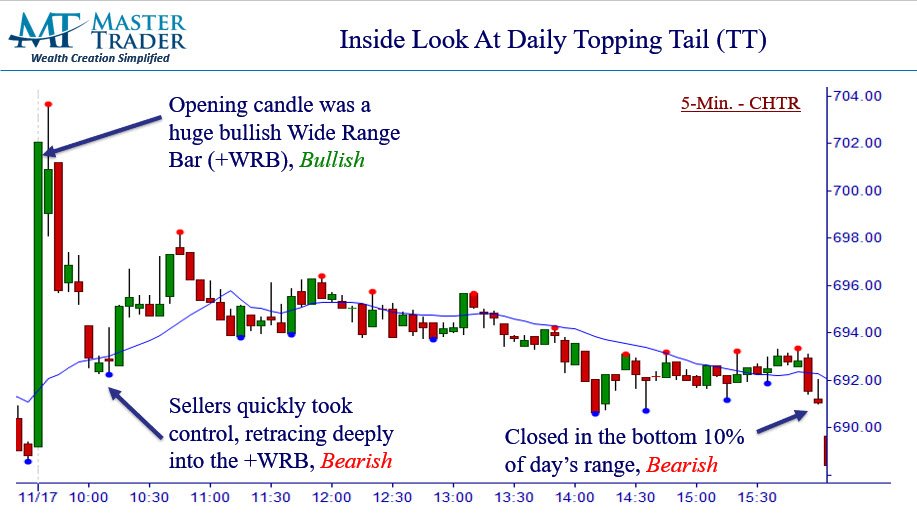
itThe notes on the chart explain why the TT was bearish, with selling picking up.
Now a TT (or BT) is not a Setup or reason to trade; rather, it’s additional information to add to the overall pattern on Multiple Time Frames (MTF).
The TT on the daily chart of CHTR was at major resistance (see all the overlapping candles to the left), so at that area sellers took control with Supply overwhelming Demand, suggesting lower prices into the Price Void.
Master Trader Swing Trading Course Teaches all MTS Concepts that create trading strategies.
We recommended to our subscribers to short the stock under the low of the TT candle.
The analysis is explained in nightly letter videos for subscribers.
You can now visualize (and go see for yourself by looking at a 15-Min. Chart) the messages of the TT on 11/22 and 11/26!
Once in a trade, we are in trade management mode.
We trail stopped after the Breakdown, booking 8.25 points or $1,650 on 200 shares.
Trade Management updates are sent intra-day by text message to subscribers.
Nice trade!
Get trades like these sent right to you and profit in the Markets!