

The most significant news of the week occurred on Friday when the Supreme Court’s decision was released striking down President Donald Trump’s use of emergency powers to impose tariffs. The betting markets had predicted a 74% chance of the same.
The Court said that Trump went too far without Congressional approval.
Trump was quick to announce new tariffs, so the issue is definitely not dead. Trump was furious with the ruling, ridiculing all who disagreed with him in his Trump fashion, and said he would introduce a new 10 - 15% global tariff under different laws.
The decision will only add uncertainty, particularly since the Court was silent on how to refund tariffs of about $129 billion illegally collected. This decision will also increase government debt, which explains the pop in Treasury yields.
Trade-sensitive stocks rallied after the Supreme Court’s ruling at 10 ET. Retail stocks (XRT) had a wild intra-day swing. Costco (COST), however, one of the leading plaintiffs seeking refunds, was down 0.5% on Friday.
In other news, the artificial intelligence (AI) and private credit fears still exist as shown by volatility in those stocks. Cybersecurity software companies fell on Friday after Anthropic introduced a new security feature into its Claude AI model. The Global X Cybersecurity ETF (BUG) fell 4.9% and closed at its lowest since November 2023.
OWL and other private credit firms also fell on credit fears.
The Fed minutes for its prior FOMC meeting were released last Wednesday, which turned more hawkish (i.e., a more restrictive monetary policy bias). Although there was broad agreement to not cut for some time, several members noted that they would have preferred language that kept rate hikes explicitly in play if inflation remains high.
The Fed said that downside risks to employment had moderated, while the risk of inflation persist. That was confirmed by Friday’s PCE (the Fed’s preferred inflation gauge) coming in at around 3%, a 0.4% increase in December.
In other economic news, U.S. GDP (the value of all goods and services produced across the economy) rose at a 1.4% seasonally and inflation adjusted annual rate in the final quarter of last year, much weaker than the 2.5% estimates.
The political drama continues with a partial government shutdown which starting on 2/14 over funding of Department of Homeland Security and ICE. Many employees, including TSA workers, are now working without pay.
Over the weekend, DHS shut down Global Entry and TSA Pre-Check at U.S. airports which will undoubtedly spread the anger amongst Americans arising out of government gridlock. A winter blizzard in the northeast will not help as thousands of flights will be cancelled or delayed.
Nevertheless, for the week, the S&P, Dow, and Nasdaq gained 1.1%, 0.3% and 1.5%, respectively. The IWM closed flat.
Other big potentially big market moving news events are NVDA’s earnings this Wednesday and Trump’s self-imposed deadline on whether or not Trump will order strikes against Iran.
Nvidia Is the Pivot Point
The market’s center of gravity this week is clear:
NVIDIA Corporation (NVDA).
NVDA is sitting near the top of its range heading into earnings.
If it breaks out:
- The Nasdaq 100 likely follows.
- Semiconductors regain leadership.
- The S&P 500 has a strong probability of testing 7000.
If it fails:
- Software weakness may accelerate.
- The recent rotation into laggards may stall.
- The S&P could rotate back toward 6800.
This is not just an earnings report. It’s a potential catalyst.
If you're not in the Green Room with us, log in to YouTube, Facebook, or Twitter to get our pre-market review at 9 AM ET. If you can't make it, you can view the recording.
This month - Use Coupon Code - Candles

The Reality: Still a Range
Technically, the broader charts do not suggest a major directional move is imminent.
Breadth continues to oscillate around zero.
Sentiment has leaned more bullish, which can provide a floor.
Internals are neutral.
That combination does not scream “breakout.” It suggests continued erratic movement.
The market has been rotating more than trending.
Under the surface, we continue to see divergence:
- Small caps and Transports have shown relative strength.
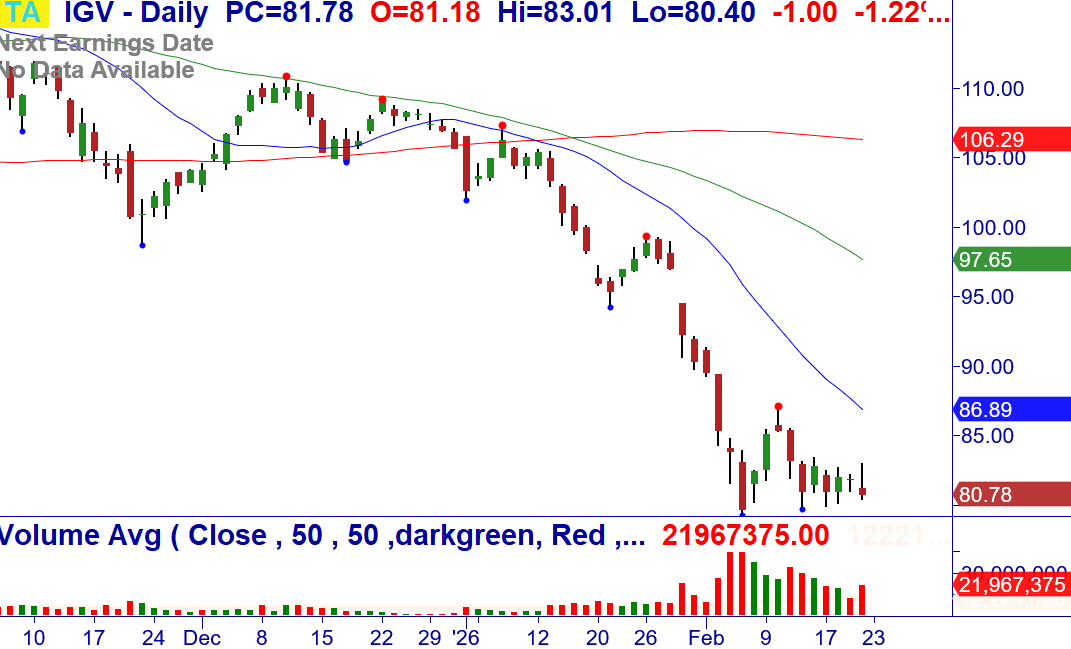
- Software and Internet groups remain in structural downtrends.
- Defensive sectors like Staples and Healthcare have attracted capital.
- Energy continues to benefit from rising crude.
Options Expiration Is Behind Us
Last week was expiration week, which often suppresses momentum as dealers hedge large open-interest strikes.
That restraint is now gone.
In the last five options expirations, the S&P 500 was higher the following week. That’s not a guarantee—but it’s a tendency worth respecting.
With hedges unwound, markets are “freed” to move.
Whether that move is up or down will likely depend on:
- Nvidia’s earnings
- Core PPI later in the week
- Ongoing rate-cut expectations
The Broader Backdrop
We’re seeing:
- GDP slowing
- Inflation sticky but not accelerating
- Fed members are divided
- Geopolitical tension influencing energy prices
Despite that, indices are holding.
That tells us institutions are not aggressively distributing stock. But they are not aggressively expanding risk either.
Nothing changes in how we operate. We will continue to trade the same price patterns, manage risk the same way, and let the market—not opinions—tell us when opportunity is present.
Be sure to log into your Member's Area to get connected to text messaging through Telegram -- it's critical to receive timely updates to new trades and trade adjustments! NOTE: New trade ideas included in these emails are not sent in Telegram when they trigger -- only subsequent needed adjustments. Alerts for Targets and Stops triggered are also not sent; it is your responsibility to set alerts and manage them following posted instructions if desired.
NOTE: Please see the document in RESOURCES entitled Master Trader Guidelines for Trading the Open and Gaps.
Because your success is vital to you – and us. Before selling options or credit spreads, we urge you to review the valuable and detailed information that we have provided for you in your Member’s Area.
Basic Money Management A quick simplified approach to calculating contract size is to simply base your contract size based on the number of shares permitted in your Trading Plan as if you were trading the stock or ETF. Simple Share Sizing = $ Risk / Stop Loss The amount of money that you are willing to risk – divided by – the stop loss amount.
For Example, $100 / .20 = 500 shares. Credit Spread example, if your Trading Plan allowed you to trade 543 shares of AAPL based on the stop loss, then simply round down to the nearest hundred and short an equivalent number of contracts of the option. Since 1 contract represents 100 shares of the underlying, this would be five (5) contracts.
Money Management for Trading and Investing
Proper money management for investing and Trading starts with position-sizing based on the amount of money you are willing to risk on a signal trade.
CLICK HERE to review these Master Trader Guidelines and Basic Money Management and Position Sizing Table.
NEW OPTIONS TRADING IDEAS
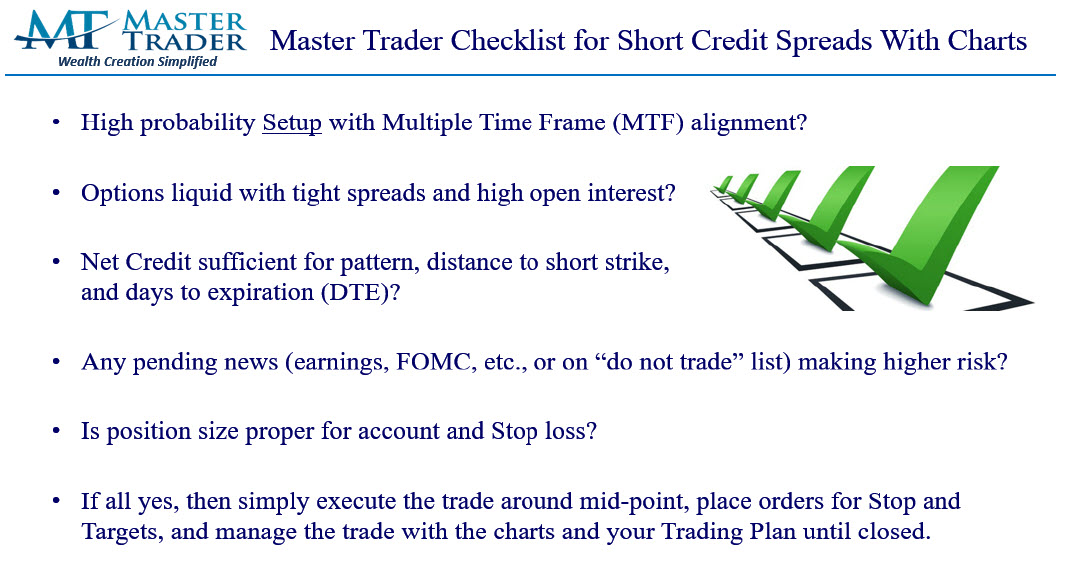
Here's our Checklist for shorting options/spreads using MTS. Spreads have unfortunately been wider than normal recently which is why the number of trades recommended in this letter has been fewer than normal. Additionally, when the VIX is low, the premium received has not been attractive. Most of you also subscribe to our Advisory Swing and Options Letter and, as you can see, we have many Directional ideas.
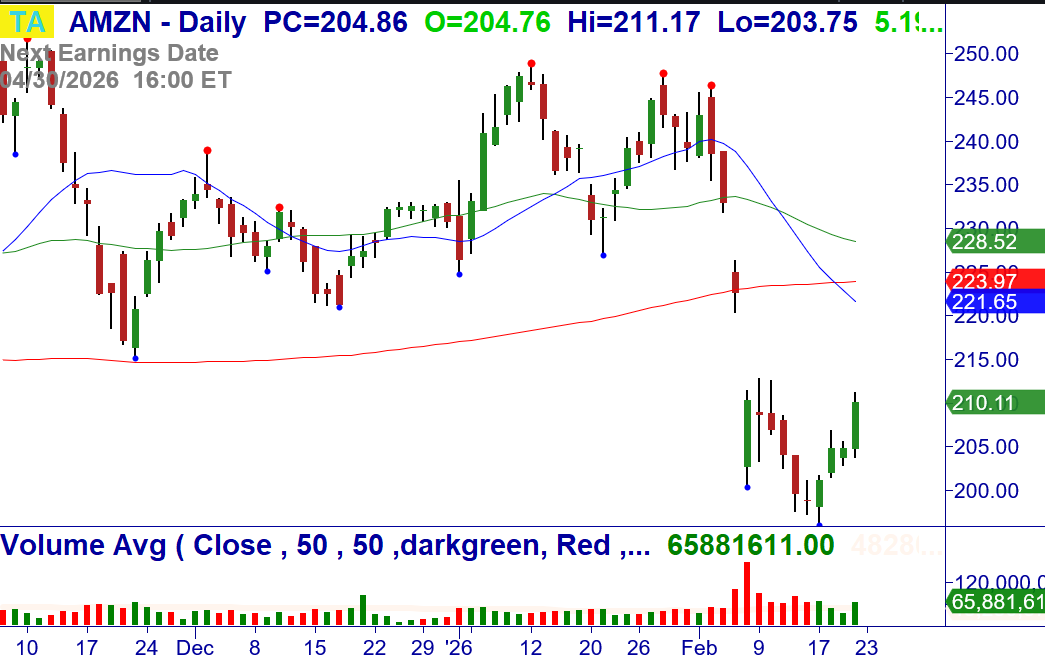
2/23: AMZN – Over $210.11, consider shorting Feb (2/27) $202.5/197.5 bull put credit spread for a limit of $.61/share (closed at $.65/share). Hourly Breakout. Stop $202.48 (however, stop out of position if the “debit/cost to close” the spread reaches 2x premium received, which would be $1.22/share in this case, which means that you are not risking more than 1:1).
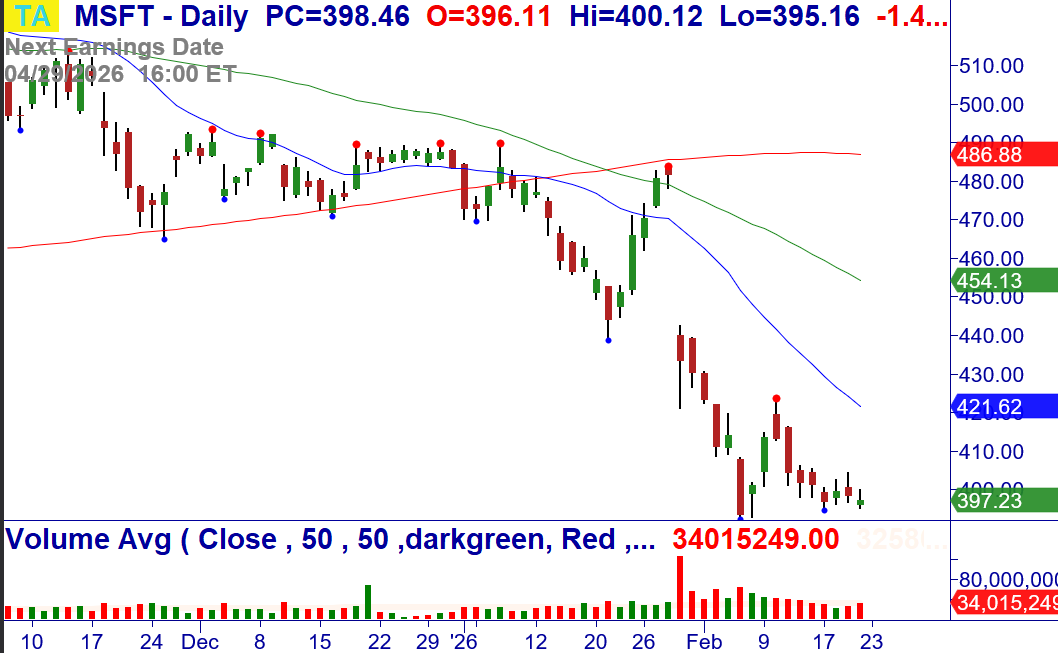
2/23: MSFT – Over $406.20, consider shorting Feb (2/27) $390/385 bull put credit spread for a limit of $.75/share (closed at $1.14/share). W-Bottom reversal (if triggered). Stop $391.88 (however, stop out of position if the “debit/cost to close” the spread reaches 2x premium received, which would be $1.50/share in this case, which means that you are not risking more than 1:1).
Dan will be presenting this Thursday, February 26th, at 2:15 ET, at Traders Corner’s Stock & Options Investor’s Summit, where he will teach you how to trade stocks and options on a Simple, Powerful “Igniting Pattern.” Register- CLICK HERE
NOTE: We found many compelling patterns for directional trades which are contained in our Advisory Swing and Options Trader, see below. All directional patterns are credit spread CANDIDATES provided they are liquid and have attractive net credit for the DTE. In this case, every one of these unfortunately have illiquid options, preventing us from presenting credit spread ideas.
As you know, by selling spreads on stocks and ETFs where MTS indicates price is unlikely to go, we become the “smart money,” getting paid to take calculated, well-defined risk.
Check out the blog article with more information and monthly results, CLICK HERE
Professional consistency, short-duration trades, and risk-controlled income — that’s what defines the Master Trader approach.
Master Trader and You Building Your Financial Future Together!
Happy trading! If you have any questions or comments, please e-mail Greg Capra at Greg@mastertrader.com or Dan Gibby at Dan@mastertrader.com
All the best,
Greg Capra Managing Director of Master Trader
Dan Gibby Chief Options Strategist
NOTE: Master Trader will show the opening and closing prices of all stock and options trades. We recommend that all traders and investors use proper share sizing for positions and money management. However, we cannot recommend what that is for your particular trading style, risk tolerance, or account balance. We urge you to calculate your own share/position size based on your individualized risk parameters, Trading Plan, and familiarity with the proposed trade strategy and risk. Advanced Management Strategies (AMS) covers in detail foundation and advanced position and money management.
NOTE: Master Trader and its representatives may have existing positions in actual or other trade recommendations before or after suggested herein. Additionally, we may manage them differently for internal purposes based on different risk parameters than noted herein. All trade ideas and content are for informational and educational purposes only. It is not, nor is it intended to be, trading or investment advice or a recommendation that any security, option, or investment strategy is suitable for any person. Trading securities can involve high risk and the loss of any funds. Significant gaps or volatility can increase these losses, particularly for short option strategies. Investment or trading information provided may not be appropriate for all investors, and is provided without respect to individual financial sophistication, financial situation, investing time horizon or risk tolerance. Supporting documentation for any claims (including claims made on behalf of options programs), comparison, statistics, or other technical data, if applicable, will be supplied upon request. Master Trader Consulting, Inc. is not a licensed financial advisor, registered investment advisor, or a registered broker-dealer. Options, futures, and futures options are not suitable for all investors.
