How bar-by-bar analysis and position sizing turn an imperfect setup into a defined plan
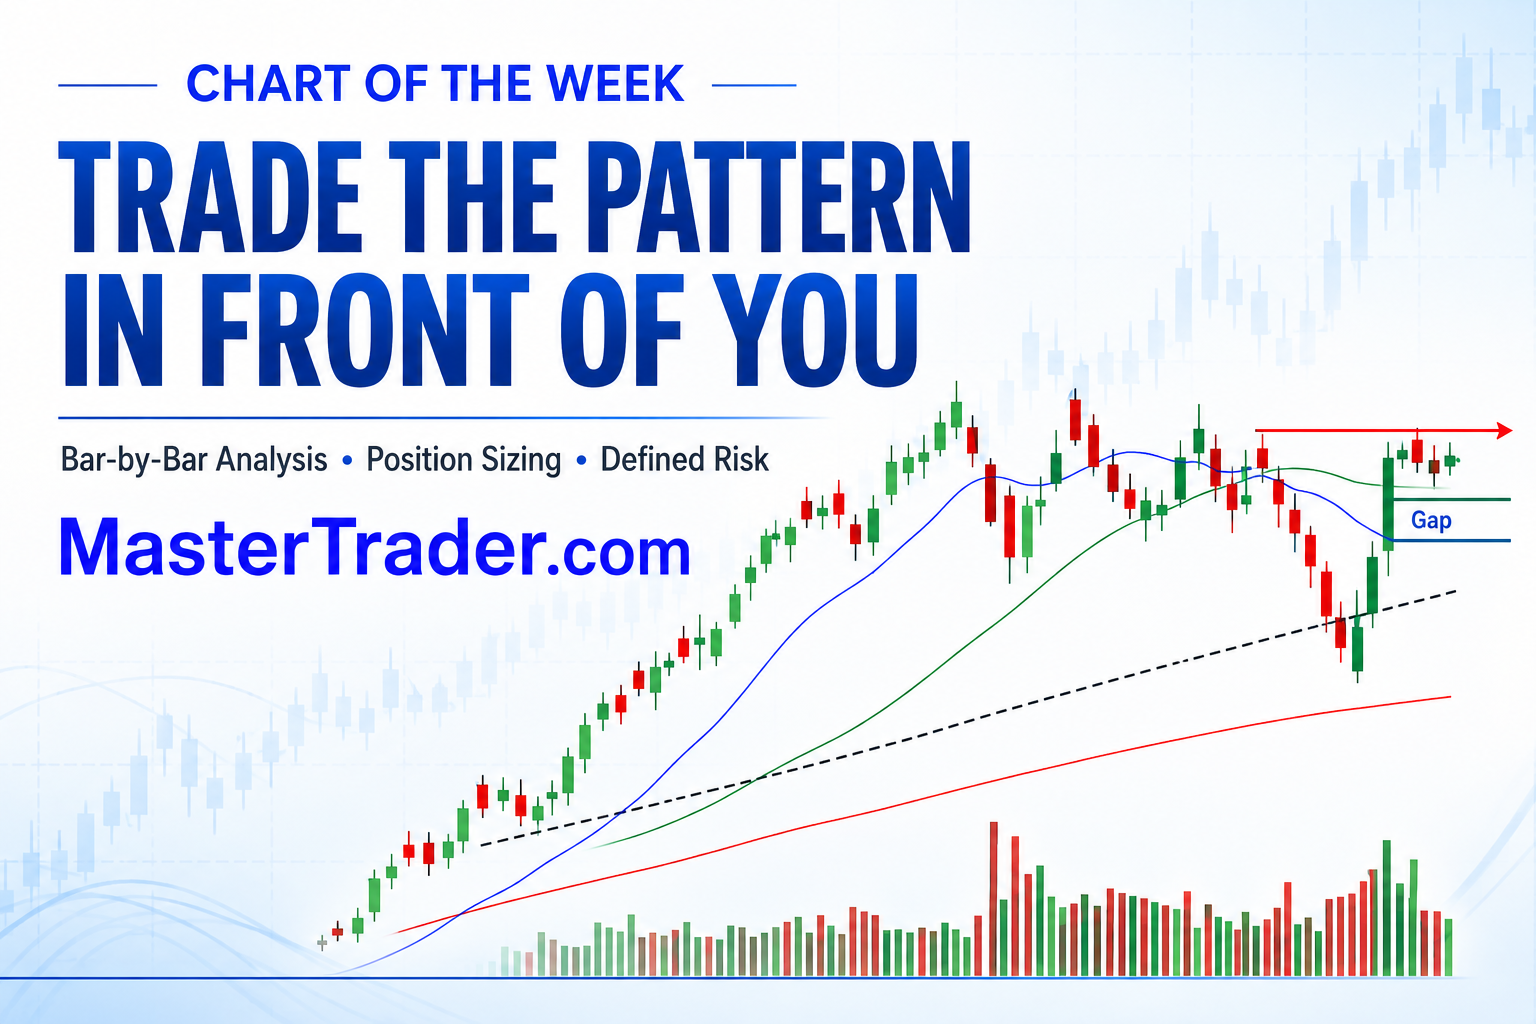
Textbook setups do not appear on schedule. The real edge is knowing how to read the price action that is developing, define the conditions for taking a trade, and control risk when the pattern is less than perfect.
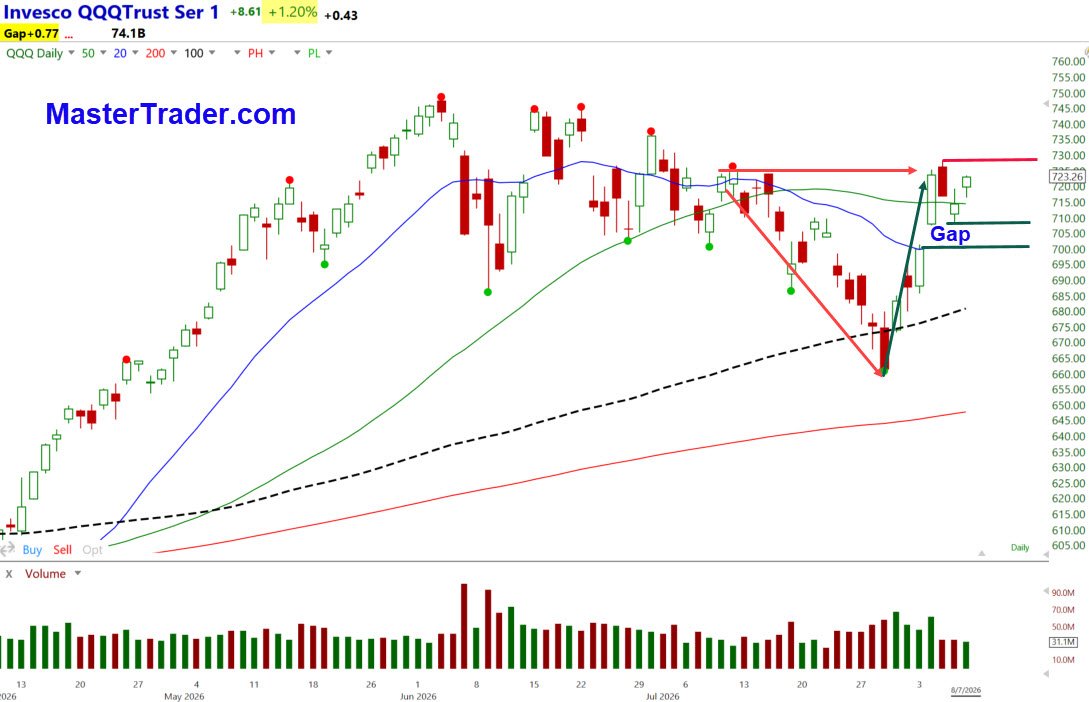
The QQQ ETF chart below provides a timely example. The reversal is bullish, but the location is not ideal: prices have rallied directly into resistance and prior congestion. That does not eliminate the opportunity. It means the trade requires a plan—not a prediction.
What the Price Action Is Telling Us
Before last week, QQQ was trending lower and had broken below the rising 100-period moving average (black line). After a brief stabilization, economic news triggered aggressive buying and prices reversed sharply higher.
The advance retraced 100% of the prior downswing—from Pivot High to Pivot Low and back to the prior high. That is significant. Buyers erased the decline and demonstrated that sellers could not maintain control. It is bullish evidence, although it is not a guarantee that prices will move straight through resistance.
Read the Last Four Bars as a Group
At resistance, QQQ moved sideways for four sessions. Read together, those bars show:
The result is a well-developed trading range near the high of the reversal. Holding near resistance is constructive, but the congestion to the left can still produce erratic movement. We trade what is there—not what we wish were there.
Two Scenarios—One Disciplined Process
The Stop Determines the Position Size
The decision is not simply whether to go “all in” or take a half position. The first decision is how much capital you are willing to risk if the setup fails. The chart determines the logical stop; the distance from entry to that stop determines the number of shares.
A wider stop requires fewer shares. A tighter, technically valid stop can support more shares. A partial entry may also preserve buying power for a later confirmation, but total risk should remain within the original plan. This is the difference between taking a trade and managing one professionally.
MTS Outlook: The structure suggests that QQQ has the potential to make a new high. However, the resistance and congestion to the left may require monitoring, staged entries, and management adjustments along the way. The objective is not to predict a straight-line move—it is to respond correctly as each new bar adds information.
Learn to Make These Decisions for Yourself
Master Trader education is designed to develop self-reliant traders who can interpret price structure, define risk, and act without depending on indicators, predictions, or the opinions of others.
Learn the method. Apply the process. Become a self-reliant Master Trader.
MasterTrader.com
If you have found this post helpful, Share it Forward with other Traders. All the best Greg Capra