
Over the past several weeks, the S&P 500 delivered a powerful reminder of how markets actually turn—not from headlines, but from subtle shifts in internal behavior before prices follow.
What stood out in the chart below wasn’t just the decline… it was what's happening beneath the surface.
As the S&P 500 continued to press lower and make new lows, the breadth internals (advancing minus declining stocks) began to improve. That type of divergence matters. It indicates that, while the index is still falling, selling pressure is no longer broad-based. Instead, capital is quietly rotating—institutions are beginning to accumulate select stocks and sectors.
That’s the first clue.
At the same time, both Total and Equity Put-Call Ratios pushed to extremes. These sentiment gauges reflect positioning—when traders are heavily leaning bearish, it often signals the move is closer to exhaustion than continuation.
When breadth improvement and sentiment extremes align, it creates a high-probability “heads-up” that a turning point is near.
That’s exactly what we saw and reported in the Advisory Swing and Options Trader Letter.
But internals alone are not a trigger—they’re a setup. The confirmation always comes from price.
S&P 500 and Internal Market Gauges
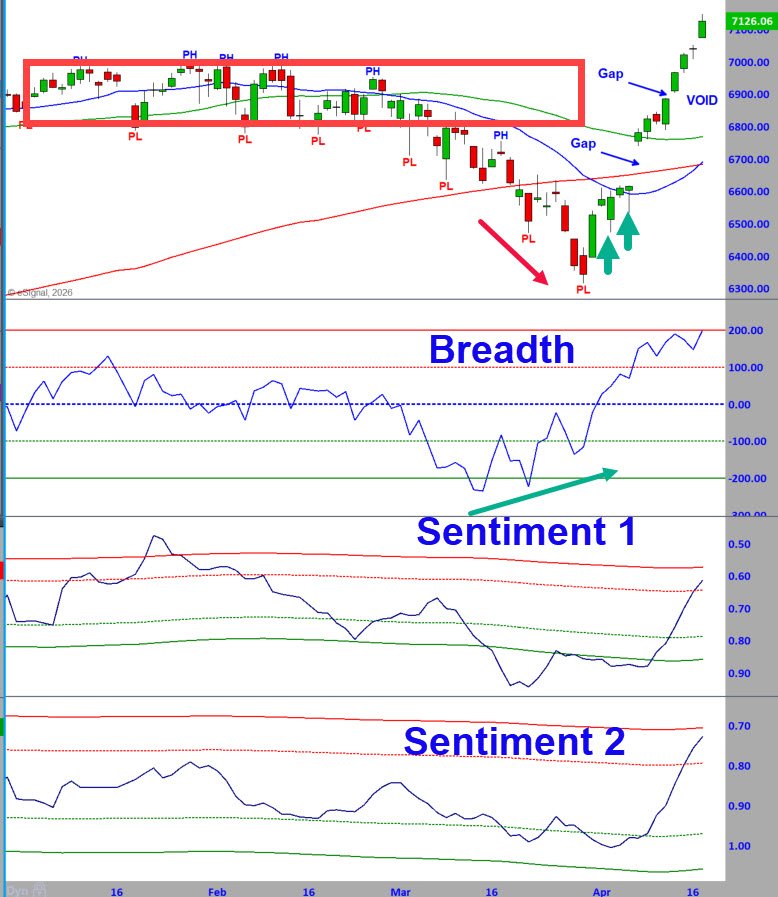
At the beginning of April, price delivered that confirmation. A gap-down that was immediately bought (first green arrow) showed demand stepping in aggressively. That was followed by a bottoming tail bar (second green arrow), signaling rejection of lower prices. Through the lens of Bar-by-Bar analysis, that was enough. The market told us buyers were in control.
From there, things accelerated quickly.
What no one could predict was the catalyst—a news-driven gap higher the following day tied to geopolitical developments. That launched the market into a vertical move, with buyers overwhelming the significant supply that had built over the prior six-month consolidation.
Importantly, there was no clean retracement entry after that. Price simply continued higher, fueled by short covering and FOMO, as defensively positioned traders were forced back into the market.
The result?
A historic move—13% in the S&P 500 and even more in the Nasdaq in just days—coming directly after a prolonged consolidation.
Moves like that don’t happen in a vacuum. They tend to exhaust themselves.
From a technical perspective, this is still a bullish advance. Internals confirmed the turn, and price validated it. But the velocity of the move has now pushed markets into an extended condition, where the probability of corrective price action increases.
Now, new geopolitical headlines have entered the picture again. But this is where discipline matters.
We don’t predict based on news—we observe how markets react to it.
If this market is truly strong, pullbacks will be supported. If sentiment shifts meaningfully, we’ll see it in price behavior first. That’s the edge—letting price and internals guide decisions, not headlines.
Right now, the bias remains with buyers—but only on a pullback and only with confirmation.
That’s the difference between reacting emotionally and operating with a method.
The takeaway is simple:
Internals gave the warning.
Price gave the signal.
Now we manage risk and wait for the next opportunity—on our terms.
