Breakouts and Breakdowns come in different shapes and sizes, and many are afraid of trading them due to uncertainty and fear of failure, stemming from past failures.
In this one daily chart of REGN, there are three compelling Breakouts in a short time!
It’s time to transform hesitation into confidence. Breakouts and Breakdowns are among the most powerful and profitable setups in trading—if you know how to spot the right ones and execute like a pro.
Discover how we consistently turn these Swing Trading setups into high-probability money-makers.
Real Setup, Real Profit: See the Breakouts That Paid Big!
Master Trader Breakout at the 20-MA
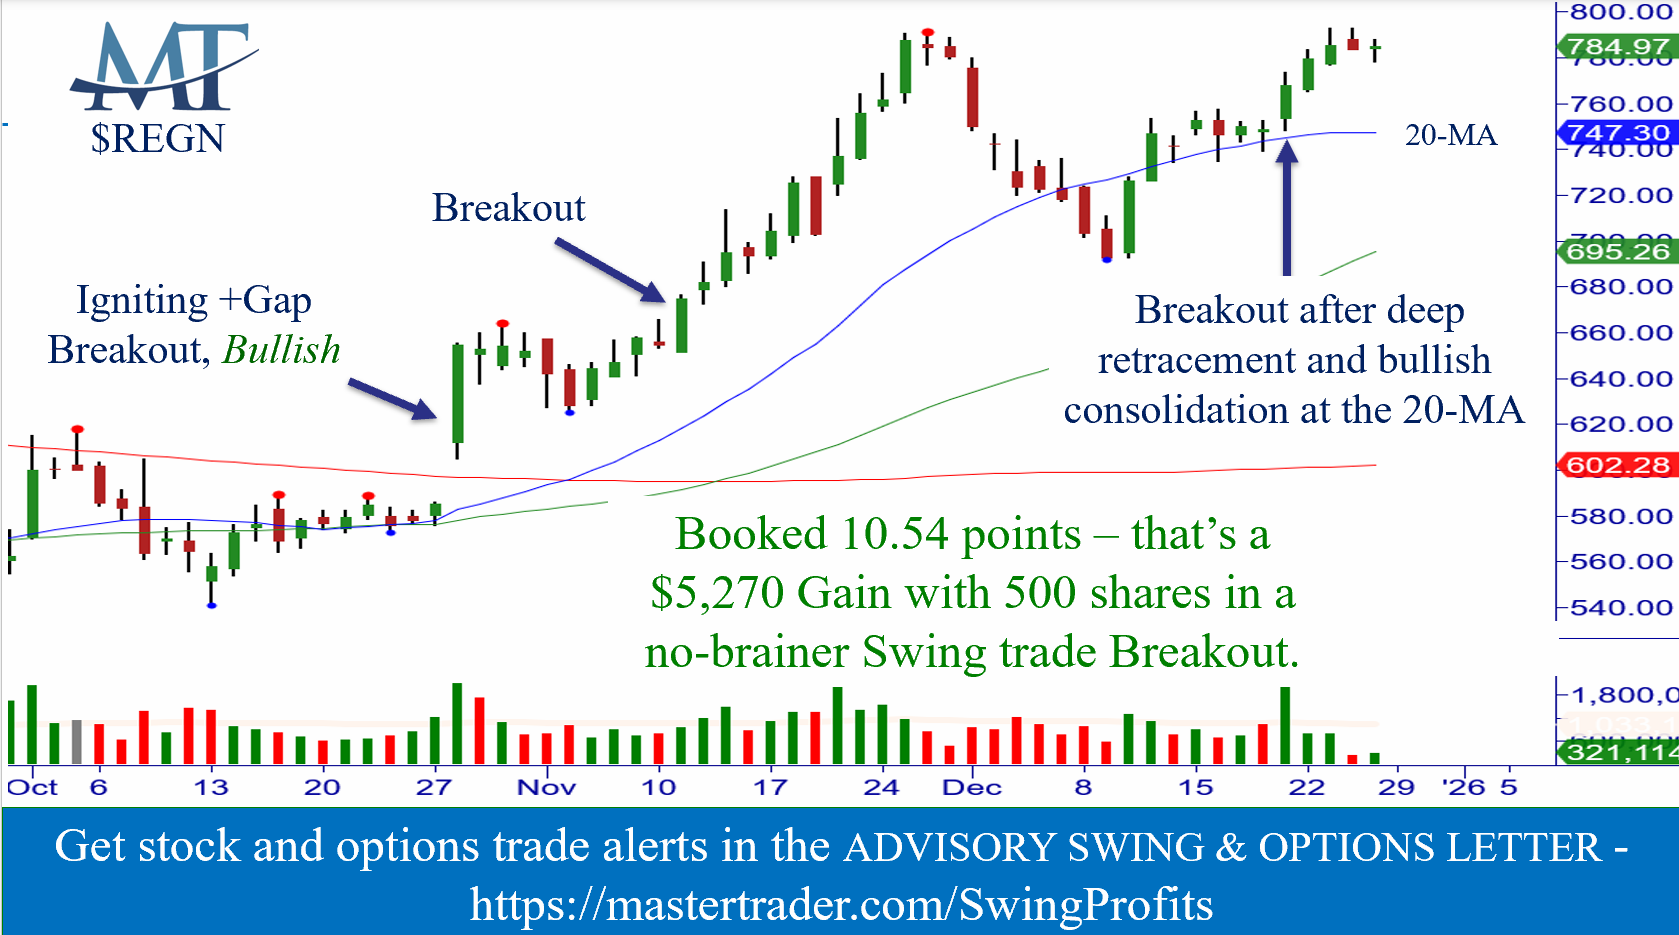
Imagine locking in a winning trade like this—just as our subscribers did, and why it was a no-brainer setup.
What happened:
On 10/28, REGN had what we call a Professional Gap, one igniting a new bullish move. It came from a bullish consolidation with a flat 20- and 50-MA, gapping over resistance and also having bullish weekly and monthly charts.
Buying the open was a great longer-term entry for a big move, closing with a bullish Wide Range Bar (+WRB), giving the confidence that it should move higher.
It then consolidated for over two weeks, staying in the upper half of the +WRB, bullish price action.
On 11/11, it closed with a +WRB Breakout bar from this bullish consolidation. That was a secondary (or new) entry with a Void to the left (i.e., insignificant resistance).
You can see that Breakout produced amazing profits – which we participated in also.
After a nice momentum move, it was not unexpected that it retraced deeply in early December.
On December 12-13, it moved up sharply with two +WRBs, a sign of strength, but no trade setup without a consolidation or continuation pattern.
We got the latter: bullish consolidation at the 20-MA.
We recommended buying the stock where shown, which was a continuation Breakout.
The “Tell” was the five consolidation candles within the range of the second +WRB. This is a bullish pause (consolidation) from the two +WRBs.
The patterns using Master Trader Strategies (MTS) were very high-probability setups. Learn how to use MTS to time your entries to profit from selling options with charts with incredible accuracy. To learn our technical approach to trading anything that moves, CLICK HERE
Trade Execution:
We alerted our subscribers to buy the stock on 12/19 where shown (call options were too illiquid), with a protective stop over the prior day’s TT high. Once in the trade, we used bar-by-bar analysis to manage risk and maximize gains.
Profits That Speak for Themselves!
This trade was an easy-to-manage swing trade, generating 10.54 points – that’s a $5,270 Gain with 500 shares in a no-brainer Swing trade Breakout.
The Master Trader Edge: Learn, Trade, Profit! At Master Trader, we don’t leave success to chance. We teach high-probability setups that align multiple MTS concepts, increasing the odds of winning trades. Our strategies are rooted in technical analysis and price patterns, revealing trader sentiment and the flow of money.
Master Trader Strategies (MTS) work in all market conditions, giving you an advantage whether you're trading stocks, ETFs, or options.
Join us today and start making consistent profits with confidence!
Master the Market. Trade Like a Pro. Profit Like a Master!
Put simply, this was a textbook alignment of technical patterns + macro context—the kind of combination that stacks the odds in your favor.
But if you want to learn the how and when—the exact entries, exits, and trade management strategies that turn opportunities into consistent profits for stocks and ETFs—then our Master Trader Course – Swing Trading Course is where you’ll get the full blueprint.
At Master Trader, we also teach how to buy and sell Options with our technical based approach. To learn these strategies, CLICK HERE.
Here is an Example of a recent Income Trade where we sold a 0 DTE call spread on an excessive igniting gap on earnings where we keep the full premium sold as long as the stock closes below the short strike for a few hours.
Why Traders Love Selling Options
At Master Trader, we use an objective, rule-based approach to trading stocks, futures, cryptocurrencies, options – and, yes, in trading options.
One of our favorite income strategies is selling options and credit spreads around technical turning points. When you sell a put, you receive premium in exchange for the obligation to buy the stock (if the put buyer wants you to) on or before expiration.
We profit from time decay, when the underlying stock or ETF moves away from the reversal area, and volatility contraction. Our approach masters this.
Read about the Weekly Options Trader letter which sells options/spreads for weekly Income that expire in 10 days or less around Master Trader technical turning points, CLICK HERE.
The Setup (What & Why):
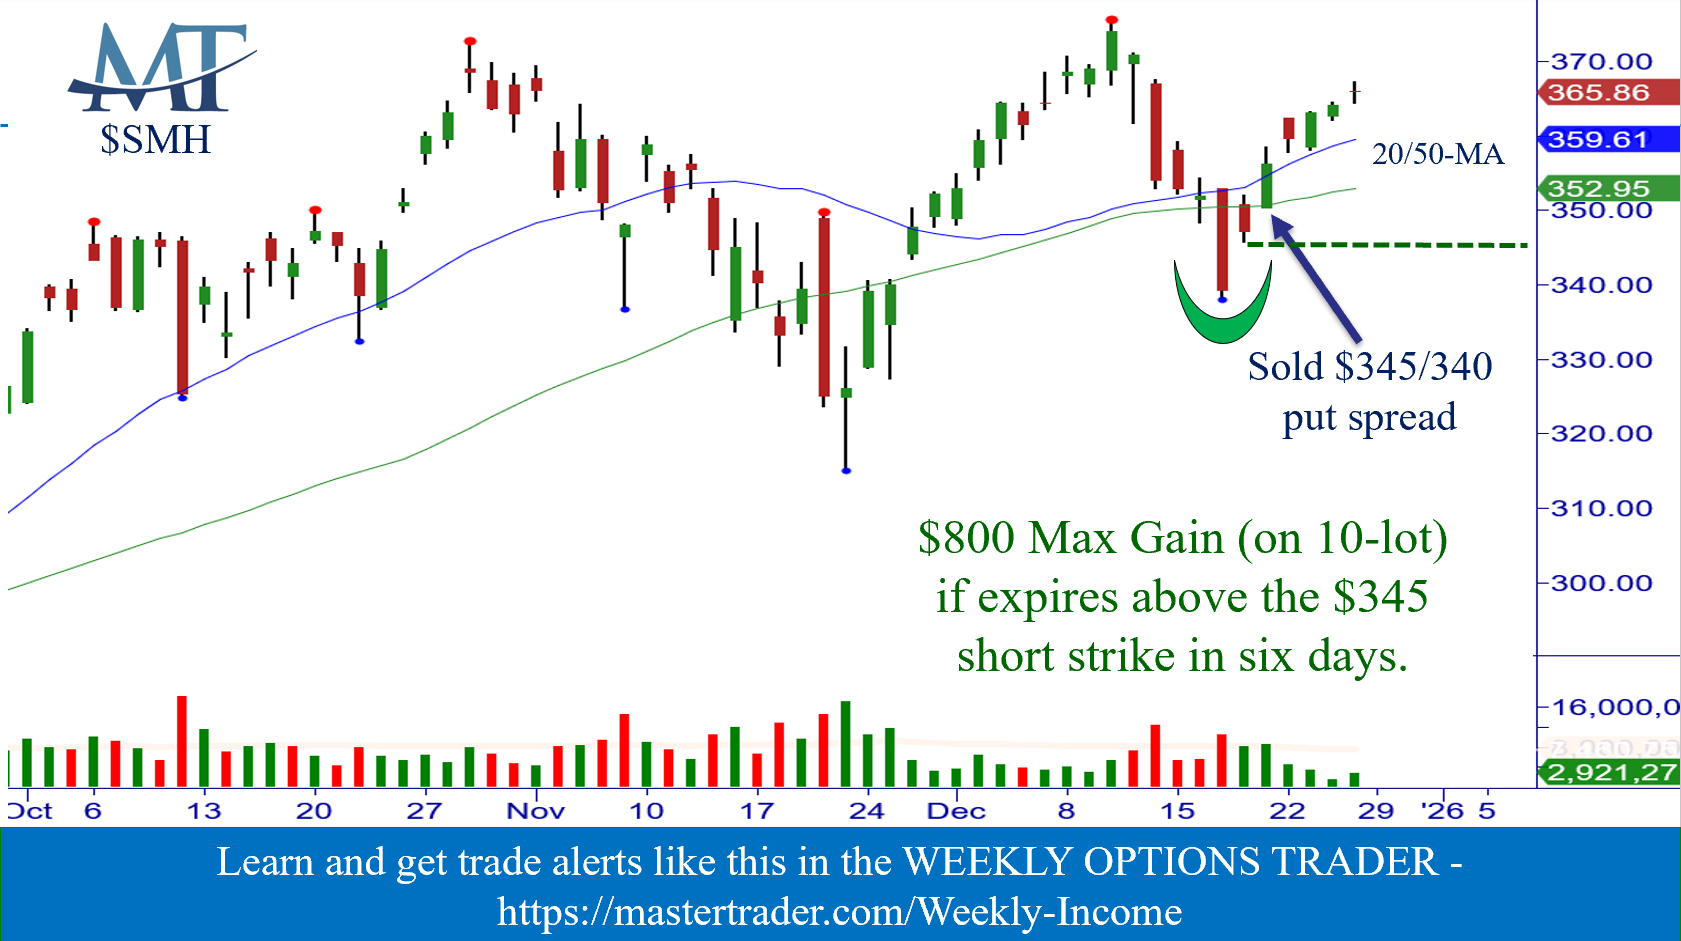
From late November through mid-December, SMH had a robust rally from the prior low and making a new closing high, above the rising 20- and 50-MA.
After a move like that, our desire is to monitor for either a consolidation or continuation pattern, or pullback and reversal on support (i.e., a Buy Setup).
Buy Setups and reversals on Support after Breakouts are high-probability Setups. As with all Buy Setups, we need a Price Void and confident “turn” (reversal).
Here we have both.
The “turn” with SMH was key!
On 12/17, it closed with a bearish Wide Range Bar (-WRB), suggesting lower prices. No reasonable technician would think that this bar would be negated in 1-2 days (a Shock pattern).
The next day, SMH had a very bullish Gap almost 90% into the range of the -WRB, a sign of significant strength, and closed in the upper 80%. If it can then trade over the high of these two bars, that’s a bullish reversal to trigger our Buy Setup!
Over the high where shown, although you could have also bought stock or call options as a Directional trade because of the nice Void, we recommended selling a 4 DTE $345/340 Put Spread for $.80/share, a no-brainer setup with high odds of success.
Selling a $345 strike put obligates you to buy the stock at that strike price (if the put buyer wants you to) in exchange for the premium received. We typically recommend selling credit spreads as in this case (instead of naked) to lower buying power maintenance and reduce the potential loss in the event of a stop out.
As long as SMH goes up or sideways into expiration, the put spread seller keeps the full premium as profit. The breakeven point is the $345 short put minus the $.80/share premium received, or $344.20. Our protective stop was under support.
The Outcome:
The Buy Setup triggered and worked as intended as it moved higher, which quickly caused the premium sold to quickly erode.
We recommended closing half lots each for an average exit of $.12/share to avoid further risk, earning $.68/share.
Example Profit: Selling 10 contracts (1 contract = 100 shares) of the recommended put spread could have produced a quick $680 gain in three days for simply calling a short-term bottom using MTS.
Reviews like this show you what to look for and why these setups work.
But if you want to learn the how and when—the exact option strategies, strike selection, and trade management rules that produce these kinds of results—you’ll get it step by step in our Master Trader Credit Spread or Directional Options Courses.
Read about the Weekly Options Trader letter which sells options/spreads for weekly Income that expire in 10 days or less around Master Trader technical turning points, CLICK HERE.
Don’t Wait to Make Money. The Next compelling Setup is Coming—Will You Be Ready?
Imagine turning small opportunities into consistent wins, with the proper knowledge and strategies.
Sign up today and let’s trade the setups that count!
The Master Trader Edge: Proven Strategies for High-Probability Trade ideas so that you can take the guesswork out of trading.
Your Roadmap to Consistent Profits Starts Here.