
We don’t have any clear patterns across the broader markets, even looking at multiple time frames.
The broader markets’ ability to get back up to the top of the range is a positive, but so far we do not have any signal that the markets are ready to continue higher.
The markets are “on their own” so to speak as to finding a direction or the lack thereof.
The drop that occurred on Friday afternoon that had little to no ability to retrace higher created a bearish candle in most markets and sectors.
While that single candle suggests prices can move lower, the majority of daily trends are consolidating within their up trends at respective resistance areas.
For the moment, it doesn’t support anything more than a neutral bias starting out this week.
Below is a daily chart of Twitter, Inc. (TWTR).

Trade: Over $43.84 consider shorting Sep. (9/27) $42.5/39.5 bull put credit spread (5 DTE) for mid-point but limit of $.27/share (closed at $.37/share).
Technical Setup: Breakout from consolidation on support and r20-MA (and Topping Tail ignored if triggered) daily.
Option Strategy: Bull Put Credit Spread (BPCS).
Stop Loss: $42.78.
Below is a daily chart of Beyond Meat, Inc. (BYND).
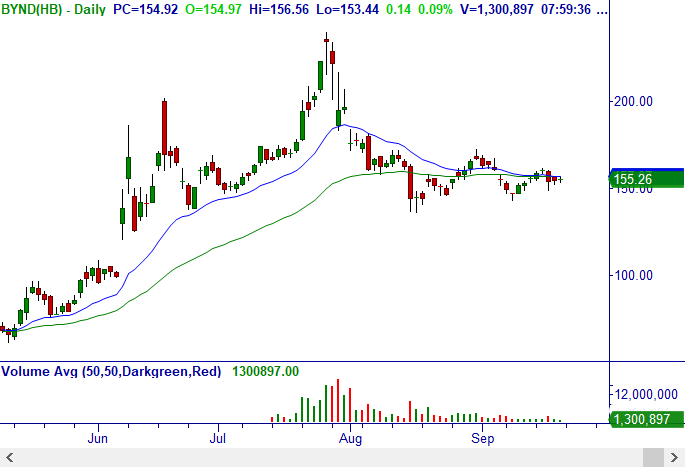
Trade: Over $161.50, consider shorting Sep. (9/27) $148/143 bull put credit spread (5 DTE) for mid-point but limit of $.85/share (closed at $1.10/share, CAREFUL – spready so higher risk).
Technical Setup: Breakout from consolidation on support with flat 2/50-MA daily, suggesting an expansion in volatility up or down from the tight range. Note that if it breaks down first, we will consider a bear call credit spread instead for a possible bearish head and shoulders break on the monthly.
Option Strategy: Bull Put Credit Spread (BPCS).
Stop Loss: $148.78.
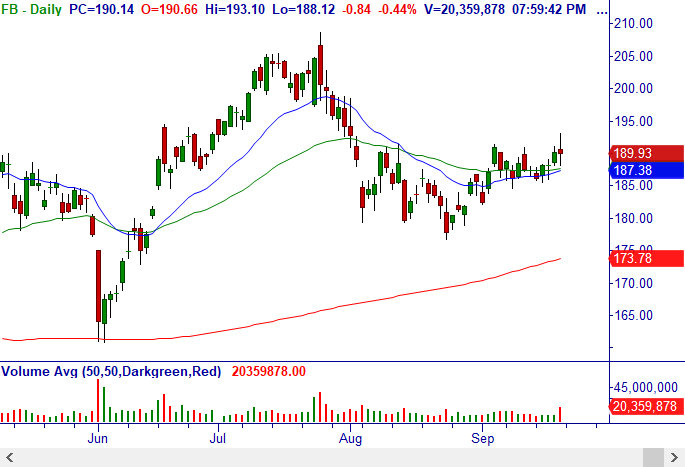
FB – We are watching for BPCS over Friday’s high as Breakout, will advise.
VIDEO ON OPEN TRADES AND ADJUSTMENTS (NOTE: Also in Member’s Area in Open/Closed Trade Sheet)
[s3mv fileName=’Dan+-+Letter+Videos/weekly+options+update+video+190921.mp4′ fileType=’video’ source=’s3′ width=’800′ height=’450′ splashImage=” preLoad=’Y’ autoPlay=’N’ belowVideoHTML=” cuePoint=” redirectURL=” pauseAtCuePoint=’N’ isSecure=’Y’ bucketname=”]
Options Strategies Definitions Videos Here
Please read the information on Money Management below
Learn how Master Trader Technical Strategies – MTS and MTS with Options Strategies can make consistent money.
Click Here – to Access the Options Credit Spread Program that puts you on the Master Trader Income Path.
Click Here to Learn The Master Trader Swing Trading Strategies to profits over a few days to weeks.
To invest in ETFs for weeks to months to generate wealth with compelling patterns using MTS, see Master Trader ETF Investment Trader. Click HERE
Master Trader Weekly Lessons for Investors and Traders will build your investing and trading knowledge and confidence to profit in all markets! Each lesson can change your financial future — only $11.97/month! Click HERE
Because your success is vital to you – and us.
Before selling options or credit spreads, we urge you to review the valuable and detailed information that we have provided for you in your Member’s Area.
If You’re in a Rush to Start
A quick simplified approach to calculating contract size is to simply base your contract size based on the number of shares permitted in your Trading Plan as if you were trading the stock or ETF.
Simple Share Sizing = $ Risk / Stop Loss
The amount of money that you are willing to risk – divided by – the stop loss amount. For example, $100 / .20 = 500 shares.
Credit Spread example, if your Trading Plan allowed you to trade 543 shares of AAPL based on the stop loss, then simply round down to the nearest hundred and short an equivalent number of contracts of the option.
Since 1 contract represents 100 shares of the underlying, this would be five (5) contracts.
Master Trader and You Building Your Financial Future Together!
Happy trading! If you have any questions or comments, please e-mail Greg Capra at Greg@mastertrader.com or Dan Gibby at Dan@mastertrader.com
All the best,
Greg Capra
Managing Director of Master Trader
Dan Gibby
Chief Options Strategist
NOTE: Master Trader will show opening and closing prices of all stock and options trades. We recommend that all traders and investors use proper share sizing for positions and money management. However, we cannot recommend what that is for your particular trading style, risk tolerance, or account balance.
We urge you to calculate your own share/position size based on your individualized risk parameters, Trading Plan, and familiarity with the proposed trade strategy and risk. Advanced Management Strategies (AMS) covers in detail foundational and advanced position and money management.
NOTE: Master Trader and its representatives may have existing positions in actual or other trade recommendations before or after suggested herein. Additionally, we may manage them differently for internal purposes based on different risk parameters than noted herein.
All trade ideas and content are for informational and educational purposes only. It is not, nor is it intended to be, trading or investment advice or a recommendation that any security, option or investment strategy is suitable for any person. Trading securities can involve high risk and the loss of any funds. Investment or trading information provided may not be appropriate for all investors, and is provided without respect to individual financial sophistication, financial situation, investing time horizon or risk tolerance. Supporting documentation for any claims (including claims made on behalf of options programs), comparison, statistics, or other technical data, if applicable, will be supplied upon request. Master Trader Consulting, Inc. is not a licensed financial advisor, registered investment advisor, or a registered broker-dealer. Options, futures and futures options are not suitable for all investors. Prior to trading securities products, please read the Characteristics and Risks of Standardize Options and the Risk Disclosure for Futures and Options found here: CLICK HERE.
