

The most significant news of the week was the continued strikes by the U.S. and Israel on Iran, the resultant spike in oil prices, rising bond yields, and the poor jobs report on Friday, driving markets lower.
Crude had its largest one-week gains on record and closed over $90.
The Dow, S&P 500, and Nasdaq fell 3%, 2% and 1.2%, respectively, for the week. IWM also closed weak and looks lower.
Friday’s employment numbers showed a loss of 92,000 jobs in February, much worse than the gain of 50,000 jobs expected, and well below January’s gain of 126,000 jobs.
This shows that the job market continues to struggle and the unemployment rate rose to 4.4%, creating a dilemma for the Fed’s in having to choose between fighting inflation (which will be worse with the oil spike) and a weakening jobs market.
In response, Chicago Fed President Austan Goolsbee said that “Let’s not overreact to one month’s numbers, but an environment in which inflation is rising, and the unemployment rate is also rising, that’s not any fun for the central bank.”.
Energy prices are one of the fastest channels of transmission into the broader economy. When crude rises sharply, it quickly translates into higher fuel costs and transportation expenses, and eventually into inflationary pressure throughout the economy.
The market immediately began discounting those implications.
One of the clearest reactions was in the Dow Jones Transportation Index, which dropped nearly 8% for the week and closed below its rising 50-day moving average. Transportation stocks are highly sensitive to fuel costs and economic expectations, so the sharp decline reflected both.
However, the weakness was not isolated to transportation.
Selling pressure spread broadly across multiple sectors. The only area showing consistent strength was energy.
The sharp rise in interest rates added another layer of concern. When bond yields and energy prices rise simultaneously, markets begin to fear inflation persistence and the possibility that central banks may not have as much policy flexibility as investors had hoped.
That combination of higher rates and higher energy costs is precisely the environment that often brings the word stagflation back into the conversation.
Markets began to price in that possibility.
The Materials sector also experienced broad selling pressure, which is often associated with concerns about slowing economic growth. When industrial materials decline alongside transportation and rising energy costs, it reinforces the perception that economic conditions could tighten.
What we do know with certainty after last week is that the multi-month trading range in the S&P 500 has been broken.
For months, the market oscillated between well-defined support and resistance levels. Last week, prices closed below multiple Pivot Lows, which signals that the prior equilibrium between buyers and sellers has shifted.
From a technical standpoint, that violation signals the beginning of a new downtrend phase, at least in the short- to intermediate-term.
The political drama continues with a partial government shutdown which starting on 2/14 over funding of Department of Homeland Security and ICE. Many employees, including TSA workers, are now working without pay.
Our internal market gauges are beginning to approach levels that historically occur near market lows. However, the way they reached those levels matters.
Breadth collapsed extremely quickly last week.
Rather than deteriorating gradually over several weeks — which is typical of a more orderly correction — breadth moved from neutral conditions directly to near-extreme readings in one sharp movement.
That type of movement often suggests further downside still ahead.
We saw the opposite behavior in November of last year, when breadth surged rapidly from deeply oversold levels to strong positive readings. That sudden shift communicated strong demand, and markets subsequently moved higher.
The current situation is different.
Breadth did not fall from a strong bullish condition into an extreme low. Instead, it moved from neutral directly to extreme, which historically means the market often needs to probe lower levels before a durable bottom forms.
In practical terms, this suggests that rallies are likely to be sold, at least for now.
There were, however, a few constructive developments beneath the surface last week.
Several of the most beaten-down sectors — including Software, Staffing & Outsourcing, and Information Technology — showed relative strength despite the broader market weakness.
When the weakest sectors begin to stabilize while markets are declining, it often signals that institutions are selectively accumulating bargains.
That does not mean a bottom is in place yet.
But if the broader market continues lower and eventually retests the recent lows, those sectors could become the foundation for intermediate-term advances.
Another factor traders should keep in mind is that sharp declines often attract aggressive short-term buying.
Fast drops tend to produce reflex rallies, sometimes quite significant ones. Short-term traders and algorithmic systems are programmed to exploit oversold conditions.
However, those rallies should not be confused with trend reversals.
A rally becomes meaningful only when it meets our trend-change criteria.
Until that occurs, the dominant assumption remains that rallies are part of a corrective environment, not the beginning of a new advance.
It is also important to recognize that several of last week’s sharp declines developed from sideways consolidations.
Technically, that type of pattern often represents the beginning of a directional move rather than the end of one.
That’s why patience becomes essential in environments like this.
The highest-probability opportunities often come after the first wave of volatility, once the market reveals where buyers are truly willing to step in.
For now, we continue to monitor the Techno-Fundamentals — price action, sector rotation, market internals, and macro influences — to determine when conditions shift from defensive to opportunistic.
Nothing changes in how we operate. We will continue to trade the same price patterns, manage risk the same way, and let the market—not opinions—tell us when opportunity is present.
If you're not in the Green Room with us, log in to YouTube, Facebook, or Twitter to get our pre-market review at 9 AM ET. If you can't make it, you can view the recording.
Good trading and enjoy the day off on Monday for President’s Day.
TREND MATRIX
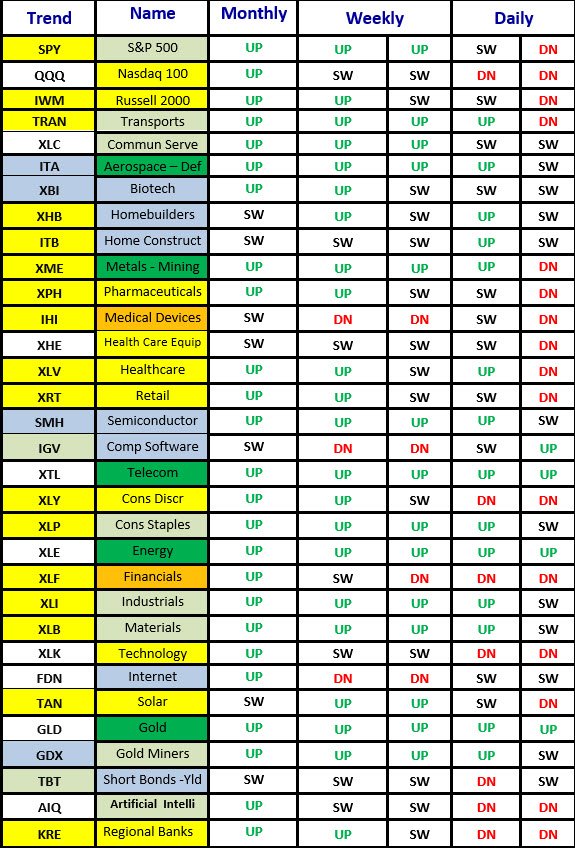
Structure of the Matrix
Each row represents a sector ETF or market index. The columns show the trend across three timeframes:
• Monthly – Long-term trend
• Weekly – Intermediate trend
• Daily – Short-term trend
The weekly and daily timeframes have two columns.
The right column shows the current trend.
The column immediately to the left shows the previous week's trend.
This allows you to instantly see trend changes from one week to the next, which is where many trading opportunities develop.
For example:
A row that reads:
Weekly: UP → SW
means the weekly trend shifted from Up to Sideways during the past week.
These changes are often the earliest warning signs of trend transitions.
Interpreting Trend Changes
The most important information in the matrix is not just the trend itself — it is the change in trend from the prior week.
Some of the most common and important transitions include:
Up → Sideways
Often the first sign of trend deterioration.
Historically, this frequently leads to Down next, particularly when the weekly trend is already weakening.
What the Current Matrix Is Showing
At the moment, the matrix shows broad trend instability.
Many sectors remain bullish on the monthly timeframe, but the daily trends have deteriorated rapidly.
This is why many rows appear yellow.
The yellow signals caution rather than outright bearish conditions.
However, the number of abrupt shifts from Up to Down in a single week suggests that volatility has increased significantly.
These kinds of sudden transitions are typical during:
• Macro shocks
• Geopolitical events
• Rapid sector rotation
S&P Sector ETFs – Sorted by Weekly Percent Change
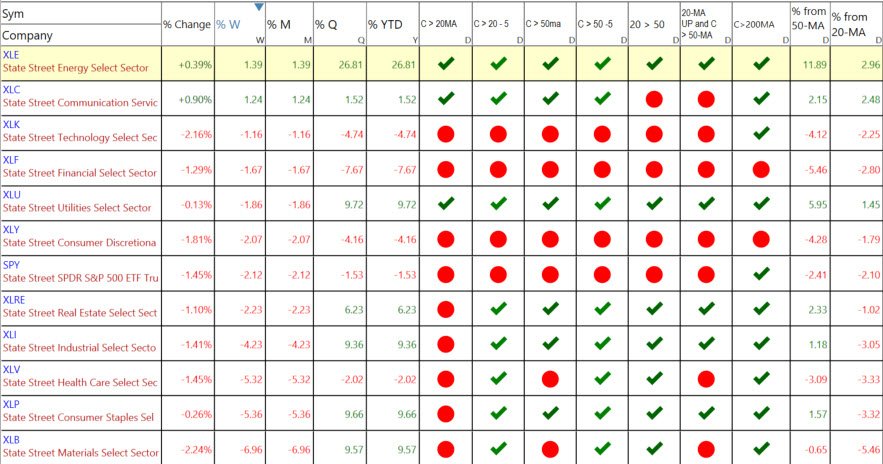
S&P 500 Sector Matrix Overview
After the percentage performance columns, the matrix displays seven technical indicators that quickly summarize trend health.
These include:
Close above or below the 20-day moving average
This tells us whether a sector is maintaining short-term momentum.
Close above or below the 20-MA five days ago (C > 20 –5)
This helps identify whether the sector has improved or deteriorated during the week.
Close above or below the 50-day moving average
The 50-MA is an important intermediate-term trend reference used by institutions.
Close above or below the 50-MA five days ago (C > 50 –5)
This allows us to quickly see shifts in trends during the week.
20-MA above or below the 50-MA
When the 20-MA is above the 50-MA, the trend structure is bullish.
20-MA pointed upward, and the close was above the 50-MA
This confirms a healthy upward trend with momentum.
Close above or below the 200-MA
The 200-MA represents the long-term trend and institutional support zone.
By reviewing the matrix week to week, we can quickly determine:
• Which sectors are strengthening
• Which sectors are weakening
• Which trends are intact
• Which sectors are becoming extended
Right now, the message is clear.
Energy remains the strongest trend but is becoming extended. Several cyclical sectors are weakening, and the broader market is showing increasing dispersion between leaders and laggards.
That type of environment typically results in more selective trading conditions, where sector rotation becomes more important than broad market exposure.
For traders using Master Trader Technical Strategies, this matrix helps narrow the focus to where institutional money is flowing — and just as importantly, where it is leaving.
The sector matrix above provides a quick “at-a-glance” view of institutional money flow. Rather than looking at charts one by one, the matrix lets us immediately see which sectors are strengthening, deteriorating, or simply moving sideways.
The first columns show percentage performance across multiple time frames — Friday, the week, month, quarter, and year-to-date. Those numbers tell us where money is flowing in the short term and whether that strength or weakness is part of a broader trend.
The columns that follow provide the technical condition of each sector relative to key moving averages, which helps determine the health of the trend and whether sectors are extended or weakening.
Together, these columns allow us to quickly answer several important questions:
- Which sectors are leading or lagging week to week
- Which trends are strengthening or deteriorating
- Which sectors are becoming extended and vulnerable to pullbacks
What the Matrix Shows This Week
At a glance, the Energy sector (XLE) continues to stand out as the clear leader. Not only has it been the strongest sector recently, but it is now nearly 12% above its 50-day moving average. That kind of distance tells us two things simultaneously:
Institutions are aggressively accumulating energy stocks.
The sector is becoming extended and vulnerable to profit-taking or consolidation.
Strong trends often become extended before correcting, so this type of reading is not bearish by itself — but it does suggest that new entries require careful timing.
Communication Services (XLC) also shows relative strength, maintaining a solid position above key moving averages.
On the other side of the spectrum, several sectors are clearly showing technical deterioration.
Technology (XLK), Financials (XLF), Consumer Discretionary (XLY), and the S&P 500 ETF (SPY) have all slipped below important moving averages and show multiple red signals in the matrix. This indicates that institutional sponsorship has weakened in those areas over the short term.
When several cyclical sectors weaken simultaneously, it often reflects a broader risk-off shift in institutional positioning.
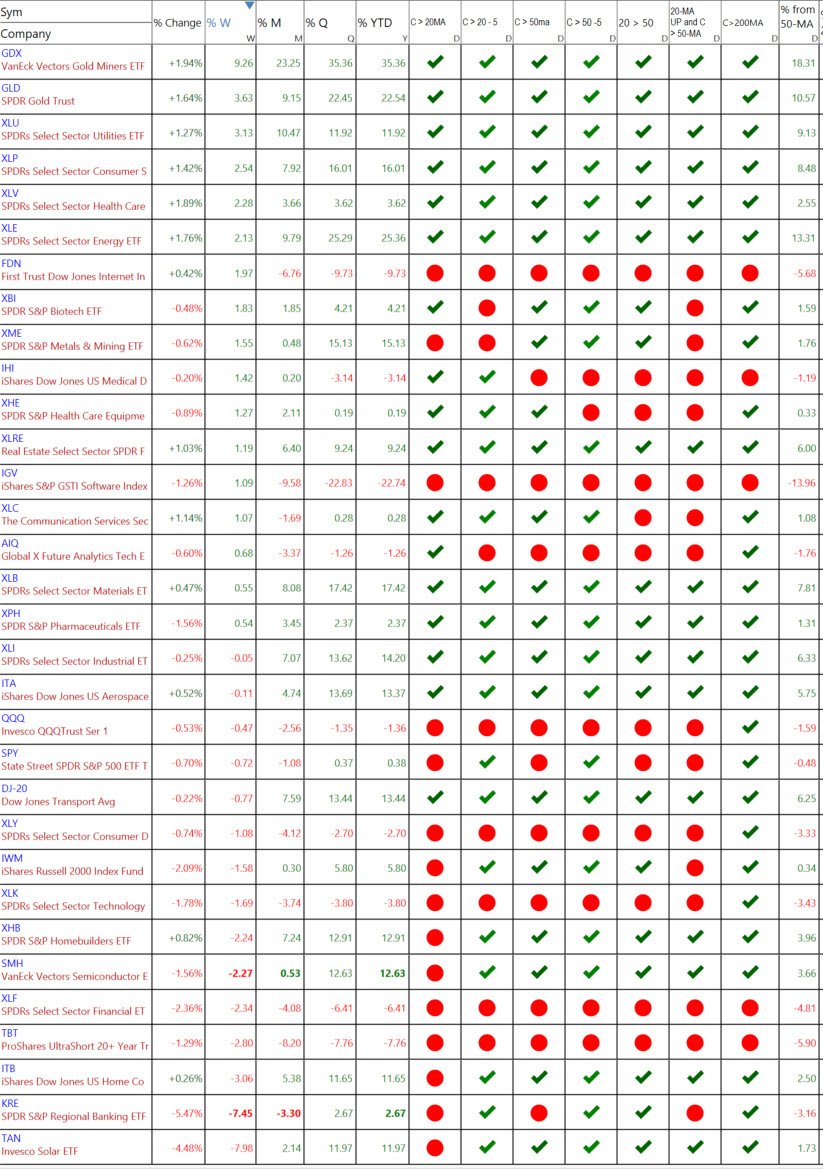
Other ETF Sectors – Sorted by Weekly Percent Change
See the Video Below
VIDEO REVIEW OF ETF SECTORS - Click lower right to open Full Screen.
NEW ETF TRADE IDEAS
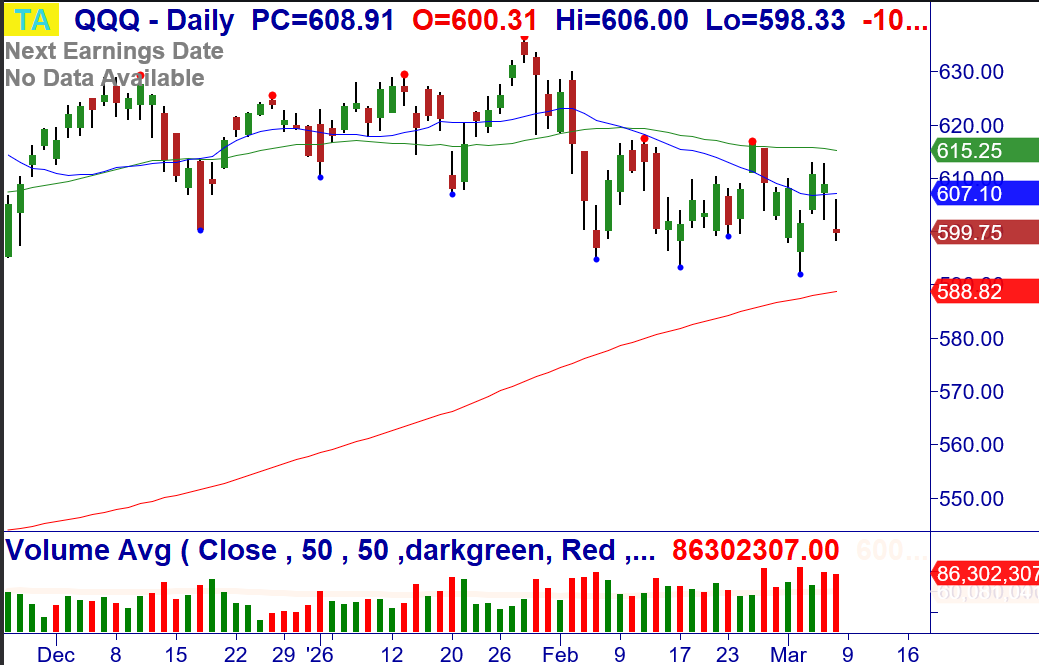
3/9: QQQ (and SMH) – Breakdowns, short watch.
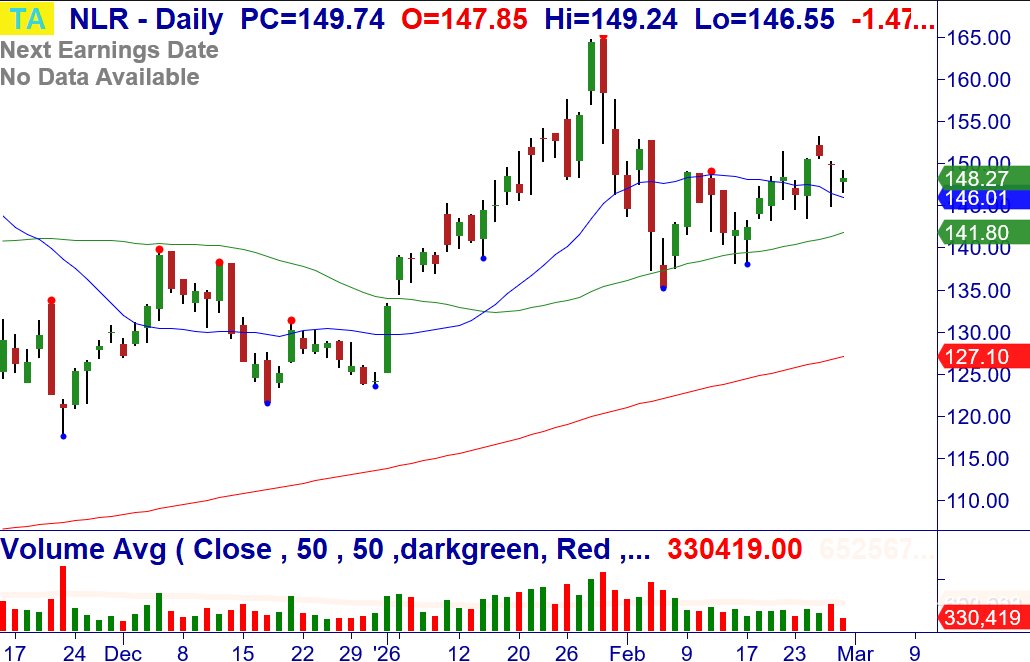
3/2: VanEck Uranium and Nuclear ETF (NLR) - Over $150.25, consider buying a half lot of the ETF. Pullback after Breakout, Buy Setup and reversal at the 20-MA weekly. Stop $138.09.
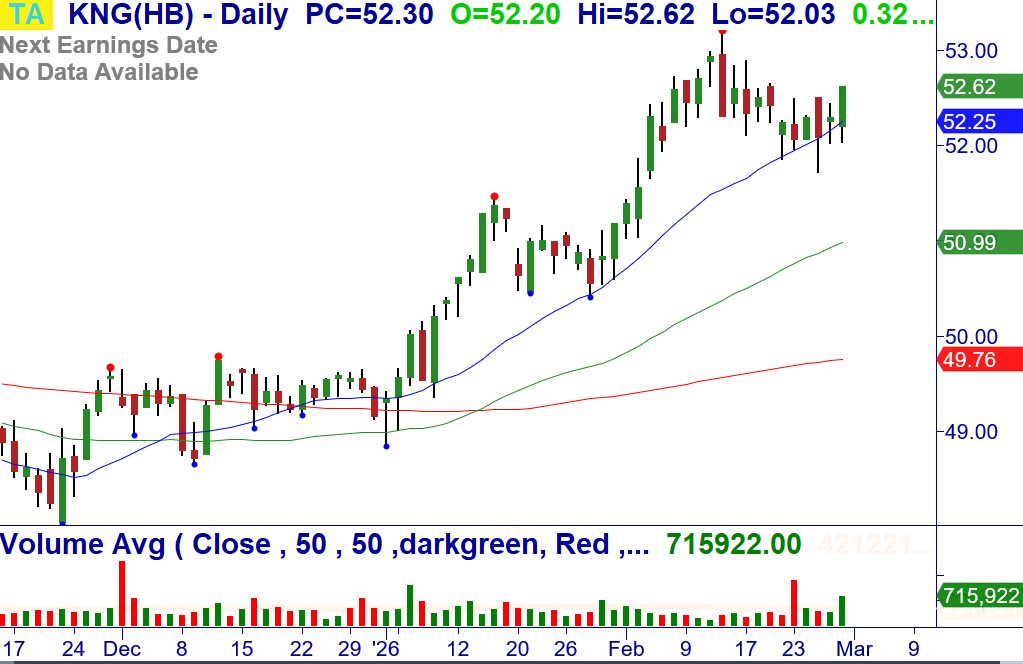
3/2: FT Cboe Vest S&P 500 Dividend Aristocrats Target Income ETF (KNG) – Over $52.62, consider buying the ETF. Breakout at the 20-MA, Buy Setup and reversal weekly. Stop $50.99 (50-MA).
OPEN AND CLOSED ETF POSITIONS WITH TRADE UPDATES (NOTE: Also in Member's Area in Open/Closed Trade Sheet)
2/20: Global X Robotics & Artificial Intelligence ETF (BOTZ) – Bought the ETF at $39.03. Breakout all time frames. 3/4: Move Stop $35.80.
2/9: Pacer US Small Cap Cash Cows Index (CALF) – Bought a ½ lot of the ETF at $46.50. +WRB Breakout to all-time highs at the 20-MA. 3/7: Buy ½ over $46.24. Stop $44.54.
2/9: Global X FinTech ETF (FINX) – Bought a 1/2 lot of the ETF at $24.75. Climactic Buy Setup and +180 reversal on +Vol. 2/25: Bought a ½ lot at $24.15. 3/7: Move Stop $23.75.
2/23: SPDR Gold Shares (GLD) – Over $468.62, consider buying the ETF. Breakout at the 20-MA, bullish +1234 weekly. 3/2: First 1/3 target is $499.50. Move Stop $479.10.
2/13: iShares Bitcoin Trust ETF (IBIT) – Bought a ½ lot of the ETF at $38.73. Climactic Buy Setup and +180 reversal on +Vol. 2/25: Bought ½ at $39.39. 3/7: Move Stop $37.16.
3/3: iShares Expanded Tech-Software Sector ETF (IGV) - Bought the ETF at $84.55. Anticipated Breakout of a bottoming pattern at the 20-MA. 3/7: Move Stop $80.88.
2/9: iShares US Aerospace & Defense ETF (ITA) – Over $235.38, consider buying the ETF. Buy Setup and reversal at the 20-MA, bullish weekly/monthly. 2/13: Bought ½ at $237.04. Stopped.
3/2: VanEck Uranium and Nuclear ETF (NLR) - Over $150.25, consider buying a half lot of the ETF. Pullback after Breakout, Buy Setup and reversal at the 20-MA weekly. Stopped.
2/9: Invesco S&P 500 Eql Wght ETF (RSP) – Bought the ETF at $202.50. +WRB Breakout to all-time highs at the 20-MA. Stopped.
2/2: State Street Real Estate Select Sector SPDR ETF (XLRE) - Bought a 1/2 lot of the ETF at $41.53. Buy Setup and reversal at the 20/50/200-MA, bullish weekly/monthly. 2/9: Bought ½ at $41.91. 2/17: Sold 1/2 at $46.80. Stopped.
1/28: State Street Utilities Select Sector SPDR ETF (XLU) – Bought a 1/2 lot of the ETF at $43.56. +WRB Breakout of a bottoming pattern at the 20/50-MA. 2/10: Bought ½ at $43.88. 2/13: Sold 1/3 at $45.86. Stopped.
Master Trader and You Building Your Financial Future Together!
Happy trading! If you have any questions or comments, please e-mail Greg Capra at Greg@mastertrader.com or Dan Gibby at Dan@mastertrader.com
All the best,
Greg Capra Managing Director of Master Trader
Dan Gibby Chief Options Strategist
NOTE: Master Trader will show the opening and closing prices of all stock and options trades. We recommend that all traders and investors use proper share sizing for both position sizing and money management. However, we cannot recommend what that is for your particular trading style, risk tolerance, or account balance. We urge you to calculate your own share/position size based on your individual risk parameters, Trading Plan, and familiarity with the proposed trade strategy and associated risks. Advanced Management Strategies (AMS) covers in detail the foundation and advanced position and money management.
NOTE: Master Trader and its representatives may have existing positions in actual or other trade recommendations before or after those suggested herein. Additionally, we may manage them differently for internal purposes based on different risk parameters than noted herein. All trade ideas and content are for informational and educational purposes only. It is not, nor is it intended to be, trading or investment advice or a recommendation that any security, option, or investment strategy is suitable for any person. Trading securities can involve high risk and the loss of any funds. Significant gaps or volatility can increase these losses, particularly for short option strategies. Investment or trading information provided may not be appropriate for all investors, and is provided without respect to individual financial sophistication, financial situation, investing time horizon or risk tolerance. Supporting documentation for any claims (including claims made on behalf of options programs), comparison, statistics, or other technical data, if applicable, will be supplied upon request. Master Trader Consulting, Inc. is not a licensed financial advisor, registered investment advisor, or a registered broker-dealer. Options, futures, and futures options are not suitable for all investors.
