

The most significant news of the week occurred over the weekend when the U.S. and Israel attacked Iran and killed Ayatollah Ali Khamenei, the country’s supreme leader for nearly four decades, among others.
Donald Trump announced Khamenei’s death on Saturday, which was also confirmed by Iranian authorities. The US president said the bombing will continue “uninterrupted throughout the week or, as long as necessary to achieve our objective of PEACE THROUGHOUT THE MIDDLE EAST AND, INDEED, THE WORLD!” Israel has continued to bombard Iran on Sunday.
Iran has responded with strikes on Israel and across the Middle East, targeting countries that host US military bases, including Bahrain, Qatar, Kuwait, Kuwait, and the UAE.
Other news was higher inflation readings; mixed earnings, including a negative reaction to NVDA’s earnings; and Trump’s increased tariff threats.
Markets showed stark rotation: defensives led amid growth concerns, while cyclicals like materials and energy held firm. Financials suffered most from squeezed margins and AI/credit worries; tech lagged on software/AI jitters.
Strength was seen in Utilities, Consumer Staples, Healthcare, Energy, and Materials.
Weakness persisted in Financials, Software, parts of Technology, and select AI leaders.
When defensive sectors lead while Financials deteriorate, it is a cautionary message — not outright bearish, but clearly cautious.
At the same time, Materials and Transports are not collapsing. That argues against recession panic.
The 10-year yield dropped below 4%, signaling expectations of slower economic growth, a higher probability of Fed easing, or capital rotating toward safety.
The political drama continues with a partial government shutdown which starting on 2/14 over funding of Department of Homeland Security and ICE. Many employees, including TSA workers, are now working without pay.
Nevertheless, for the week, the S&P, Dow, IWM, and Nasdaq fell between 0.5% to 1.0%, all fairly rangebound
A few earnings reports this week that could give us additional insight into software bottoming and/or rotation are CrowdStrike (CRWD), Target (TGT), and Ross Stores (ROST) on Tuesday. Broadcom (AVGO) on Wednesday, and Marvel Technology (MRVL), Ciena (CIEN), and Costco (COST) on Thursday.
Nothing changes in how we operate. We will continue to trade the same price patterns, manage risk the same way, and let the market—not opinions—tell us when opportunity is present.
If you're not in the Green Room with us, log in to YouTube, Facebook, or Twitter to get our pre-market review at 9 AM ET. If you can't make it, you can view the recording.
Good trading and enjoy the day off on Monday for President’s Day.
TREND MATRIX
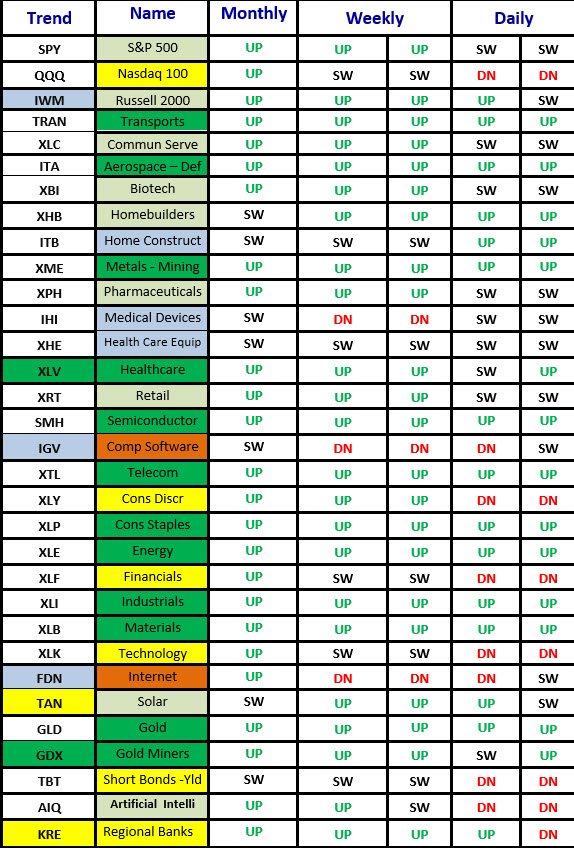
The Trend Matrix Continues to have mixed messages.
Markets showed stark rotation: defensives led amid growth concerns, while cyclicals like materials and energy held firm. Financials suffered most from squeezed margins and AI/credit worries; tech lagged on software/AI jitters.
Key S&P 500 sector performers (weekly): Utilities (XLU): +2.5–3.0% (top performer, safe-haven flows)
Consumer Staples (XLP): +2.6–2.7%
Energy (XLE): +2.0% (oil firmness on geopolitics)
Health Care (XLV): +1.7–2.2% (strong Friday buying, bullish wide-range bar above resistance)
Materials (XLB): +0.9% (strong uptrend, sideways consolidation hints at breakout potential)
Consumer Discretionary (XLY): -1.0% (prior breakdown but basing on the rising 200-day MA; Friday's close near highs suggests stabilization). The pattern is another example of prices at an inflection point.
Industrials/Transports: Industrials ~-0.7%; transports sideways near all-time highs in uptrend. This fact counters the narrative of a severe slowdown. More confusion, yes, we’ve gotten used to it.
Financials (XLF) and Regional Banks (KRE) are the worst performers, with a sharp rate drop adding pressure.
S&P Sector ETFs – Sorted by Weekly Percent Change
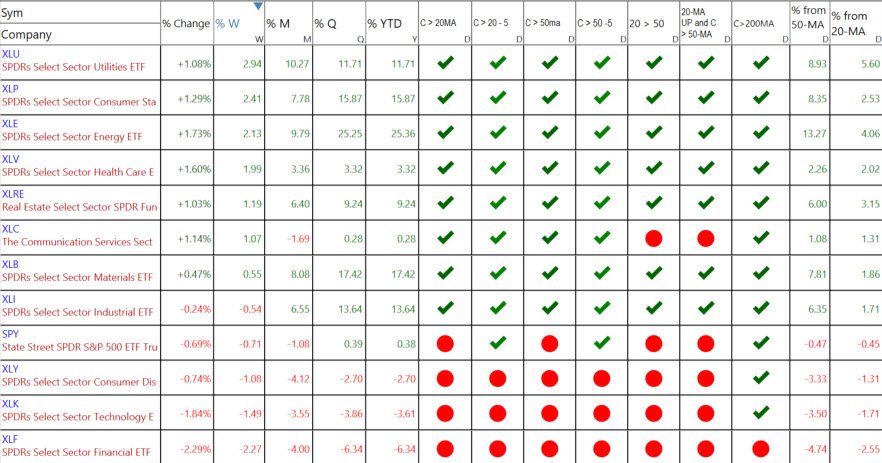
Last week’s percentage changes.
The percentage changes tell you which sectors were the strongest or weakest on Friday and for the week, month, quarter, and year.
There are seven columns after the percent changes in the sector listed above.
You can see the ETFs that are the strongest getting stronger or weakening.
- Close above or below the 20-MA.
- Close above or below the 20-MA 5 Days Ago. C>20 -5
- Close above or below the 50-MA.
- Close above or below the 50-MA 5 Days Ago. C>50 -5
- 20-MA above or below the 50-MA.
- 20-MA is pointed up, and the close is above the 50-MA

Use Coupon Code - Candles
Other ETF Sectors – Sorted by Weekly Percent Change
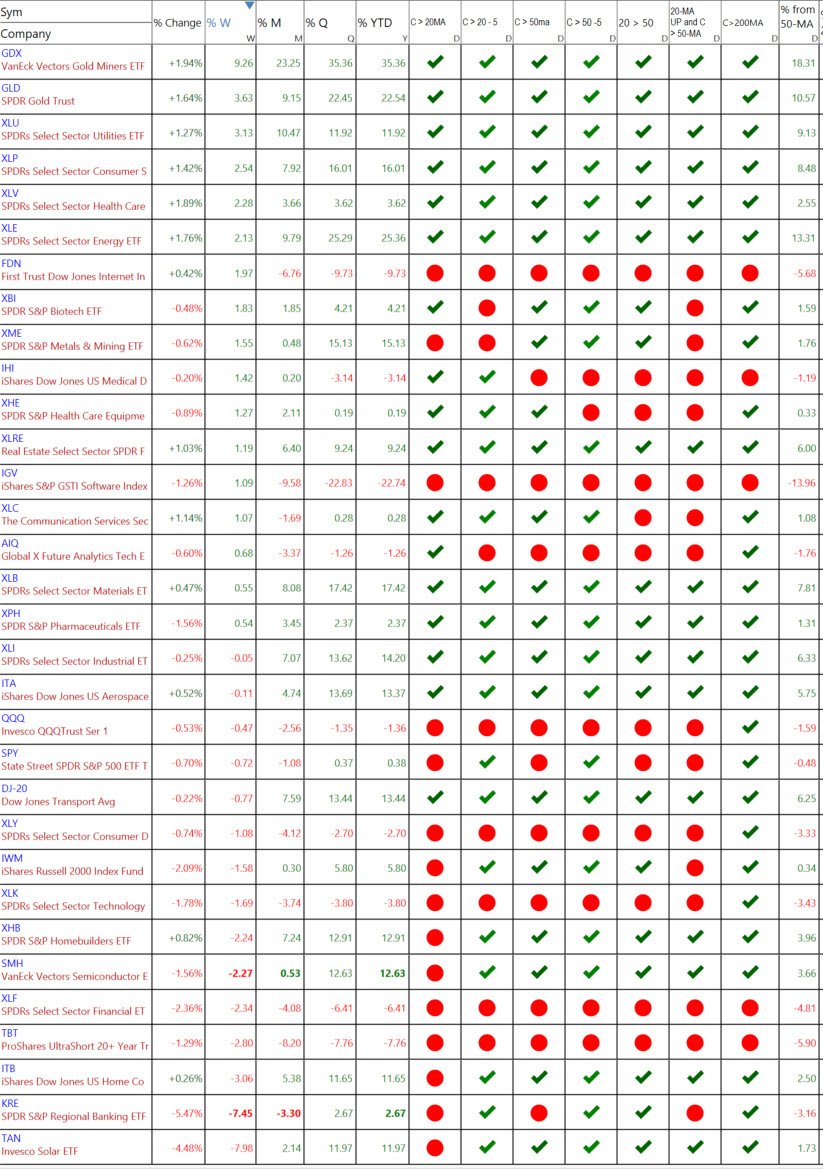
See the Video Below
VIDEO REVIEW OF ETF SECTORS - Click lower right to open Full Screen.
NEW ETF TRADE IDEAS
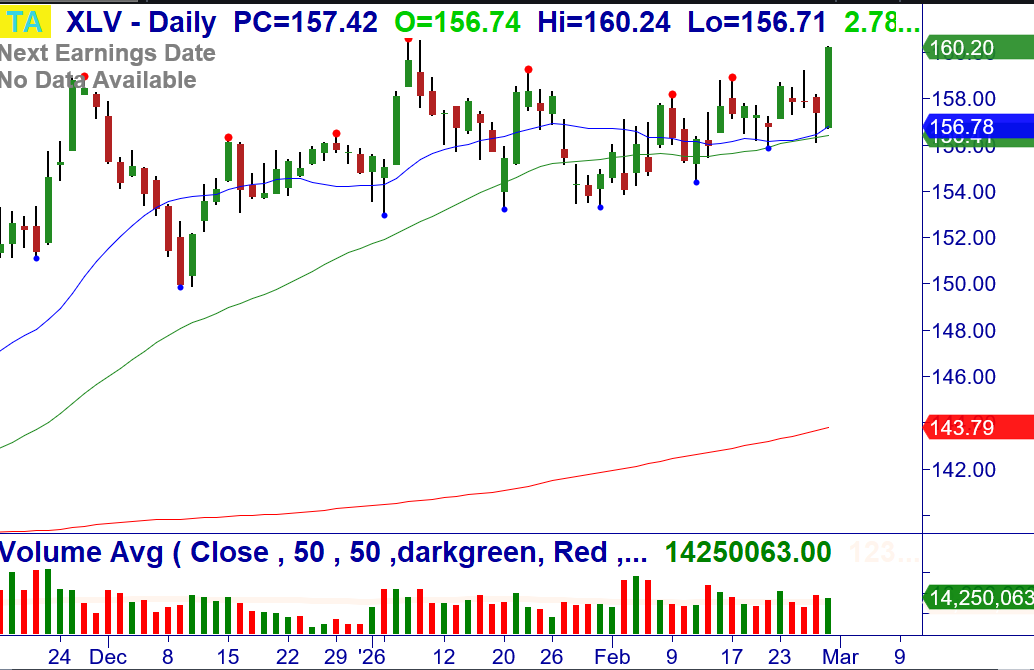
3/2: State Street Health Care Select Sector SPDR ETF (XLV) – Over $160.24, consider buying the ETF. +WRB Breakout daily/weekly. Stop $155.86.
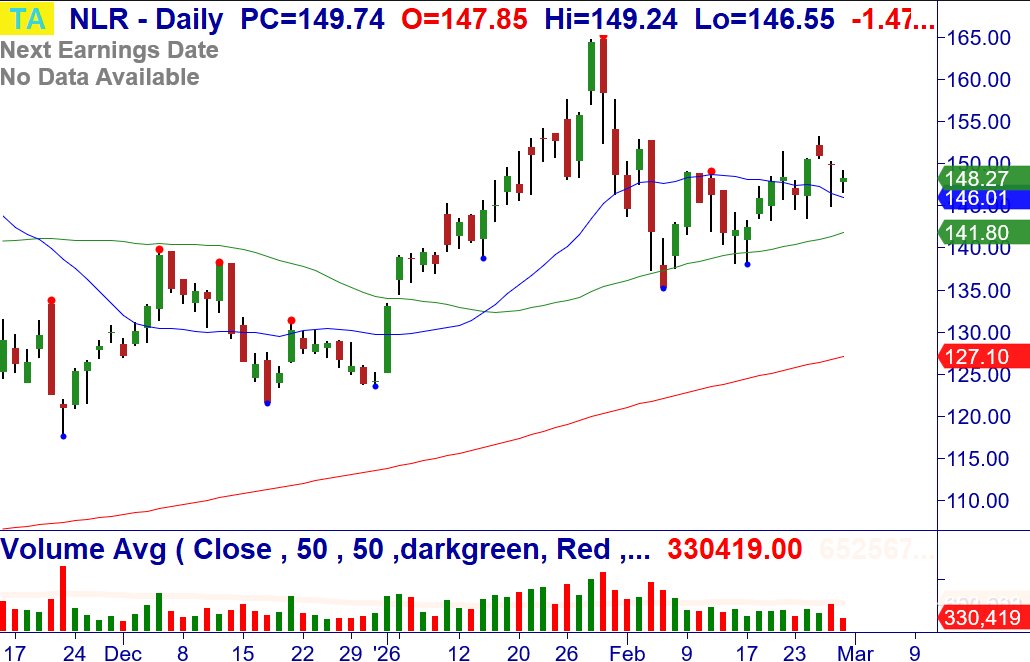
3/2: VanEck Uranium and Nuclear ETF (NLR) - Over $150.25, consider buying a half lot of the ETF. Pullback after Breakout, Buy Setup and reversal at the 20-MA weekly. Stop $138.09.
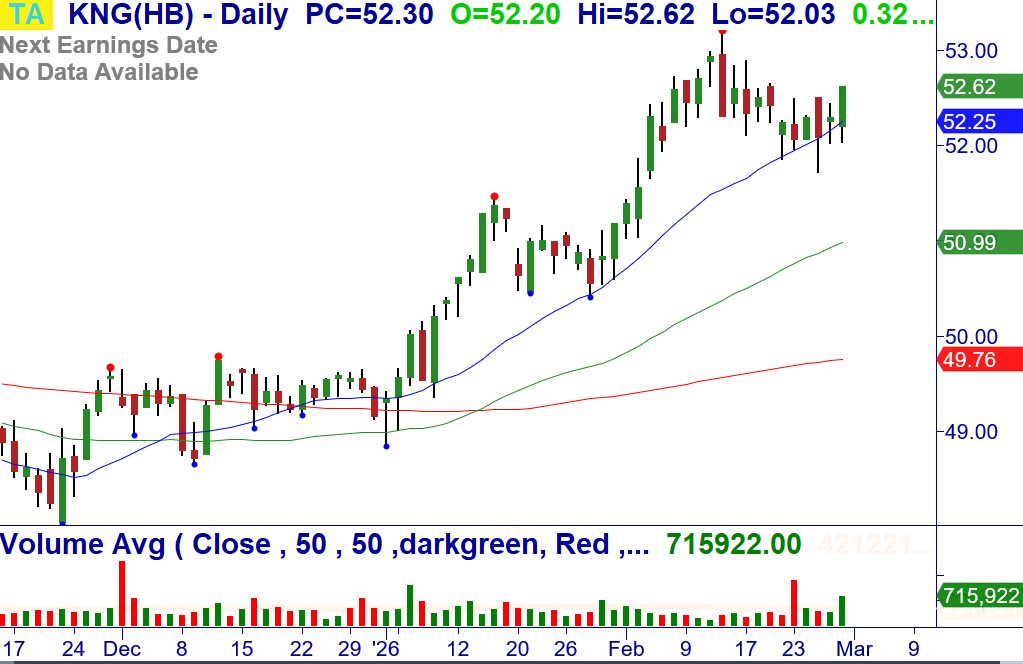
3/2: FT Cboe Vest S&P 500 Dividend Aristocrats Target Income ETF (KNG) – Over $52.62, consider buying the ETF. Breakout at the 20-MA, Buy Setup and reversal weekly. Stop $50.99 (50-MA).
OPEN AND CLOSED ETF POSITIONS WITH TRADE UPDATES (NOTE: Also in Member's Area in Open/Closed Trade Sheet)
2/20: Global X Robotics & Artificial Intelligence ETF (BOTZ) – Bought the ETF at $39.03. Breakout all time frames. Move Stop $37.36 (50-MA).
2/9: Pacer US Small Cap Cash Cows Index (CALF) – Consider buying a ½ lot of the ETF on a pullback between $46.40 – 46.60. +WRB Breakout to all-time highs at the 20-MA. Stop $44.54.
2/9: Global X FinTech ETF (FINX) – Bought a 1/2 lot of the ETF at $24.75. Climactic Buy Setup and +180 reversal on +Vol. 2/21: Buy a ½ lot over $24.15. Stop $22.09.
2/13: iShares Bitcoin Trust ETF (IBIT) – Bought a ½ lot of the ETF at $38.73. Climactic Buy Setup and +180 reversal on +Vol. 2/14: Buy ½ over $39.38. Stop $33.46.
2/23: SPDR Gold Shares (GLD) – Over $468.62, consider buying the ETF. Breakout at the 20-MA, bullish +1234 weekly. Stop $440.34.
2/13: iShares Expanded Tech-Software Sector ETF (IGV) – Bought a ½ lot of the ETF at $83.94. Climactic Buy Setup and +180 reversal on +Vol. 2/13: Bought ½ at $83.18. Stop $76.48.
2/9: iShares US Aerospace & Defense ETF (ITA) – Over $235.38, consider buying the ETF. Buy Setup and reversal at the 20-MA, bullish weekly/monthly. 2/13: Bought ½ at $237.04. 2/21: Move Stop $233.35.
2/9: Invesco S&P 500 Eql Wght ETF (RSP) – Bought the ETF at $202.50. +WRB Breakout to all-time highs at the 20-MA. Stop $196.24.
2/2: State Street Real Estate Select Sector SPDR ETF (XLRE) - Bought a 1/2 lot of the ETF at $41.53. Buy Setup and reversal at the 20/50/200-MA, bullish weekly/monthly. 2/9: Bought ½ at $41.91. 2/17: Sold 1/2 at $46.80. 2/21: Move Stop $42.11 (20-MA).
1/28: State Street Utilities Select Sector SPDR ETF (XLU) – Bought a 1/2 lot of the ETF at $43.56. +WRB Breakout of a bottoming pattern at the 20/50-MA. 2/10: Bought ½ at $43.88. 2/13: Sold 1/3 at $45.86. 2/21: Move Stop $44.13 (20-MA).
Master Trader and You Building Your Financial Future Together!
Happy trading! If you have any questions or comments, please e-mail Greg Capra at Greg@mastertrader.com or Dan Gibby at Dan@mastertrader.com
All the best,
Greg Capra Managing Director of Master Trader
Dan Gibby Chief Options Strategist
NOTE: Master Trader will show the opening and closing prices of all stock and options trades. We recommend that all traders and investors use proper share sizing for both position sizing and money management. However, we cannot recommend what that is for your particular trading style, risk tolerance, or account balance. We urge you to calculate your own share/position size based on your individual risk parameters, Trading Plan, and familiarity with the proposed trade strategy and associated risks. Advanced Management Strategies (AMS) covers in detail the foundation and advanced position and money management.
NOTE: Master Trader and its representatives may have existing positions in actual or other trade recommendations before or after those suggested herein. Additionally, we may manage them differently for internal purposes based on different risk parameters than noted herein. All trade ideas and content are for informational and educational purposes only. It is not, nor is it intended to be, trading or investment advice or a recommendation that any security, option, or investment strategy is suitable for any person. Trading securities can involve high risk and the loss of any funds. Significant gaps or volatility can increase these losses, particularly for short option strategies. Investment or trading information provided may not be appropriate for all investors, and is provided without respect to individual financial sophistication, financial situation, investing time horizon or risk tolerance. Supporting documentation for any claims (including claims made on behalf of options programs), comparison, statistics, or other technical data, if applicable, will be supplied upon request. Master Trader Consulting, Inc. is not a licensed financial advisor, registered investment advisor, or a registered broker-dealer. Options, futures, and futures options are not suitable for all investors.
